

Life Beyond 65: Changing Spatial Patterns of Survival at Older Ages in the United States, 2000-2016
- PMID: 31995196
- PMCID: PMC7161363
- DOI: 10.1093/geronb/gbz160
Life Beyond 65: Changing Spatial Patterns of Survival at Older Ages in the United States, 2000-2016
Abstract
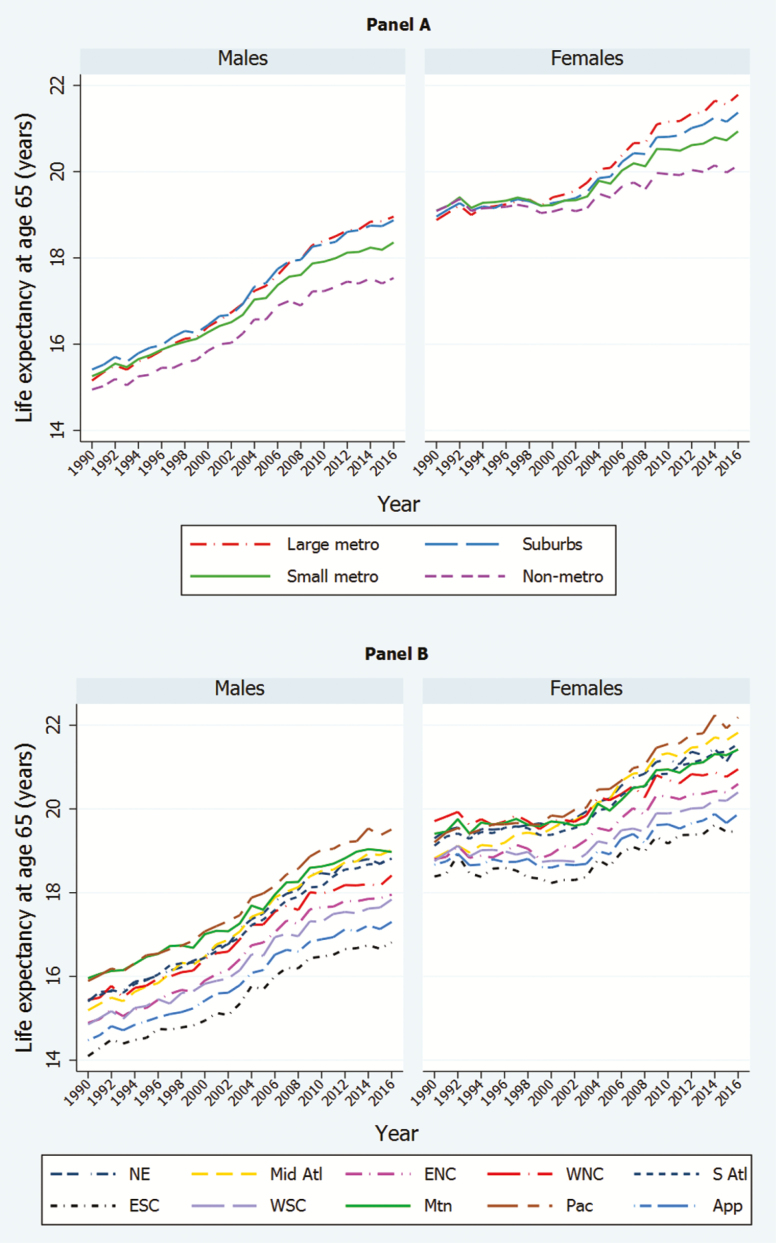
Objectives: To identify levels and trends in life expectancy at age 65 (e65) by geographic region and metropolitan status in the United States.
Methods: Using county-level data on population and deaths from the Census and National Center for Health Statistics, we consider spatial inequality in e65 across 4 metropolitan types and 10 geographic regions from 2000 to 2016. We examine whether changes in e65 are driven by mortality developments in metro types or geographic regions, and compare spatial patterns in the United States to mortality trends in other Organization of Economic Cooperation and Development (OECD) countries. We use decomposition and regression methods to estimate the contributions of 10 causes of death to changes and inequalities in e65.
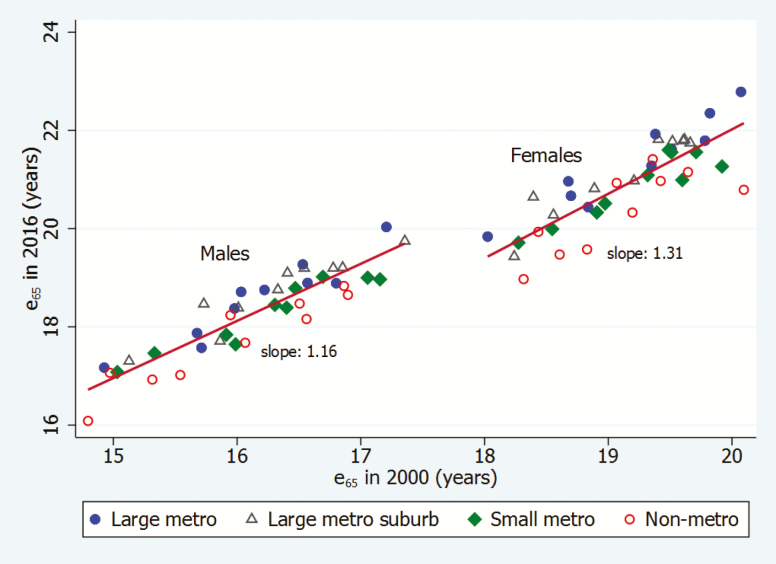
Results: Life expectancy at age 65 increased in all spatial units from 2000 to 2016. Areas with higher e65 in 2000 also experienced larger gains. Longevity increases were greatest in large metropolitan areas and coastal regions. Nonmetropolitan areas and the interior lagged far behind not only other parts of the United States but all OECD comparison countries. Metropolitan status was a better predictor of mortality changes than geographic region. Circulatory diseases and diseases associated with smoking were the principal sources of life expectancy gains and spatial differentiation in those gains. Larger gains in smoking-related mortality accounted for greater improvements among men than women.
Discussion: Even at advanced ages, large geographic disparities in life expectancy remain. And as mortality has declined, these disparities have widened. Public health efforts should pay special attention to identifying and ameliorating the sources of lagging life expectancy in nonmetropolitan regions.
Keywords: Demography; Geography; Health disparities; Life expectancy; Mortality.
© The Author(s) 2020. Published by Oxford University Press on behalf of The Gerontological Society of America.
Figures
References
-
- Arias E., & Xu J. Q (2018). United States Life Tables 2015. National Vital Statistics Report, 67, 1– 63. National Center for Health Statistics, Hyattsville, MD, USA: https://www.cdc.gov/nchs/data/nvsr/nvsr67/nvsr67_07-508.pdf - PubMed
-
- Arriaga E. E. (1984). Measuring and explaining the change in life expectancies. Demography, 21, 83–96. doi:10.2307/2061029 - PubMed
-
- Behavioral Risk Factor Surveillance System (2019). Prevalence of self-reported obesity among U.S. adults by state and territory (BRFSS 2018) Centers for Disease Control and Prevention. https://www.cdc.gov/obesity/data/prevalence-maps.html#overall
