. 2020 Mar 1;123(3):1120-1132.
doi: 10.1152/jn.00628.2019. Epub 2020 Jan 29.

Short-term plasticity in glomerular inhibitory circuits shapes olfactory bulb output

Affiliations

Short-term plasticity in glomerular inhibitory circuits shapes olfactory bulb output

Fu-Wen Zhou et al. J Neurophysiol. .

Abstract

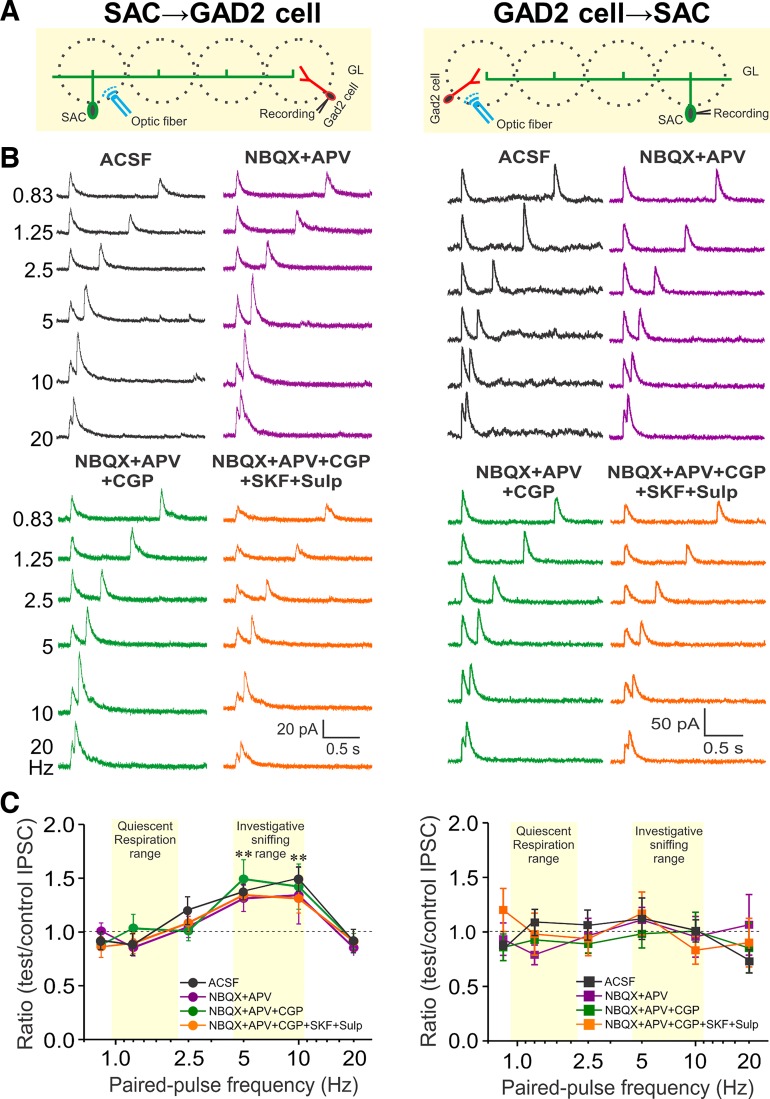
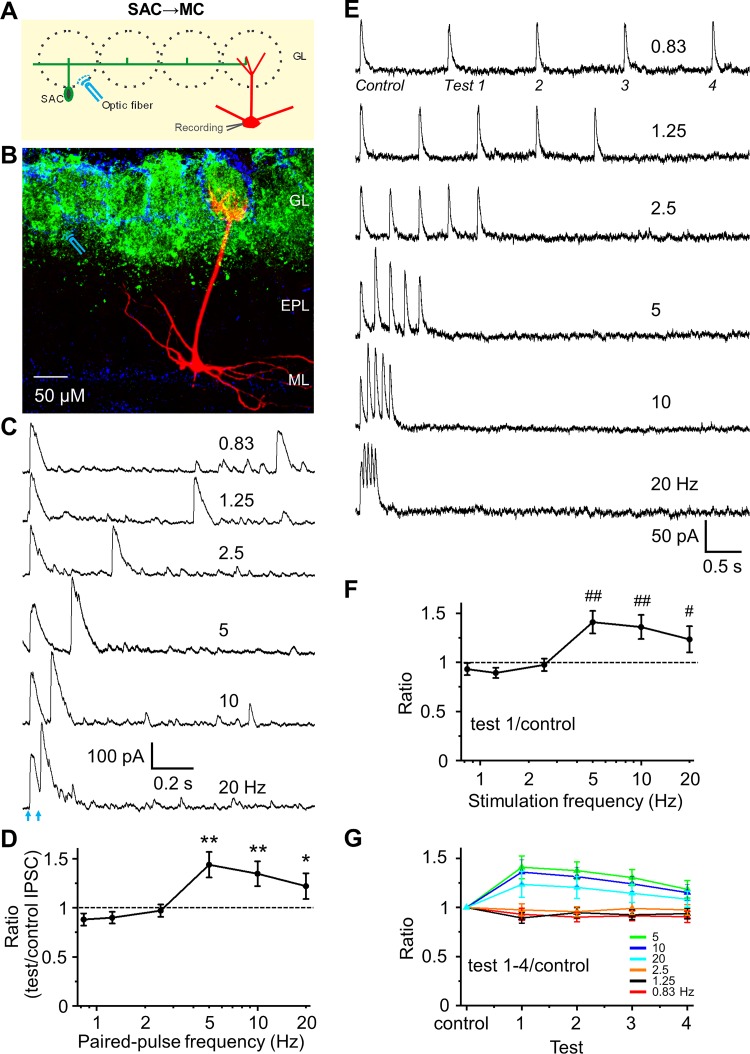
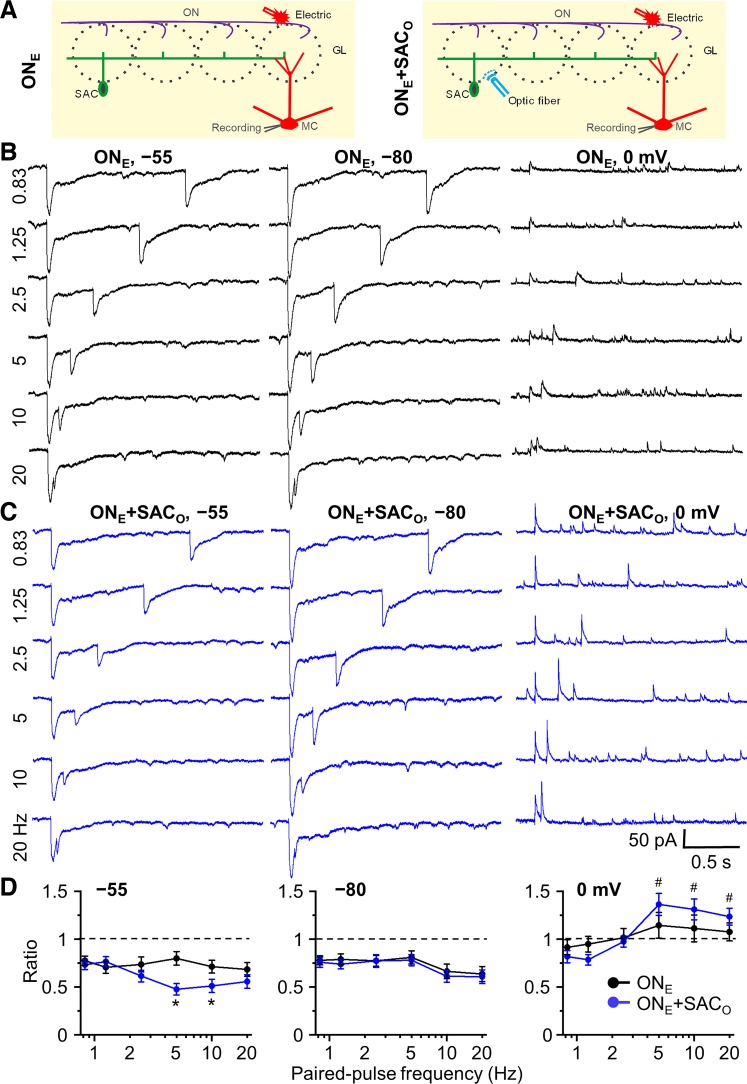
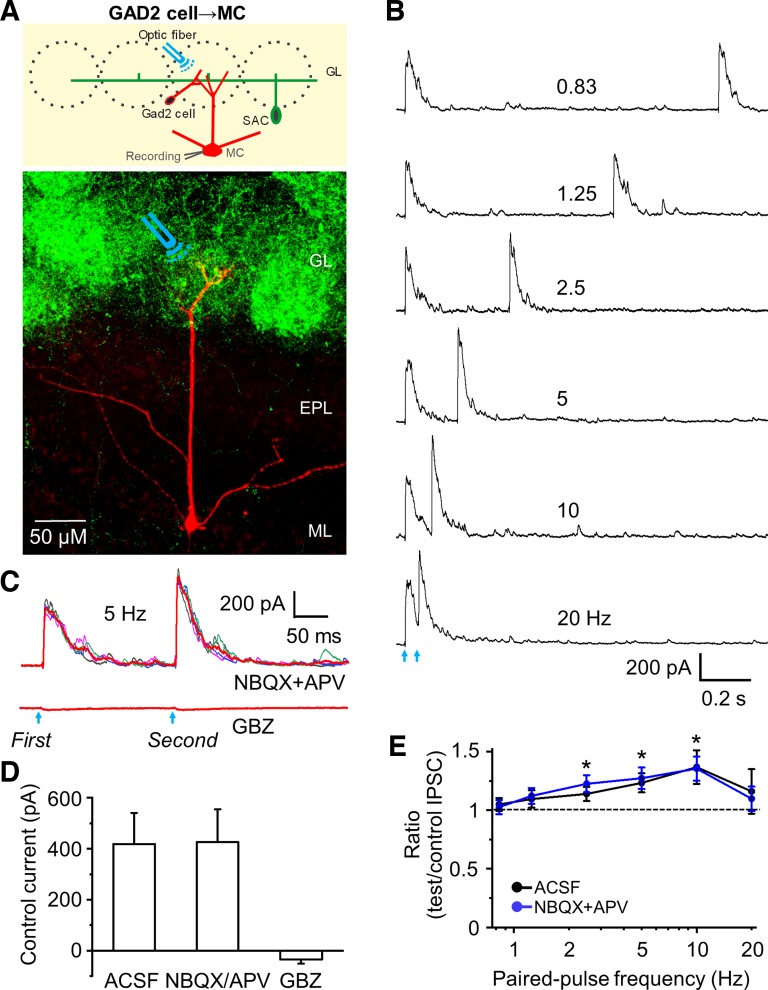
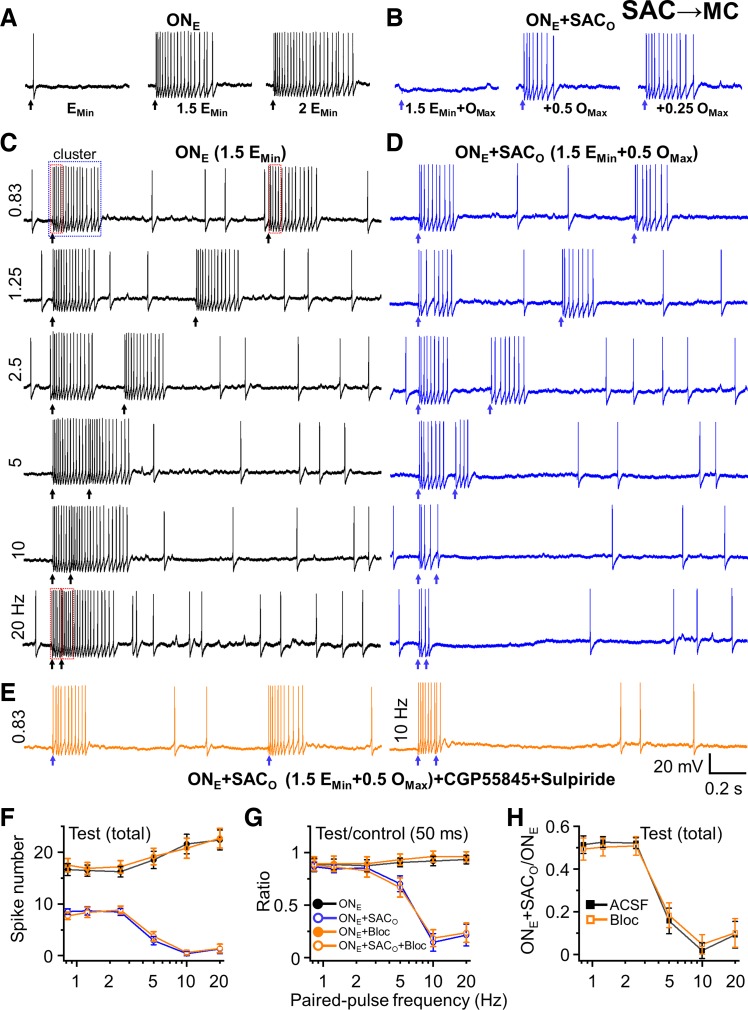
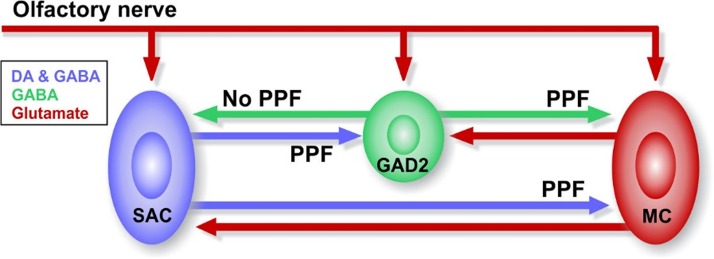
Short-term plasticity is a fundamental synaptic property thought to underlie memory and neural processing. The glomerular microcircuit comprises complex excitatory and inhibitory interactions and transmits olfactory nerve signals to the excitatory output neurons, mitral/tufted cells (M/TCs). The major glomerular inhibitory interneurons, short axon cells (SACs) and periglomerular cells (PGCs), both provide feedforward and feedback inhibition to M/TCs and have reciprocal inhibitory synapses between each other. Olfactory input is episodically driven by sniffing. We hypothesized that frequency-dependent short-term plasticity within these inhibitory circuits could influence signals sent to higher-order olfactory networks. To assess short-term plasticity in glomerular circuits and MC outputs, we virally delivered channelrhodopsin-2 (ChR2) in glutamic acid decarboxylase-65 promotor (GAD2-cre) or tyrosine hydroxylase promoter (TH-cre) mice and selectively activated one of these two populations while recording from cells of the other population or from MCs. Selective activation of TH-ChR2-expressing SACs inhibited all recorded GAD2-green fluorescent protein(GFP)-expressing presumptive PGC cells, and activation of GAD2-ChR2 cells inhibited TH-GFP-expressing SACs, indicating reciprocal inhibitory connections. SAC synaptic inhibition of GAD2-expressing cells was significantly facilitated at 5-10 Hz activation frequencies. In contrast, GAD2-ChR2 cell inhibition of TH-expressing cells was activation-frequency independent. Both SAC and PGC inhibition of MCs also exhibited short-term plasticity, pronounced in the 5-20 Hz range corresponding to investigative sniffing frequency ranges. In paired SAC and olfactory nerve electrical stimulations, the SAC to MC synapse was able to markedly suppress MC spiking. These data suggest that short-term plasticity across investigative sniffing ranges may differentially regulate intra- and interglomerular inhibitory circuits to dynamically shape glomerular output signals to downstream targets.NEW & NOTEWORTHY Short-term plasticity is a fundamental synaptic property that modulates synaptic strength based on preceding activity of the synapse. In rodent olfaction, sensory input arrives episodically driven by sniffing rates ranging from quiescent respiration (1-2 Hz) through to investigative sniffing (5-10 Hz). Here we show that glomerular inhibitory networks are exquisitely sensitive to input frequencies and exhibit plasticity proportional to investigative sniffing frequencies. This indicates that olfactory glomerular circuits are dynamically modulated by episodic sniffing input.

Keywords: STP; mitral cells; network; olfactory bulb; periglomerular cells; short axon cells.


Conflict of interest statement

No conflicts of interest, financial or otherwise, are declared by the authors.

Figures

Fig. 1.
Fig. 1.
Differential short-term plasticity at reciprocal inhibitory synapses between short axon cells (SACs) and glutamic acid decarboxylase (GAD)2-expressing cells. A: schematic diagram showing the experimental design of optical stimulation of channelrhodopsin-2 (ChR2)-SACs (left) or GAD2 cells (right) and recording from GAD2 cells (left) or SACs (right). B: voltage-clamp recording from a GAD2 cell (left) or SAC (right) held at 0 mV in response to paired-pulse light stimulation at 6 different frequencies (0.83, 1.25, 2.5, 5, 10, and 20 Hz) in artificial cerebrospinal fluid (ACSF; black), 1,2,3,4-Tetrahydro-6-nitro-2,3-dioxo-benzo[f]quinoxaline-7-sulfonamide (NBQX) + d-2-amino-5-phosphonovalerate (APV) (purple), NBQX+APV+CGP55845 (CGP) (10 µM, green), and further addition of D1/D2 blockers [10 µM SKF83566 (SKF) and 100 µM sulpiride (Sulp)] (NBQX+APV+CGP+SKF+Sulp, orange). C: group data showing paired-pulse ratio of light-evoked inhibitory postsynaptic current (IPSC) peak amplitude of the test pulse to the control pulse at 6 different stimulation frequencies from 5 periglomerular cells and 8 SACs in ACSF and different treatments. **P < 0.01.
Fig. 2.
Fig. 2.
Frequency-dependent short-term facilitation of synapses from short axon cells (SACs) to mitral cells (MCs). A: schematic diagram showing the experimental design of optical stimulation of channelrhodopsin-2 (ChR2)-SACs and recording from MCs. B: labeling of ChR2 in SACs (green), DAPI (blue), and biocytin-filled MC (red). Optical stimulation of ChR2-SACs was performed at ~300 µm distance from the apical dendrite of voltage clamp-recorded MC. C: example traces of optical stimulation (arrows)-evoked inhibitory postsynaptic currents (IPSCs) from a MC held at 0 mV in response to paired-pulse optical stimulation at 6 different frequencies (0.83, 1.25, 2.5, 5, 10, and 20 Hz) in artificial cerebrospinal fluid (ACSF). D: group data showing paired-pulse ratio (PPR) of evoked IPSC peak amplitude of the test pulse to the control pulse at different frequencies in ACSF. Optical stimulation induces paired-pulse facilitation at frequency of 5, 10, and 20 Hz, with a significantly larger ratio than 1. E: example traces of a train of 5-pulse optical stimulation-evoked IPSCs from another cell. F: population data for ratio of IPSC peak amplitude of the test pulse 1 to control, evoking PPR equivalent to the paired pulse experiment in D. G: population data for ratio of IPSC peak amplitude of the test pulses 1–4 to control. A train of 5-pulse optical simulation-induced short-term synaptic facilitation of each IPSC in the sequence with a progressive decline in magnitude with continued stimulations in the train. **P < 0.01, *P < 0.05, ##P < 0.01, and #P < 0.05 vs. PPR = 1; n = 7 for D and n = 5 for F and G. EPL, external plexiform layer; GL, glomerular layer; ML, mitral cell layer.
Fig. 3.
Fig. 3.
Impact of frequency-dependent short-term plasticity of short axon cell (SAC) inhibition on olfactory nerve electrical stimulation-induced synaptic currents in mitral cells (MCs). A: schematic diagram showing the experimental design of electric stimulation of olfactory nerve (ONE, left) and both ONE and optical stimulation of channelrhodopsin-2 (ChR2)-SACs (ONE+SACO, right). B: MC currents were recorded at 3 different holding potentials: −55 mV (~MC resting membrane potential; Liu and Shipley 2008), −80 mV [to isolate excitatory postsynaptic currents (EPSCs) with minimal Cl driving force for inhibitory postsynaptic currents (IPSCs)], and 0 mV (to isolate IPSCs by enhancing Cl driving force and minimizing EPSCs). Example traces of paired-pulse electric stimulation-induced EPSCs (inward current) at the holding potential of −55 and −80 mV, and IPSCs (outward current) at 0 mV with different paired-pulse frequencies of 0.83, 1.25, 2.5, 5, 10, and 20 Hz. C: example traces of ONE+SACO-induced EPSCs and IPSCs at different holding potentials with different paired-pulse frequencies. D: group data for paired-pulse ratio of postsynaptic currents of the test pulse to the control at the holding potentials of −55, −80, and 0 mV with different paired-pulse frequencies. ONE and ONE+SACO at different frequencies consistently induced paired-pulse depression of EPSCs at holding potential of −55 and −80 mV. ONE+SACO significantly increased paired-pulse depression at holding potential −55 mV at frequency of 5 and 10 Hz but did not enhance the depression at −80 mV at all frequencies. In contrast, at holding potential of 0 mV, ONE+SACO induced paired-pulse facilitation at 5, 10, and 20 Hz; ONE alone did not induce significant paired-pulse plasticity. The strength of optical and electric stimulation was adjusted to 50% maximal IPSC (at holding potential of 0 mV) and EPSC (−55 mV), respectively, so that either enhanced or suppressed IPSCs/EPSCs could be observed. Optical stimulation: 0.6–4 mW; electric stimulation: 15–45 µA. *P < 0.01 vs. ONE and #P < 0.01 vs. ratio of 1; n = 6. GL, glomerular layer.
Fig. 4.
Fig. 4.
Activation of channelrhodopsin-2 (ChR2)-glutamic acid decarboxylase (GAD)2 cells evokes paired-pulse facilitation of inhibitory postsynaptic currents (IPSCs) in mitral cells (MCs). A: schematic diagram showing the experimental design of optical stimulation of ChR2-GAD2 cells and recording from MC (upper) as well as labeling of ChR2 in GAD2 cells and their dense dendrites (green) and biocytin-filled MC (red) (bottom). Optical stimulation of ChR2-GAD2 cells that synapse with apical dendritic tufts of MC was performed. B: example traces showing evoked IPSCs in artificial cerebrospinal fluid (ACSF) in MC at holding potential of 0 mV in response to paired-pulse optical stimulation at 6 different frequencies. C: example of 4 individual traces and the averaged trace (red) of synaptic currents at stimulation of 5 Hz in 1,2,3,4-Tetrahydro-6-nitro-2,3-dioxo-benzo[f]quinoxaline-7-sulfonamide (NBQX; 10 µM) + d-2-amino-5-phosphonovalerate (APV; 50 µM), and gabazine (GBZ; 10 µM). D: group data showing the peak amplitude of optical stimulation-evoked IPSCs to the control pulse in ACSF (n = 10), NBQX+APV (n = 7), and GBZ (n = 10). Combination of NBQX and APV did not change the peak amplitude of IPSC to control and test pulse. Neither individual NBQX nor APV changed the peak amplitude (both n = 3, not shown). GBZ completely blocked IPSCs. E: group data showing paired-pulse ratio of optical stimulation-evoked IPSC peak amplitude of the test pulse to the control in ACSF (n = 10) and NBQX+APV (n = 7). Paired-pulse facilitation was observed at 2.5, 5, and 10 Hz with ratios significantly larger than 1, and the ratios increased with increasing stimulation frequency from 0.83 to 10 Hz. *P < 0.01 vs. paired-pulse ratio of 1. EPL, external plexiform layer; GL, glomerular layer; ML, mitral cell layer.
Fig. 5.
Fig. 5.
Impact of paired-pulse plasticity of short axon cell (SAC) to mitral cell (MC) synapses on MC spiking. A: spike number of firing cluster increases with increasing intensity of electric stimulation from minimum intensity (EMin; operationally defined in multiples of the minimum current required to elicit a spike in each recorded MC, 20 µA in this cell, range: 10–25 µA in all cells), 1.5 times EMin (eliciting ~50% of maximal spiking), to twofold of EMin (2 EMin, eliciting maximal MC spiking). B: optical stimulation completely or partially reverses electric stimulation (1.5 EMin)-induced firing. Maximum optical stimulation (OMax,) is operationally defined as the fraction of the optical stimulation intensity that abolished all spiking elicited by 1.5 EMin in each recorded MC (1.8 mW in this cell, range: 1.3–4.0 mW in all cells). Lower optical stimulations, 0.5 OMax (0.9 mW) and 0.25 OMax (0.45 mW), induce partial inhibition of electric stimulation-induced firing. C: paired-pulse electric stimulation (1.5 EMin) does not induce paired-pulse plasticity with a similar spike number of firing cluster to control and test pulse up to 5 Hz, with a modest enhancement of spike number to the test pulse present at 5, 10, and 20 Hz. D: paired optical stimulation (0.5 OMax) induced an inhibition of 1.5 EMin-induced firing cluster to test and control pulse at all frequencies. As frequency increases above 5 Hz, the magnitude of optical suppression of spiking in the test stimulation is enhanced, whereas there is no enhancement at frequencies of 2.5 Hz or less. E: blockade of GABAB and D2 receptor (10 µM CGP55845+100 µM sulpiride) did not change the inhibition of SACs in MC spiking. Example traces show similar spike number of firing cluster in test pulse to control at example frequency of 0.83 Hz, but much less spike number in test pulse to control at 10 Hz. F: total spike number of firing cluster to test pulse after stimulation shows that electric stimulation induces similar spike number of firing cluster at different stimulation frequencies from 0.83–20 Hz, but optical stimulation partially inhibits 1.5 EMin electric stimulation-induced firing cluster with less spike number at higher stimulation frequencies of 5, 10, and 20 Hz compared to lower stimulation frequencies (0.83, 1.25, and 2.5 Hz). G: group data showing ratios (spike number of firing cluster to test pulse/control pulse) much less than 1 (‘paired-pulse depression’) at 5, 10, and 20 Hz with both electric and optical stimulation (ONE+SACO) but not electric stimulation alone (ONE). Blockade of GABAB and D2 receptor (Bloc, 10 µM CGP55845+100 µM sulpiride) did not change the ratios. To obtain ratios, the stimulation-induced 250–300 ms firing cluster (blue dot box in C) and the spike numbers in a 50-ms poststimulation time window (red dot boxes in C) were assessed. This window was chosen at 20 Hz because there is only a 50-ms interstimulus interval in total. To validate this approach, we compared the first 50-ms window against a total spiking epoch for the low frequencies of 0.83, 1.25, and 2.5 Hz, which have sufficient interstimulus interval to do so. The ratio of spike number from either whole firing cluster or only partial 50-ms window immediately after stimulations was similar. This indicated that the analysis of a 50-ms window provides a reasonable comparison for the spiking ratio of the paired-pulse events across the entire frequency range. Legends in G apply to F. H: ratio of total spike number of firing cluster to the test/second pulse with both electric stimulation and optical stimulation to electric stimulation alone (ONE+SACO/ONE) also shows that optical stimulation at higher frequencies (5, 10, and 20 Hz) induces a firing cluster with much less spike number than at low frequencies (0.83, 1.25, and 2.5 Hz) that was not changed by blockade of GABAB and D2 receptor (‘Bloc’). n = 7 for artificial cerebrospinal fluid (ACSF) and n = 6 for Bloc in F, G, and H.
Fig. 6.
Fig. 6.
Diagrammatic representation of short-term plasticity between glomerular interneurons and mitral cells (MCs) in the olfactory bulb. DA, dopamine; GAD2, glutamic acid decarboxylase 2; PPF, paired-pulse facilitation; SAC, short axon cell.

Similar articles

Cited by

References

    1. Aroniadou-Anderjaska V, Zhou FM, Priest CA, Ennis M, Shipley MT. Tonic and synaptically evoked presynaptic inhibition of sensory input to the rat olfactory bulb via GABAB heteroreceptors. J Neurophysiol 84: 1194–1203, 2000. doi:10.1152/jn.2000.84.3.1194. - DOI - PubMed
    1. Aungst JL, Heyward PM, Puche AC, Karnup SV, Hayar A, Szabo G, Shipley MT. Centre-surround inhibition among olfactory bulb glomeruli. Nature 426: 623–629, 2003. doi:10.1038/nature02185. - DOI - PubMed
    1. Baker H, Liu N, Chun HS, Saino S, Berlin R, Volpe B, Son JH. Phenotypic differentiation during migration of dopaminergic progenitor cells to the olfactory bulb. J Neurosci 21: 8505–8513, 2001. doi:10.1523/JNEUROSCI.21-21-08505.2001. - DOI - PMC - PubMed
    1. Banerjee A, Marbach F, Anselmi F, Koh MS, Davis MB, Garcia da Silva P, Delevich K, Oyibo HK, Gupta P, Li B, Albeanu DF. An interglomerular circuit gates glomerular output and implements gain control in the mouse olfactory bulb. Neuron 87: 193–207, 2015. doi:10.1016/j.neuron.2015.06.019. - DOI - PMC - PubMed
    1. Benito N, Gaborieau E, Sanz Diez A, Kosar S, Foucault L, Raineteau O, De Saint Jan D. A pool of postnatally generated interneurons persists in an immature stage in the olfactory bulb. J Neurosci 38: 9870–9882, 2018. doi:10.1523/JNEUROSCI.1216-18.2018. - DOI - PMC - PubMed

Publication types

LinkOut - more resources