. 2020 Apr 1;31(8):725-740.
doi: 10.1091/mbc.E19-12-0725. Epub 2020 Jan 29.

Cell cycle oscillators underlying orderly proteolysis of E2F8

Affiliations

Cell cycle oscillators underlying orderly proteolysis of E2F8

Danit Wasserman et al. Mol Biol Cell. .

Abstract

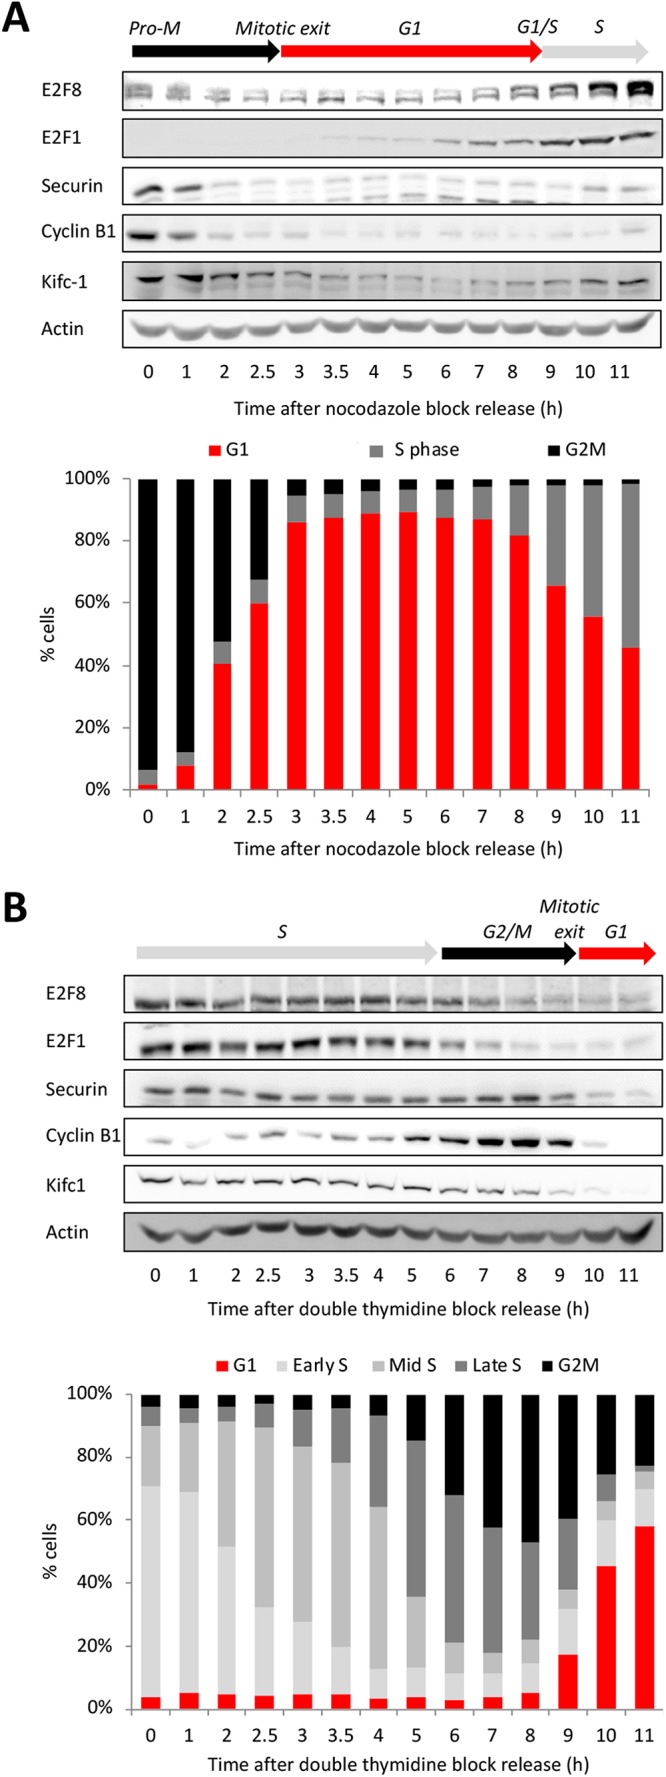
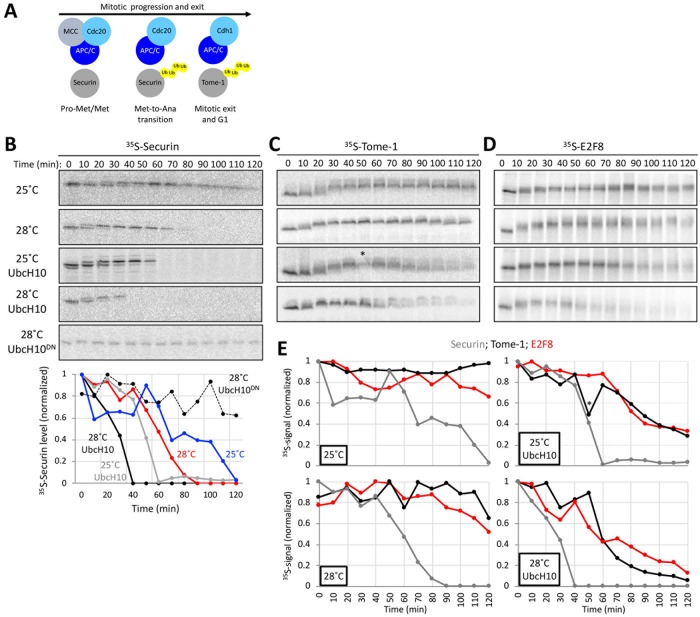
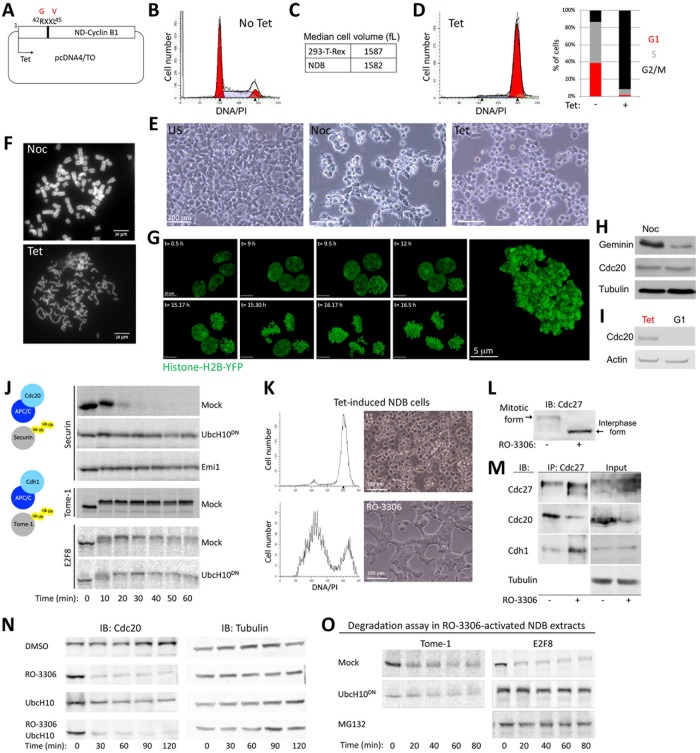
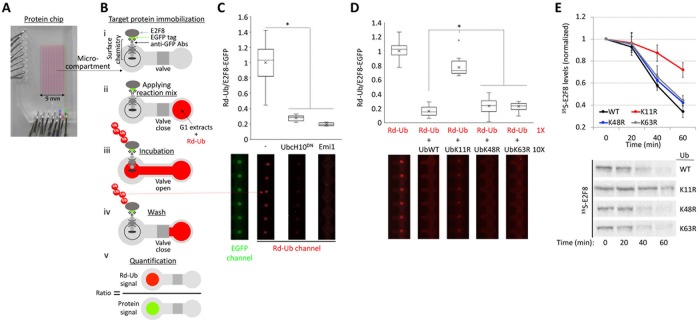
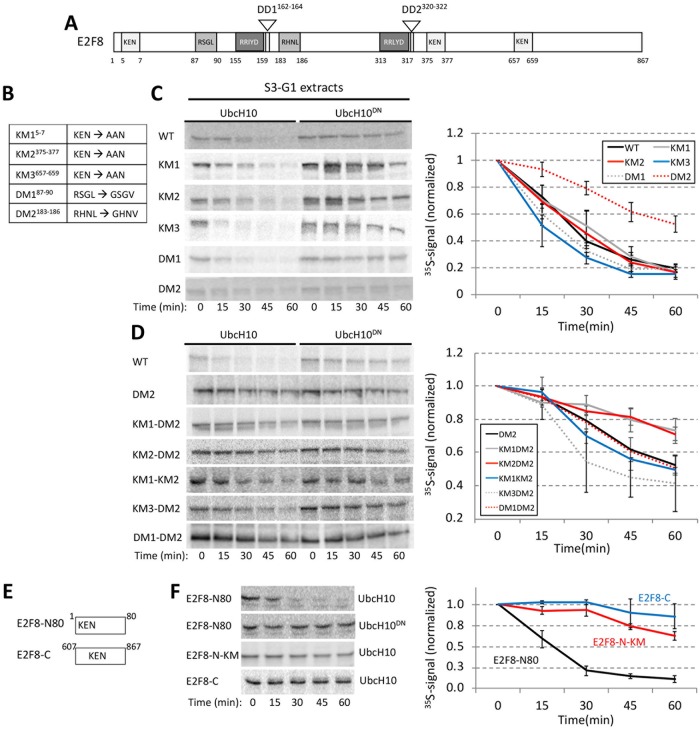
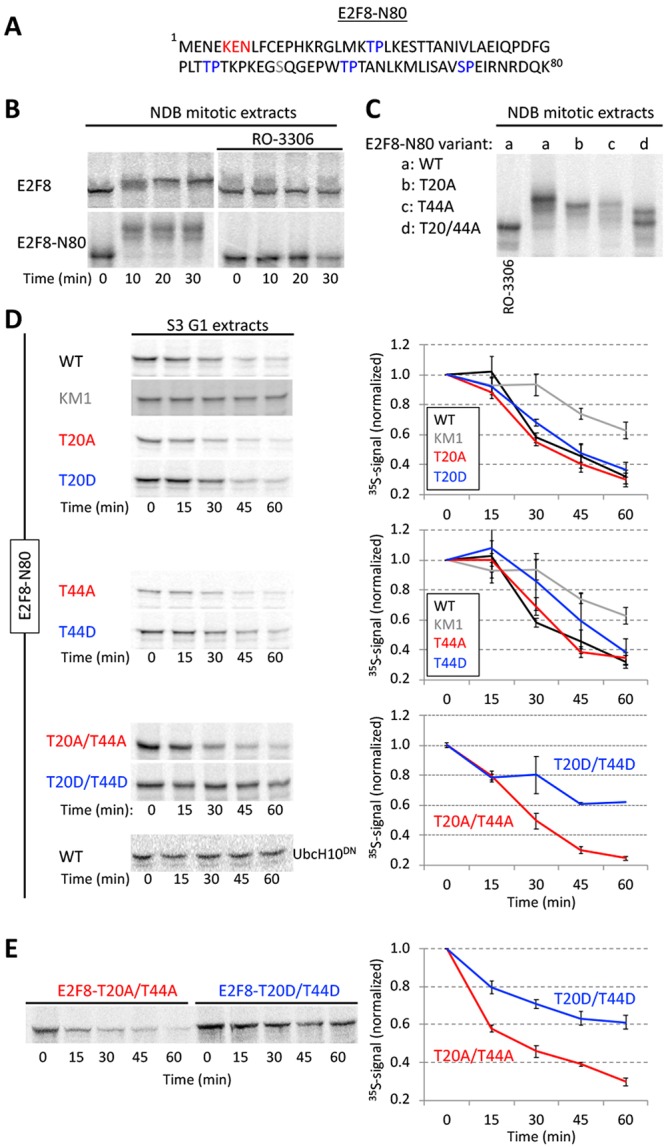
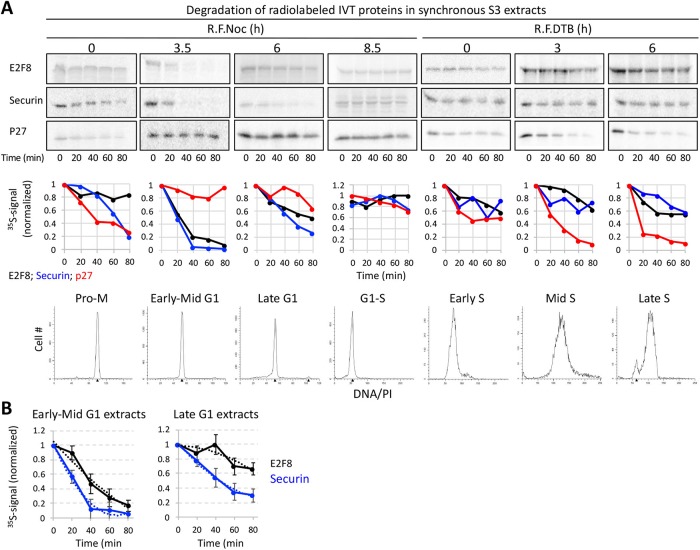
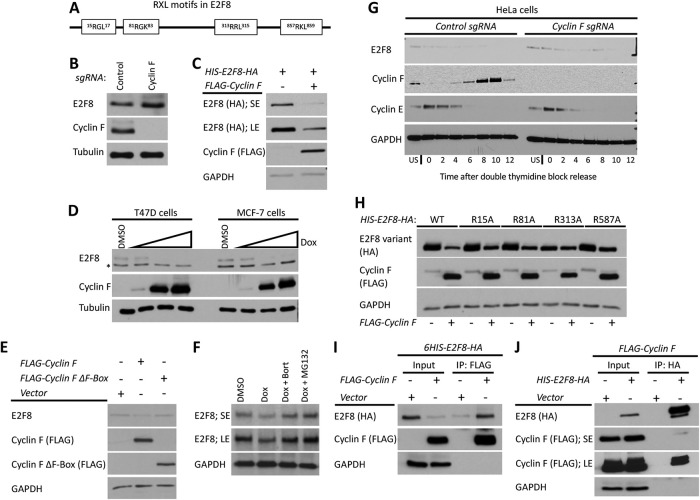
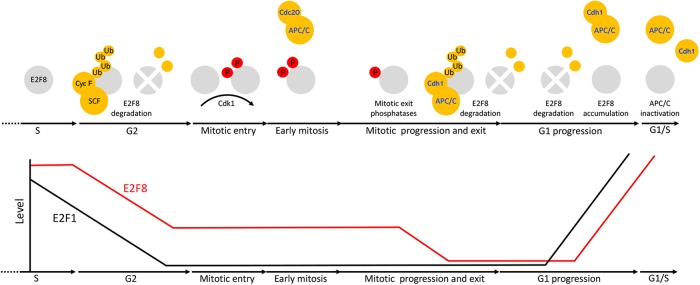
E2F8 is a transcriptional repressor that antagonizes E2F1 at the crossroads of the cell cycle, apoptosis, and cancer. Previously, we discovered that E2F8 is a direct target of the APC/C ubiquitin ligase. Nevertheless, it remains unknown how E2F8 is dynamically controlled throughout the entirety of the cell cycle. Here, using newly developed human cell-free systems that recapitulate distinct inter-mitotic and G1 phases and a continuous transition from prometaphase to G1, we reveal an interlocking dephosphorylation switch coordinating E2F8 degradation with mitotic exit and the activation of APC/CCdh1. Further, we uncover differential proteolysis rates for E2F8 at different points within G1 phase, accounting for its accumulation in late G1 while APC/CCdh1 is still active. Finally, we demonstrate that the F-box protein Cyclin F regulates E2F8 in G2-phase. Altogether, our data define E2F8 regulation throughout the cell cycle, illuminating an extensive coordination between phosphorylation, ubiquitination and transcription in mammalian cell cycle.


Figures

FIGURE 1:
FIGURE 1:
Temporal dynamics of E2F8 across the cell cycle. Western blot analyses of E2F8, E2F1, and canonical APC/C targets in synchronous S3 cells (DNA distributions are shown). Synchronization methods: release from thymidine-nocodazole block (A) and release from double thymidine block (B).
FIGURE 2:
FIGURE 2:
Temporal proteolysis of E2F8 in dynamic mitotic extracts progressing from prometaphase to G1. (A) Schematics of molecular milestones along mitosis. At prometaphase (Pro-Met) and metaphase (Met), the mitotic checkpoint complex (MCC) prevents from APC/CCdc20 to ubiquitinate Securin. MCC removal induces Securin and Cyclin B1 degradation and the metaphase-to-anaphase (Met-to-Ana) transition. The drop in Cyclin B1 levels induces the switch from APC/CCdc20 to APC/CCdh1 activity, the degradation of Tome-1 and other Cdh1-sepcific targets, and mitotic exit into G1. (B–E) Cell extracts were made from thymidine/nocodazole-arrested S3 cells. MCC removal and mitotic exit occur spontaneously in these extracts in a temperature-controlled manner or by adding recombinant UbcH10. The addition of dominant negative UbcH10 (UbcH10DN) blocks mitotic progression and exit (B). Temporal proteolysis and (de)phosphorylation-induced electrophoretic mobility shifts of Securin and Tome-1 are shown (B and C). At optimal reaction condition (UbcH10; 28°C), extracts eventually reach a G1-like state in which APC/CCdh1 is active and Tome-1 is degraded (C). Time-dependent degradations of Securin (B), Tome-1 (C), and E2F8 (D) (35S-labeled IVT products) were assayed by SDS–PAGE and autoradiography. Source data (B–D) and quantification (E) are shown (* marks a deformed band). Temporal proteolysis and electrophoretic mobility shifts of E2F8 and Tome-1 are highly similar.
FIGURE 3:
FIGURE 3:
E2F8 dynamics in APC/CCdc20-active extracts. (A) Human Cyclin B1 in which Arg-42 and Leu-45 are substituted with Gly and Val is nondegradable (ND). A colony of 293-T-REx cells stably expressing ND-Cyclin B1 (NDB) under tet-regulated CMV promoter was generated (i.e., NDB cells). (B) DNA distribution of asynchronous NDB cell population. (C) Median cell size (fL: femtoliter) of NDB cells vs. parental 293-T-REx cells. (D) DNA distribution of NDB cells following 22 h treatment with tet. Cell cycle phase distributions of NDB cells pre- and postinduction with tet are shown. (E) A panel of light phase images of NDB cells pre- and postincubation with nocodazole (Noc) or tet. (F) Noc- or tet-treated NDB cells were harvested for chromosome spreads. Representative fluorescent images of DAPI stained chromosomes are shown. (G) An image series of live NDB cells stably expressing histone-H2B following tet treatment. A higher resolution image of a live, tet-treated NDB cell with typical disorganized chromatids is shown on the right. (H) Noc- or tet-treated NDB cells were harvested for Western blotting. (I) NDB cells showing the lowest 10% forward scatter width (FSC-W) signal were sorted. These G1 cells (Vecsler et al., 2013), as well as tet-treated NDB cells, were harvested for Western blotting with the depicted antibodies. (J) Mitotic cell extracts were generated from tet-induced NDB cells. Degradation and electrophoretic mobility-shift of 35S-labeled Securin, Tome-1, and E2F8 (IVT products) were assayed in mitotic NDB extracts supplemented with mock, UbcH10DN, or APC/C inhibitor Emi1 (C-terminal fragment; recombinant). (M–P) Tet-induced NDB cells/extracts can exit mitosis into a G1-like state by blocking Cdk1 activity. (K, L) DNA distributions, light phase images (M), and immunoblot (IB) (N) of tet-induced NDB cells pre- and postincubation with RO-3306 (135 min). The mitotic vs. G1 electrophoretic mobility-shift of Cdc27 is shown. (M) Mitotic extracts were generated from tet-induced NDB cells. Coimmunoprecipitation (IP) of Cdc27 was performed pre- and posttreatment with RO-3306 (30 min). (N) Time-dependent dynamics of endogenous Cdc20 in mitotic NDB extracts following incubation with DMSO, RO-3306 and/or UbcH10. Cdc20 levels were detected by Western blotting. Loading control (Tubulin) is also shown. (O) Time-dependent degradation of Tome-1 and E2F8 (35S-labeled IVT products) in NDB mitotic extracts preactivated with RO-3306 (15 min). Reactions were mock treated or supplemented with UbcH10, UbcH10DN, or MG132.
FIGURE 4:
FIGURE 4:
Ubiquitination of E2F8 by APC/CCdh1 is primarily via K11-linked Ub chains. (A) Image of an integrated microfluidic platform comprising microcompartments isolated by pneumatic valves. (B) Each microcompartment has two chambers. Fresh E2F8-EGFP IVT product was applied to the chip and immobilized to the “Protein chamber” via anti-GFP antibodies (Abs) and a designated surface chemistry (i). Next, G1 extracts supplemented with Rd-Ub were applied to the second chamber (ii). The opening of the valve allows reaction mix to diffuse into protein chambers, enabling ubiquitination of the immobilized substrate (iii). After 10 min incubation, protein chambers are washed (iv). Rd-Ub moieties attached to E2F8-EGFP at the protein chamber are quantified by a fluorescence imaging. Rd-Ub signal in each protein chamber is normalized to E2F8-EGFP levels, i.e., “Protein signal” (v). (C) APC/CCdh1-mediated ubiquitination of E2F8 on-chip. E2F8-EGFP was expressed in reticulocyte lysate, deposited on the chip surface, and incubated with G1 extracts supplemented with mock, UbcH10DN, or Emi1. Normalized Rd-Ub signals were calculated from 20 microcompartments (mean [X], median [–], and four quantiles (box and whiskers) are indicated; *p < 0.001). Array sections showing “raw” Rd-Ub signals of six microreactions for each of the three conditions are shown (red dots). A representative image of immobilized E2F8-EGFP is also shown (green dots). (D) Ubiquitination of E2F8-EGFP was assayed in the presence of G1 extracts, Rd-Ub, and excess of unlabeled WT or mutant Ub in which Lys 11 (UbK11R), Lys 48 (UbK48R), or Lys 63 (UbK63R) was substituted with Arg. Plots average 18 microreactions. Array sections showing raw Rd-Ub signals are depicted. (E) Degradation of 35S-labeled E2F8 (IVT product) was assayed in G1 extracts supplemented with WT or mutant Ub. Time-dependent degradation was assayed by SDS–PAGE and autoradiography. Mean and SE values are plotted (n = 3). 35S-E2F8 signals are normalized to t = 0. A set of source data is shown.
FIGURE 5:
FIGURE 5:
Multiple functional motifs coordinate E2F8 proteolysis in G1. (A) Schematics of human E2F8. KEN, and RXXL motifs are shown alongside the conserved DNA-binding (RRXYD) and dimerization (DD1, DD2) domains. (B) List of E2F8 mutant variants generated by site-directed mutagenesis. Amino acid substitutions are indicated for each of the five KEN/RXXL motifs. KM1/2/3: KEN-box mutant 1/2/3; DM1/2: Destruction-box mutant 1/2. (C) Degradation of 35S-labeled E2F8 variants (IVT products) was tested in G1 extracts supplemented with UbcH10 or UbcH10DN. Time-dependent degradation was assayed by SDS–PAGE and autoradiography. Representative raw data and quantifications are shown. Mean E2F8 levels (35S signals) normalized to max signal at t = 0 are shown (n = 3–4). Bars represent SE. (D) E2F8 double mutants were analyzed as described in C. (E) Schematics of N- and C-terminal fragments of E2F8 (E2F8-N80/C) carrying a single KEN motif. (F) Time-dependent degradation of E2F8 fragments (see details in C).
FIGURE 6:
FIGURE 6:
Phosphomimetic Cdk1 sites stabilized E2F8 in G1 extracts. (A) E2F8 N-terminal fragment of 80 amino acids (E2F8-N80). KEN box and four canonical Cdk1 consensus phosphorylation sites are colored. (B) Time-dependent electrophoretic mobility shift of full length- and E2F8-N80 (35S-labeled IVT products) in NDB mitotic extracts supplemented with mock or the Cdk1 inhibitor RO-3306. (C) Thr (T)20 and/or T44 of E2F8-N80 were substituted with Ala (A). Mobility shifts of WT vs. mutant E2F8-N80 variants are shown. (D) Time-dependent degradation in G1 extracts of E2F8-N80 and the following variants: KEN box mutant (KM1), single/double phosphomimetic mutants (T-to-Asp [D]), and single/double phospho-dead mutants (T-to-A). (E) Time-dependent degradation of full-length E2F8 carrying double phosphomimetic or double phospho-dead mutations. (B–E) Protein degradations and electrophoretic mobility-shifts were assayed by SDS–PAGE and autoradiography. A set of source data is shown. Mean and SE calculated from three degradation assays are plotted.
FIGURE 7:
FIGURE 7:
Temporal proteolysis of E2F8 across the cell cycle. (A) Degradations of 35S-labeled E2F8, Securin, and p27 (IVT products) were tested in seven cell extracts generated from synchronous S3 cells at seven points across the cell cycle (R.F.Noc: release from a thymidine-nocodazole block; R.F.DTB: release from a double thymidine block). DNA distributions are shown. Extracts were supplemented only with Ub and energy-regeneration mix. Time-dependent degradation was assayed by SDS–PAGE and autoradiography. A set of source data and quantifications is shown. (B) Average, SE, and polynomial fit (dotted line) calculated from three degradation assays of E2F8 and Securin in early-mid- and late-G1 extracts. 35S signals were normalized to t0.
FIGURE 8:
FIGURE 8:
Cyclin F mediates the degradation of E2F8 in G2-phase. (A) Schematic depiction of the RxL motifs in E2F8. (B) The abundance of E2F8 in control Cyclin F KO HeLa cells was analyzed by Western blot. (C) HEK293T cells were transiently transfected with HIS-E2F8-HA with and without FLAG-Cyclin F. Cells were analyzed by Western blot 48 h posttransfection. SE, short exposure; LE, long exposure. (D) MCF7 and T47D were engineered to express doxycycline (Dox) inducible Cyclin F. Cells were treated with doxycycline at increasing concentrations for 48 h and then endogenous E2F8 was analyzed by Western blot. (E) HEK293T cells were transiently transfected with FLAG-Cyclin F or its ΔF-box variant and analyzed by Western blot 48 h posttransfection. (F) MCF7 cells were treated with doxycycline to induce expression of Cyclin F. Eight hours prior to harvesting for Western blot, cells were treated with either of two proteasome inhibitors, MG132 and bortezomib. Endogenous E2F8 was analyzed by Western blot. (G) Control and Cyclin F KO HeLa cells were synchronized at the G1-S boundary by a double thymidine block. Following release from the second thymidine block, samples were collected for Western blot analysis at the indicated time points. (H) HEK293T cells were transfect with wild-type or mutant versions of HIS-E2F8-HA harboring alanine substitutions at the indicated RxL motifs shown in A. Their response to ectopic coexpression was analyzed by Western blot 48 h after transfection. (I, J) HIS-E2F8-HA and FLAG-Cyclin F were cotransfected into HEK293T cells. Cell lysates were subjected to co-IP with either anti-HA or anti-FLAG antibodies.
FIGURE 9:
FIGURE 9:
Multiple mechanisms coordinate the dynamics of E2F8 in cycling mammalian cells. At the transcriptional level, E2F8 is primarily regulated by E2F1 via a negative feedback mechanism. Posttranslationally, E2F8 is controlled by temporal proteolysis orchestrated by multiple pathways. E2F8 peaks in S-phase. During G2-phase, E2F8 protein is down-regulated by SCFCyclin F activity. Although low-leveled, E2F8 proteolysis during early mitosis, while APC/CCdc20 is active, is inefficient. E2F8 is phosphorylated in mitosis by Cdk1. This phosphorylation has a stabilizing effect on the protein. During mitotic exit, Cdk1 is inactivated and both E2F8 and Cdh1 are dephosphorylated. This dual molecular switch initiates both the assembly of APC/CCdh1 and its ability to ubiquitinate E2F8. The levels of E2F8 remain minimal through G1 as long as APC/CCdh1 is fully active. During late G1, APC/CCdh1 activity weakens by an autonomous mechanism. The enhanced sensitivity of E2F8 to suboptimal APC/CCdh1 activity effectively stabilizes the protein while Securin and perhaps other APC/C targets are still degraded. Because E2F1 is already present, the negative feedback circuitry between E2F1 and E2F8 can be formed already in late G1 in ensuring a safe transition into S-phase.

References

    1. Ayad NG, Rankin S, Murakami M, Jebanathirajah J, Gygi S, Kirschner MW. (2003). Tome-1, a trigger of mitotic entry, is degraded during G1 via the APC. Cell , 101–113. - PubMed
    1. Ayad NG, Rankin S, Ooi D, Rape M, Kirschner MW. (2005). Identification of ubiquitin ligase substrates by in vitro expression cloning. Methods Enzymol , 404–414. - PubMed
    1. Boekhout M, Yuan R, Wondergem AP, Segeren HA, van Liere EA, Awol N, Jansen I, Wolthuis RM, de Bruin A, Westendorp B. (2016). Feedback regulation between atypical E2Fs and APC/CCdh1 coordinates cell cycle progression. EMBO Rep , 414–427. - PMC - PubMed
    1. Budhavarapu VN, White ED, Mahanic CS, Chen L, Lin FT, Lin WC. (2012). Regulation of E2F1 by APC/C Cdh1 via K11 linkage-specific ubiquitin chain formation. Cell Cycle , 2030–2038. - PMC - PubMed
    1. Burdova K, Yang H, Faedda R, Hume S, Chauhan J, Ebner D, Kessler BM, Vendrell I, Drewry DH, Wells CI, et al (2019). E2F1 proteolysis via SCF-cyclin F underlies synthetic lethality between cyclin F loss and Chk1 inhibition. EMBO J e101443. - PMC - PubMed

Publication types

LinkOut - more resources