. 2020 Jan 29;15(1):e0228408.
doi: 10.1371/journal.pone.0228408. eCollection 2020.

GLIPR1 expression is reduced in multiple myeloma but is not a tumour suppressor in mice

Affiliations

GLIPR1 expression is reduced in multiple myeloma but is not a tumour suppressor in mice

Natasha Friend et al. PLoS One. .

Abstract

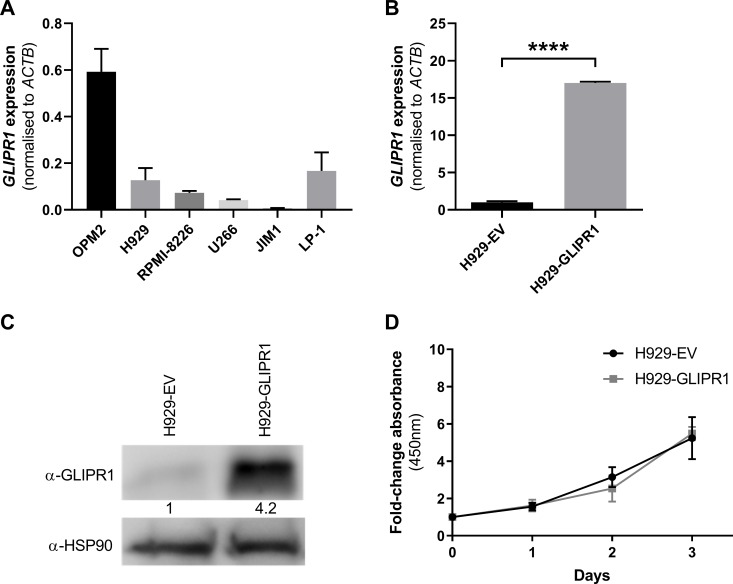
Multiple myeloma, a plasma cell malignancy, is a genetically heterogeneous disease and the genetic factors that contribute to its development and progression remain to be fully elucidated. The tumour suppressor gene GLIPR1 has previously been shown to be deleted in approximately 10% of myeloma patients, to inhibit the development of plasma cell tumours in ageing mice and to have reduced expression levels in the plasma cells of patients with light-chain amyloidosis, a myeloma-related malignancy. Therefore, we hypothesised that GLIPR1 may have tumour suppressor activity in multiple myeloma. In this study, we demonstrate that plasma cell expression of GLIPR1 is reduced in the majority of myeloma patients and Glipr1 expression is lost in the 5TGM1 murine myeloma cell line. However, overexpression of GLIPR1 in a human myeloma cell line did not affect cell proliferation in vitro. Similarly, re-expression of Glipr1 in 5TGM1 cells did not significantly reduce their in vitro proliferation or in vivo growth in C57BL/KaLwRij mice. In addition, using CRISPR-Cas9 genome editing, we generated C57BL/Glipr1-/- mice and showed that loss of Glipr1 in vivo did not affect normal haematopoiesis or the development of monoclonal plasma cell expansions in these mice up to one year of age. Taken together, our results suggest that GLIPR1 is unlikely to be a potent tumour suppressor in multiple myeloma. However, it remains possible that the down-regulation of GLIPR1 may cooperate with other genetic lesions to promote the development of myeloma.


Conflict of interest statement

The authors have declared that no competing interests exist.

Figures

Fig 1
Fig 1. GLIPR1 mRNA expression is down-regulated in PCs from MM patients.
In silico analysis was performed on publicly available datasets analysing gene expression in CD138+ PCs isolated from MGUS (n = 22) and MM (n = 69) patients and healthy controls (n = 15; E-GEOD-6477; A) and MGUS (n = 11) and MM (n = 133) patients and healthy controls (n = 5; E-GEOD-16122; B). Scatter dot plots show median and interquartile range. ****P < 0.0001, **P < 0.01; Kruskal-Wallis test with Dunn’s multiple comparisons test.
Fig 2
Fig 2. GLIPR1 overexpression does not affect HMCL proliferation in vitro.
(A) The expression levels of GLIPR1 mRNA in six HMCLs were assessed by RT-qPCR (normalised to ACTB). Graph depicts the mean + SD of triplicates. (B) RT-qPCR for GLIPR1 mRNA was performed on RNA from H929-EV cells and H929-GLIPR1 cells. GLIPR1 expression levels were normalised to ACTB and were expressed relative to H929-EV cells. Graph depicts the mean + SD of triplicates. ****P < 0.0001, unpaired t test. (C) The expression of GLIPR1 protein in H929-EV cells and H929-GLIPR1 cells was assessed by Western blot. HSP90 was used as the loading control. (D) The basal proliferation of H929-EV and H929-GLIPR1 cells was assessed over 3 days by WST-1 assay. Graph depicts the mean ± SD of n = 3 independent experiments.
Fig 3
Fig 3. Glipr1 expression is lost in 5TGM1 cells but its re-expression does not affect cell proliferation in vitro.
(A) The expression of Glipr1 mRNA was assessed by RT-PCR in CD138+ PCs from healthy WT (C57BL/6) mice and KaLwRij mice, as well as the KaLwRij-derived 5TGM1 MM PC line. The products were run on a 2% agarose gel and stained with GelRed. Actb was used as a positive control. NTC = no template control. (B) The expression of Glipr1 protein in 5TGM1-Glipr1 (Glipr1) and control 5TGM1-EV (EV) cells was assessed by Western blot. Hsp90 was used as the loading control. The number of 5TGM1-Glipr1 cells in mono-culture (C) or co-culture with OP9 bone marrow stromal cells (D) was assessed by measuring luciferase activity after 3 days. Cell number is expressed relative to the EV control cells. (E) Colony formation by 5TGM1-Glipr1 cells versus 5TGM1-EV cells was assessed in semi-solid methylcellulose-containing medium after 12 days. Colony number is expressed relative to the EV control cells. Graphs depict the mean + SD of n = 3 independent experiments.
Fig 4
Fig 4. Glipr1 overexpression in 5TGM1 cells does not affect tumour growth in vivo.
KaLwRij mice were injected intravenously with 5 x 10⁵ 5TGM1-Glipr1 or 5TGM1-EV control cells. (A) Tumour burden in the mice was measured weekly from week 2 post-tumour cell inoculation by bioluminescence imaging and the signal from the ventral and dorsal scans were summed for each mouse. A graph of the total flux for the mice injected with 5TGM1-Glipr1 or 5TGM1-EV cells (left) and representative ventral scans of one mouse per cell line over time (right) are shown. (B) Serum was collected from the mice after four weeks and the M-spikes were measured by SPEP. M-spikes (^) on the SPEP gel (left) and the quantitated M-spike intensity (right), normalised to albumin and expressed relative to the EV control, are shown. Graphs depict the mean ± SEM of n = 14–15 mice per cell line from three independent experiments.
Fig 5
Fig 5. Generating Glipr1 knockout mice (Glipr1-/-) using CRISPR-Cas9 genome editing.
(A) Schematic showing the location of the gRNAs used for CRISPR-Cas9-mediated deletion of Glipr1 exon 1 and the PCR primers (P1 & P2) used to screen founder mice for deletions. The direction of gene transcription is indicated by the arrow. (B) DNA samples from the four founder mice (F1-4) were screened for deletions of Glipr1 exon 1 by PCR using primers P1 and P2 and the products were run on a 1% agarose gel (left). Sanger sequencing of the highlighted deletion band in F3 showed a 3,641 bp deletion between the two gRNA sites, which removed Glipr1 exon 1 (right). NTC = no template control, WT = wildtype C57BL/6 mouse. (C) RT-qPCR for Glipr1 mRNA was performed on RNA from the BM and spleen of Glipr1-/- mice and WT control mice using primers in exons 3 and 4. Glipr1 expression levels were normalised to Actb and were expressed relative to WT mice. Graph depicts the mean + SD of n = 2 mice per genotype. ****P < 0.0001, unpaired t test. (D) The levels of Glipr1 protein in the BM and spleen of Glipr1-/- and WT mice was assessed by Western blot. Hsp90 was used as the loading control.
Fig 6
Fig 6. FACS analysis of B cell development in 12-week-old WT and Glipr1-/- mice.
Single cell suspensions from the BM and spleen were obtained from 12-week-old Glipr1-/- mice and WT control mice. The cells were stained with anti-B220, anti-IgM and anti-CD138 antibodies and analysed by flow cytometry. BM cells were gated, as represented in (A), to show the percentage of total B cells (B220+; B), pre-pro B cells (B220lowIgM-; C), immature B cells (B220lowIgM+; D), mature B cells (B220highIgMlow; E) and PCs (B220-IgM-CD138+; F) among total leukocytes. Spleen cells were gated, as represented in (G), to show the percentage of total B cells (H) and PCs (I) among total leukocytes. Graphs depict the mean ± SEM of n = 12 (B-F) or n = 9 (H&I) mice per genotype. *P < 0.05, Mann-Whitney U test.
Fig 7
Fig 7. Glipr1 knockout does not affect B cell or PC populations in 12-month-old mice.
BM and spleen cells were prepared from 12-month-old Glipr1-/- and WT control mice. Resultant single cell suspensions were stained with anti-B220, anti-IgM and anti-CD138 antibodies and analysed by flow cytometry. BM cells were gated to show the percentage of total B cells (B220+; A), pre-pro B cells (B220lowIgM-; B), immature B cells (B220lowIgM+; C), mature B cells (B220highIgMlow; D) and PCs (B220-IgM-CD138+; E) among total leukocytes. Spleen cells were gated to show the percentage of total B cells (F) and PCs (G) among total leukocytes. Graphs depict the mean ± SEM of n = 10 mice per genotype. (H) Serum was collected by tail bleed from 12-month-old Glipr1-/- mice and WT control mice and the presence of M-spikes was determined using SPEP (n = 10 mice per genotype). The SPEP gels are shown with the position of the albumin and globulin components of the serum indicated by brackets. * = mice with an M-spike by densitometry.

Similar articles

Cited by

References

    1. Rajkumar SV, Dimopoulos MA, Palumbo A, Blade J, Merlini G, Mateos MV, et al. International Myeloma Working Group updated criteria for the diagnosis of multiple myeloma. The Lancet Oncology. 2014;15(12):e538–48. Epub 2014/12/03. 10.1016/S1470-2045(14)70442-5 . - DOI - PubMed
    1. Kumar SK, Rajkumar V, Kyle RA, van Duin M, Sonneveld P, Mateos MV, et al. Multiple myeloma. Nat Rev Dis Primers. 2017;3:17046 Epub 2017/07/21. 10.1038/nrdp.2017.46 . - DOI - PubMed
    1. Landgren O, Kyle RA, Pfeiffer RM, Katzmann JA, Caporaso NE, Hayes RB, et al. Monoclonal gammopathy of undetermined significance (MGUS) consistently precedes multiple myeloma: a prospective study. Blood. 2009;113(22):5412–7. Epub 2009/01/31. 10.1182/blood-2008-12-194241 - DOI - PMC - PubMed
    1. Weiss BM, Abadie J, Verma P, Howard RS, Kuehl WM. A monoclonal gammopathy precedes multiple myeloma in most patients. Blood. 2009;113(22):5418–22. Epub 2009/02/24. 10.1182/blood-2008-12-195008 - DOI - PMC - PubMed
    1. Kyle RA, Therneau TM, Rajkumar SV, Offord JR, Larson DR, Plevak MF, et al. A long-term study of prognosis in monoclonal gammopathy of undetermined significance. The New England journal of medicine. 2002;346(8):564–9. Epub 2002/02/22. 10.1056/NEJMoa01133202 . - DOI - PubMed

Publication types