. 2020 Apr;80(5):412-423.
doi: 10.1002/pros.23956. Epub 2020 Jan 29.

Differential roles and activation of mammalian target of rapamycin complexes 1 and 2 during cell migration in prostate cancer cells

Affiliations

Differential roles and activation of mammalian target of rapamycin complexes 1 and 2 during cell migration in prostate cancer cells

Smrruthi Vaidegi Venugopal et al. Prostate. 2020 Apr.

Abstract

Background: Mammalian target of rapamycin (mTOR) is a downstream substrate activated by PI3K/AKT pathway and it is essential for cell migration. It exists as two complexes: mTORC1 and mTORC2. mTORC1 is known to be regulated by active AKT, but the activation of mTORC2 is poorly understood. In this study, we investigated the roles and differential activation of the two mTOR complexes during cell migration in prostate cancer cells.

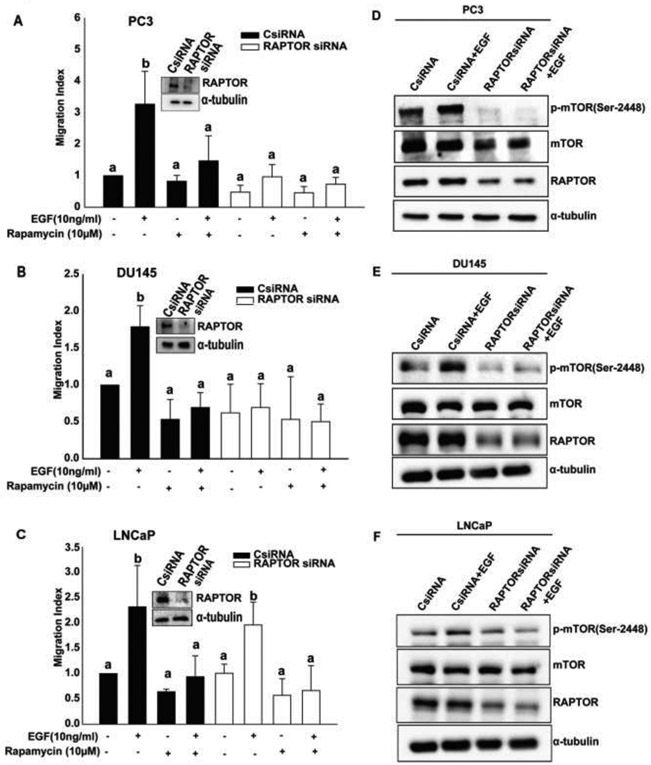
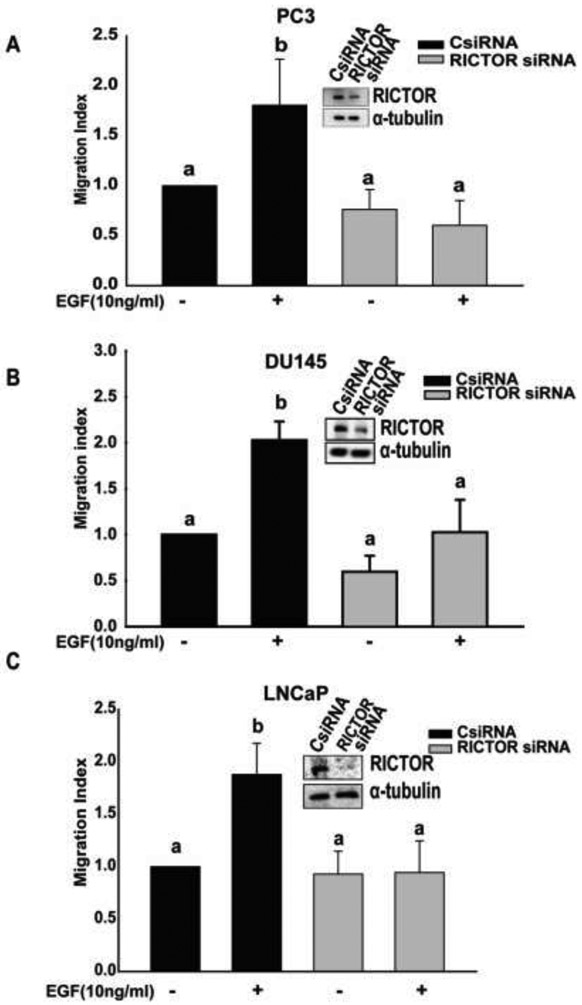
Methods: We used small interfering RNA to silence the expression of Rac1 and the main components of mTOR complexes (regulatory associated protein of mTOR [RAPTOR] and rapamycin-insensitive companion of mTOR [RICTOR]) in LNCaP, DU145, and PC3 prostate cancer cell lines. We performed transwell migration assay to evaluate the migratory capability of the cells, and Western blot analysis to study the activation levels of mTOR complexes.

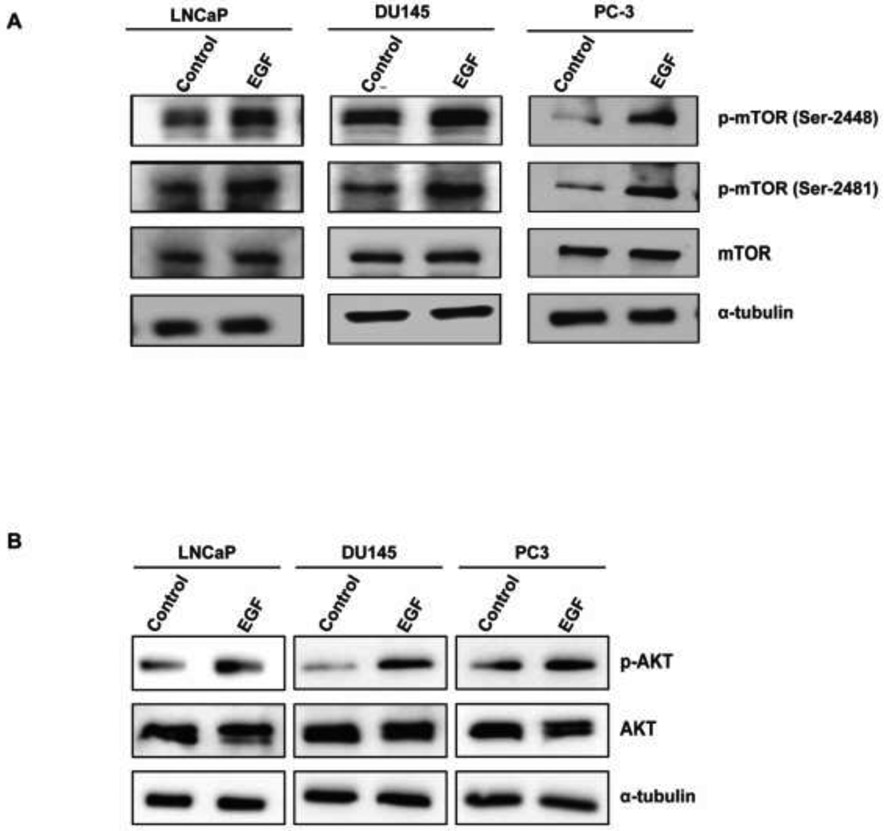
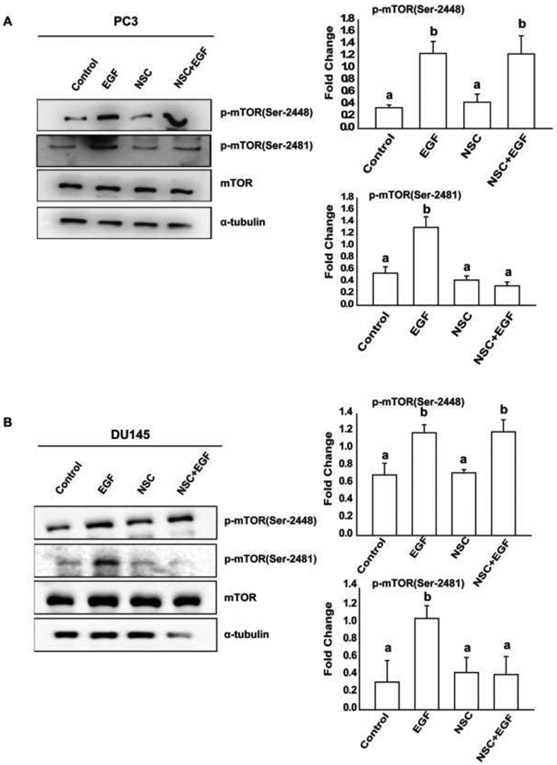
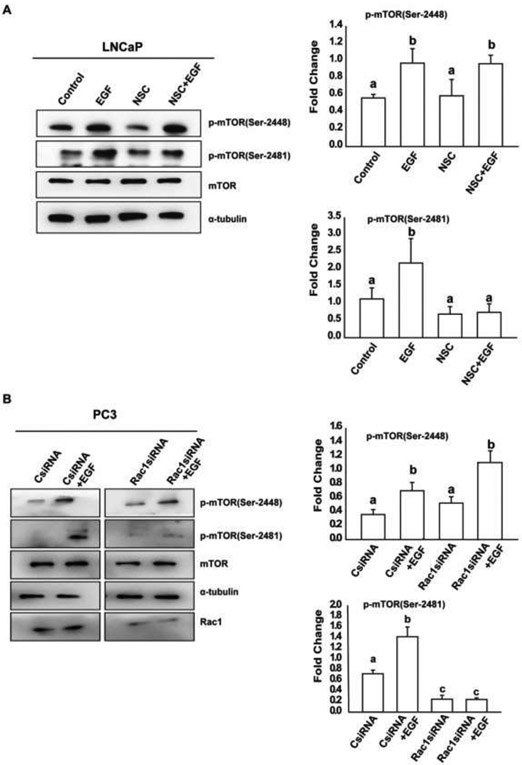
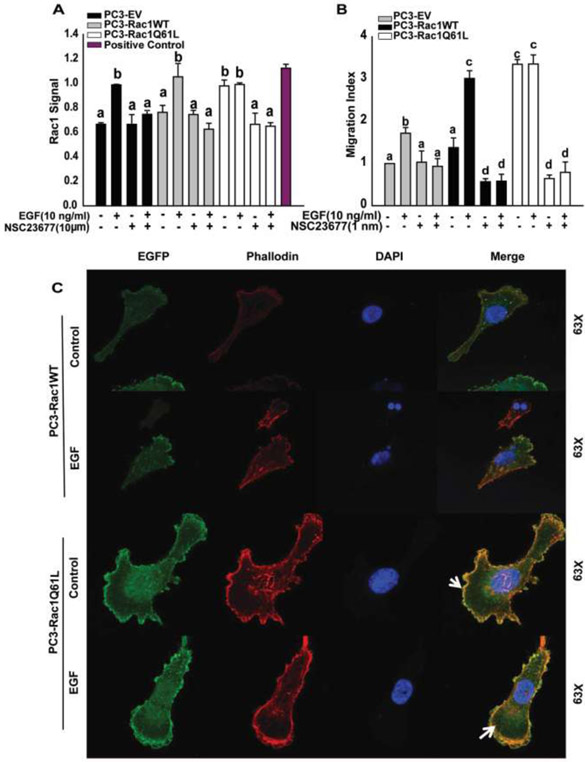
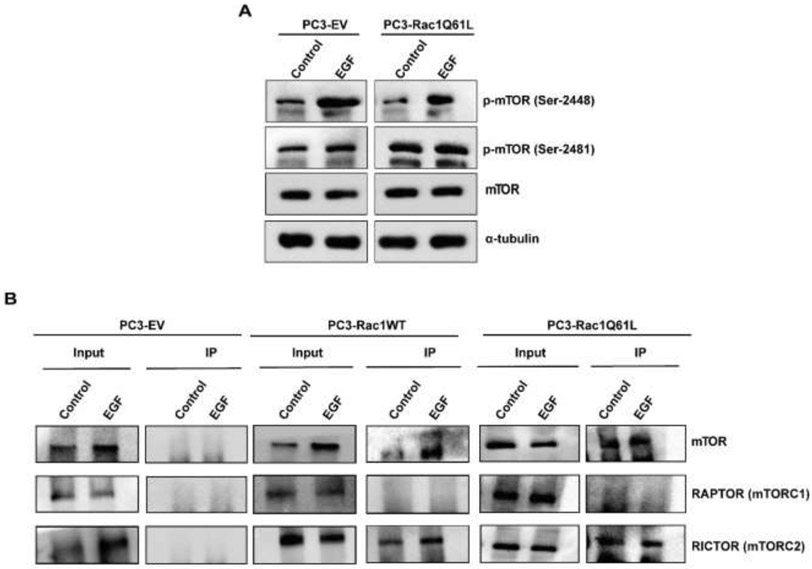
Results: Specific knockdown of RAPTOR and RICTOR caused a decrease of cell migration, suggesting their essential role in prostate cancer cell movement. Furthermore, epidermal growth factor (EGF) treatments induced the activation of both the mTOR complexes. Lack of Rac1 activity in prostate cancer cells blocked EGF-induced activation of mTORC2, but had no effect on mTORC1 activation. Furthermore, the overexpression of constitutively active Rac1 resulted in significant increase in cell migration and activation of mTORC2 in PC3 cells, but had no effect on mTORC1 activation. Active Rac1 was localized in the plasma membrane and was found to be in a protein complex, with RICTOR, but not RAPTOR.

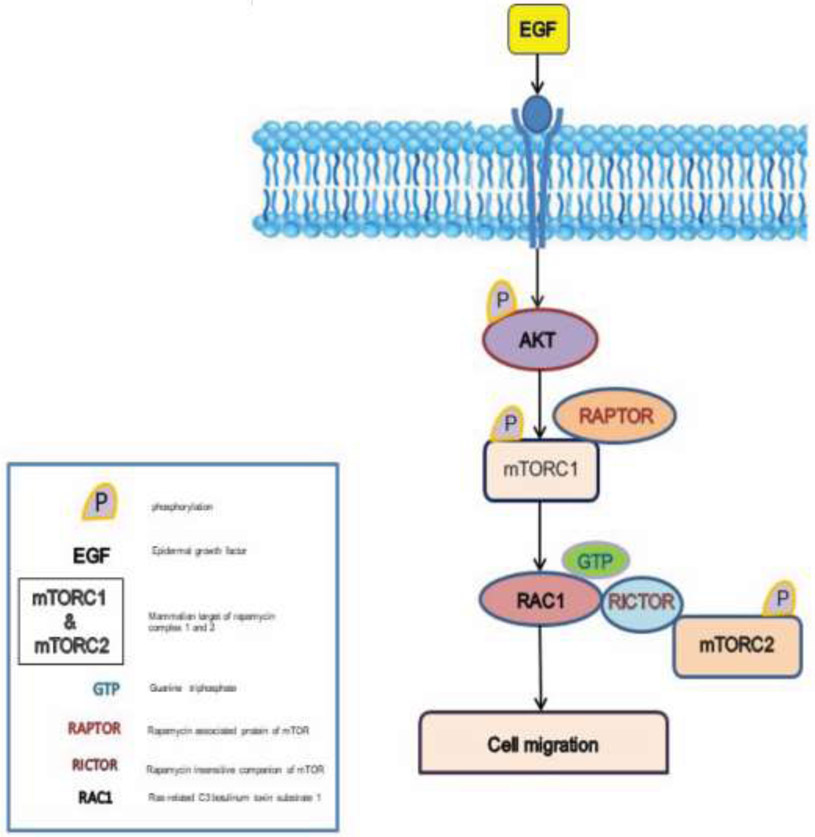
Conclusion: We suggest that EGF-induced activation of Rac1 causes the activation of mTORC2 via RICTOR. This mechanism plays a critical role in prostate cancer cell migration.

Keywords: PI3K/AKT/mTOR; Rac1; cell migration; mTORC1; mTORC2; prostate cancer.


Conflict of interest statement

Conflict of interest: The authors declare no conflict of interest.

Figures

Figure 1:
Figure 1:. mTORC1 is essential for cell migration and is required for the activation of mTORC1 in PC3, and DU145 cells and not in LNCaP cells:
A, B, and C) Migration assays were performed for 5 hr (PC3, DU145) and 24 hr (LNCaP). One-way Anova was performed with p-value< 0.01 for at least 3 experiments. a and b represent statistical significance, compared to the controls. D, E, and F) PC3, DU145, and LNCaP cells were transfected with control and RAPTOR siRNAs and treated with EGF (10 ng/ml, 3 min). Western blot analysis for p-mTOR (Ser-2448), mTOR, RAPTOR, and α-tubulin antibodies were performed.
Figure 2:
Figure 2:. mTORC2 is essential for cell migration in PC3, DU145, and LNCaP cells:
A, B, and C) Migration assays were performed for 5 hr (PC3, DU145) and 24 hr (LNCaP) One-way Anova was performed with p-value< 0.01 for at least 3 experiments. a and b represents statistical significance, compared to the controls.
Figure 3:
Figure 3:. EGF induces the activation of p-AKT, mTORC1,and mTORC2 in PC3, DU145, and LNCaP cells:
A,B) PC3, DU145, and LNCaP cells were treated with EGF (10 ng/ml, 3 min) and western blot analysis was performed using p-mTOR (Ser-2448), p-mTOR (Ser-2481), mTOR, p-AKT, AKT, and α-tubulin antibodies.
Figure 4:
Figure 4:. Rac1 is required for the activation of mTORC2 in PC3 and DU145 cells:
A, B) PC3 and DU145 cells respectively, were treated with Rac1 inhibitor and EGF, followed by western blot analysis using p-mTOR (Ser-2448), p-mTOR (Ser-2481), mTOR, and α-tubulin antibodies. One-Way Anova was performed with p-value<0.01 for at least 3 experiments. a and b represent statistical significance, compared to the controls.
Figure 5:
Figure 5:. Activation of mTORC2 is affected in Rac1 depleted LNCaP and PC3 cells:
A) LNCaP cells were treated with Rac1 inhibitor EGF, followed by western blot analysis using p-mTOR (Ser-2448), p-mTOR (Ser-2481), mTOR, and α-tubulin antibodies. One-Way Anova was performed with p-value<0.01 for at least 3 experiments. B) PC3 cells were treated with Rac1siRNA and EGF, followed by western blot analysis using p-mTOR (Ser-2448), p-mTOR (Ser-2481), mTOR, Rac1, and α-tubulin antibodies. One-Way Anova was performed with p-value < 0.01 for at least 3 experiments. a and b represent statistical significance, compared to the controls.
Figure 6:
Figure 6:. Wild type Rac1 (PC3-Rac1WT) and constitutively active Rac1 (PC3-Rac1Q61L) cells affected activation of Rac1, cell migration, and localization of Rac1:
A) G-LISA assays were performed on empty vector (PC3-EV), wild type Rac1 (PC3-Rac1WT), and constitutively active Rac1 (PC3-Rac1Q61L) cells, after treating the cells with NSC23677 and EGF. Graph was plotted using Mean ± SEM from 2 replicates. a and b represent statistical significance, compared to the controls. B) Migration assays were performed for 5 hours on cells treated with NSC23677 and EGF. One-way Anova was performed with p-value< 0.01 for at least 3 experiments. a, b, c and d represent statistical significance, compared to the controls. C) PC3-Rac1WT and PC3-Rac1Q61L cells were treated with EGF and fluorescence analysis was performed using Rhodamine-Phallodin and DAPI for actin and nuclei, respectively.
Figure 7:
Figure 7:. Rac1 forms a complex with mTORC2 through RICTOR in wild type Rac1 (PC3-Rac1WT and constitutively active Rac1 (PC3-Rac1Q61L) cells:
A) PC3-EV and PC3-Rac1Q61L cells were treated with EGF, followed by western blot analysis using p-mTOR (Ser-2448), p-mTOR (Ser-2481), mTOR, and α-tubulin antibodies. B) PC3-EV, PC3-Rac1WT, and PC3-Rac1Q61L cells were immunoprecipitated with His-tag antibody. Western blot analysis was performed using mTOR, RAPTOR, and RICTOR antibodies. All experiments were performed 3 times.
Figure 8:
Figure 8:. Working model of mTORC2 activation by active RAC1 using PI3K/AKT signaling Pathway:
Signaling by EGF causes the activation of mTORC1 by phosphorylation of mTOR at Ser-2448. Activation of mTORC1 leads to the activation of Rac1, and due to its proximity to RICTOR component of mTORC2, induces activation of mTORC2 by phosphorylating its mTOR at Ser-2481, thereby leads to prostate cancer cell migration.

Similar articles

Cited by

References

    1. Brooks SA, Lomax-Browne HJ, Carter TM, Kinch CE, Hall DM. Molecular interactions in cancer cell metastasis. Acta histochemica. 2010;112(1):3–25. - PubMed
    1. Pollard TD, Borisy GG. Cellular motility driven by assembly and disassembly of actin filaments. Cell. 2003;112(4):453–465. - PubMed
    1. Wertheimer E, Gutierrez-Uzquiza A, Rosemblit C, Lopez-Haber C, Sosa MS, Kazanietz MG. Rac signaling in breast cancer: a tale of GEFs and GAPs. Cellular signalling. 2012;24(2):353–362. - PMC - PubMed
    1. Vo BT, Morton D Jr., Komaragiri S, Millena AC, Leath C, Khan SA. TGF-beta effects on prostate cancer cell migration and invasion are mediated by PGE2 through activation of PI3K/AKT/mTOR pathway. Endocrinology. 2013;154(5):1768–1779. - PMC - PubMed
    1. Paplomata E, O'Regan R. The PI3K/AKT/mTOR pathway in breast cancer: targets, trials and biomarkers. Therapeutic advances in medical oncology. 2014;6(4):154–166. - PMC - PubMed

Publication types

MeSH terms