. 2020 Jan 28;30(4):1077-1087.e3.
doi: 10.1016/j.celrep.2019.12.068. Epub 2020 Jan 28.

Protein Turnover in Epithelial Cells and Mucus along the Gastrointestinal Tract Is Coordinated by the Spatial Location and Microbiota

Affiliations

Protein Turnover in Epithelial Cells and Mucus along the Gastrointestinal Tract Is Coordinated by the Spatial Location and Microbiota

Liisa Arike et al. Cell Rep. .

Abstract

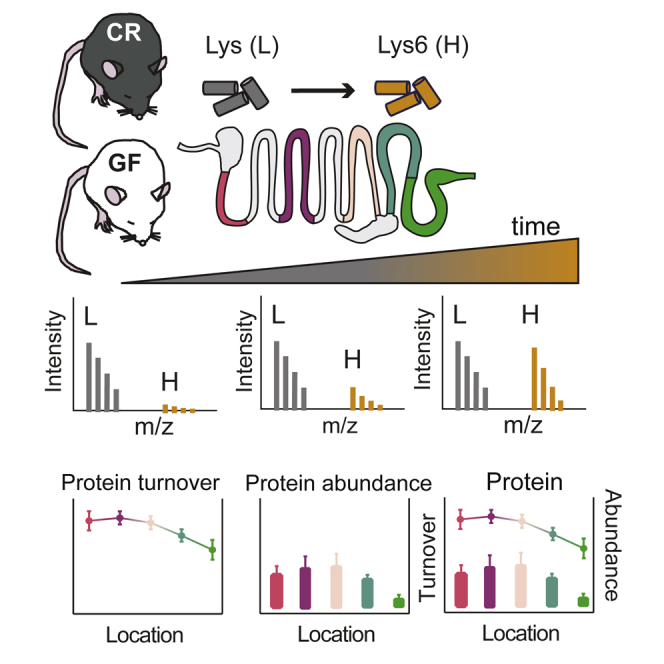
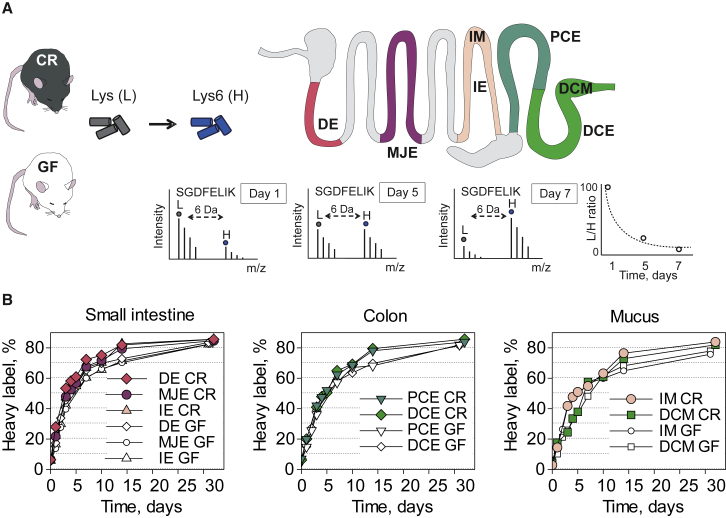
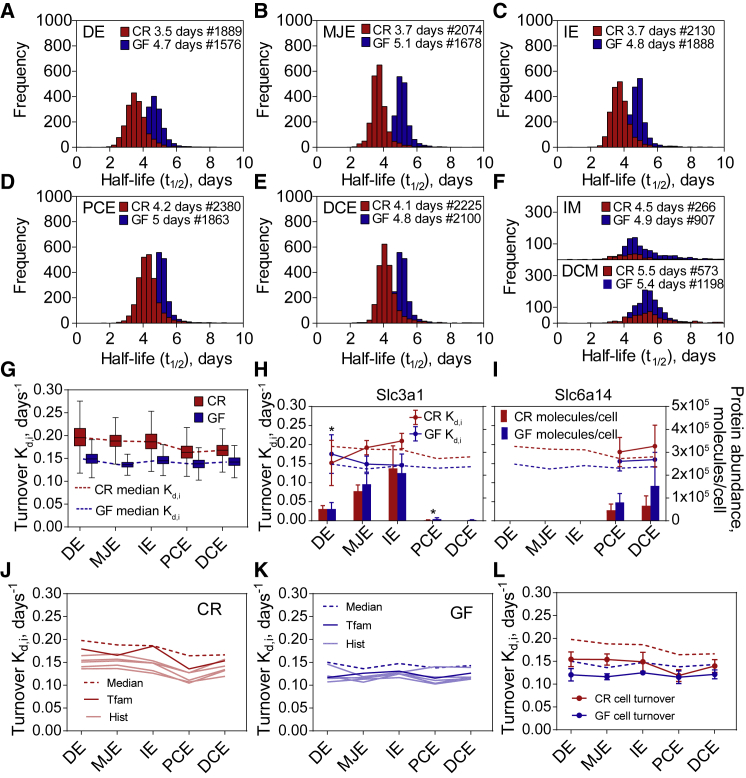
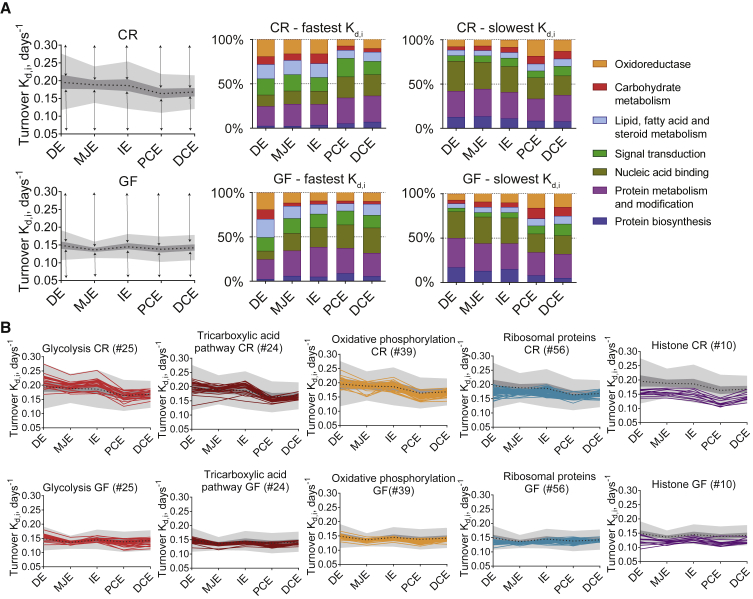
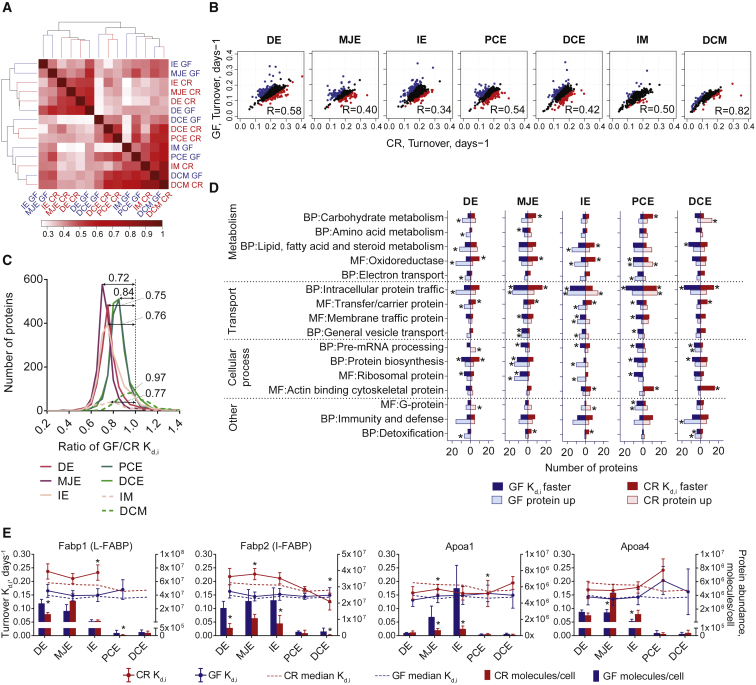
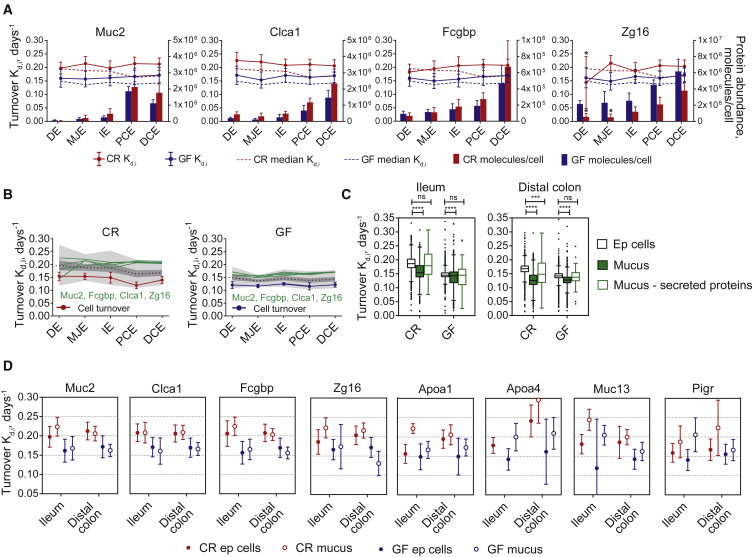
The gastrointestinal tract is covered by a single layer of epithelial cells that, together with the mucus layers, protect the underlying tissue from microbial invasion. The epithelium has one of the highest turnover rates in the body. Using stable isotope labeling, high-resolution mass spectrometry, and computational analysis, we report a comprehensive dataset of the turnover of more than 3,000 and the expression of more than 5,000 intestinal epithelial cell proteins, analyzed under conventional and germ-free conditions across five different segments in mouse intestine. The median protein half-life is shorter in the small intestine than in the colon. Differences in protein turnover rates along the intestinal tract can be explained by distinct physiological and immune-related functions between the small and large intestine. An absence of microbiota results in an approximately 1 day longer protein half-life in germ-free animals.

Keywords: bacteria; colon; colonization; commensals; germ-free; mass spectrometry; protein turnover; proteomics; small intestine.


Conflict of interest statement

Declaration of Interests The authors declare no competing interests.

Figures

None
Graphical abstract
Figure 1
Figure 1
Experimental Setup for Protein Turnover Rate Studies in Mice Intestinal Epithelial Cells and Mucus (A) Conventionally raised (CR) and germ-free (GF) mice were kept for 1 week on an amino-acid-defined diet (Lys [L]). Thereafter, the food was replaced by the same diet where lysine was substituted with 13C-lysine (Lys6 [H]). Animals were sacrificed at time points 0, 1, 2, 3, 4, 5, 7, 10, 14, and 32 days after the start of the heavy-labeled diet. Small intestine was divided into five parts and colon into two; caecum was excluded. For the proteomics analysis we used first (duodenum [DE]), third (middle jejunum [MJE]), and fifth (ileum [IE]) part of small intestine and both proximal (PCE) and distal colon (DCE) epithelial cells. Mucus was collected from the ileum and distal colon (IM and DCM, respectively). Mass-spectrometry-based proteomic analyses were used to follow the 13C-lysine incorporation into the freshly synthesized proteins, as indicated by the tryptic peptide SGDFELIK from the Muc2 mucin. (B) Heavy label incorporation into proteins in epithelial cells and mucus. Data points represent the average value of heavy label in at each time point for the different segments and mucus. See also Figures S1 and S2.
Figure 2
Figure 2
Protein Turnover Rates in CR and GF Mice (A–F) Histograms of protein half-lives along the gastrointestinal tract divided into 50 bins. The median half-life and the number of protein half-lives for each of the locations are stated on top of the corresponding histogram. DE, duodenum epithelial cells; MJE, middle jejunum epithelial cells; IE, ileum epithelial cells; PCE, proximal colon epithelial cells; DCE, distal colon epithelial cells; IM, ileum mucus; DCM, distal colon mucus as explained in Figure 1A. See also Figure S3. (G) Boxplots represent the distribution of turnover rates for all of the proteins, 25th and 75th percentiles, and the whiskers indicate the values within 1.5 times the interquartile range [IQR]. The dotted line represents the median of protein turnover rates. (H and I) Protein abundances and turnover rates for lysine transporters Slc3a1 and Slc6a14. Dots connected with solid line represent the specific protein turnover rate; error bars represent coefficient of variance (CV). Dotted lines represent median protein turnover rate of all proteins. Bars represent median protein abundance with standard deviation (SD). Asterisk above turnover rate dots represents protein turnover rate difference GF versus CR, with p < 0.1 based on Perseus (version 1.5.0.0) Significance A test. Asterisk above bars represents protein abundance difference GF versus CR, with p < 0.05 based on Significance A test. (J and K) Median protein turnover rate (dotted line) and turnover rates of proteins used for cell turnover estimation in CR (J) and GF mice (K). Tfam - Turnover rate of Tfam. Hist - turnover rates of histones (Hist1h1b, Hist1h1c, Hist1h1d, Hist2h2aa1, and Hist1h4a). (L) Median protein turnover rates and estimated cell turnover rate for CR and GF mice.
Figure 3
Figure 3
Functional Characterization and Dynamics of Protein Turnover Rate along the Intestine (A) Enrichment analysis for proteins with fastest and slowest turnover rate in CR and GF mice. Black dotted line represents median of turnover rates, 50% of the protein turnover rates fall into dark gray area, and light gray area represents 1.5 times the IQR. The arrows show the area for top 25% of proteins with the fastest or slowest turnover rate, and the bar graphs show distribution of Panther GO “biological process” and “molecular function” terms associated with the proteins with the fastest and slowest turnover rate for each location. See also Figure S4. (B) Proteins with turnover rate calculated in all epithelial cell locations and belonging into energy conversion pathways or protein complexes. See also Figure S5.
Figure 4
Figure 4
Comparison of Protein Turnover Rate between GF and CR Mice (A) Heatmap representing the similarity in global protein turnover rates clustered based on Pearson correlation. (B) Correlation of GF versus CR protein turnover rates between each sample analyzed. Blue and red dots represent the most significantly changed protein turnover rates (p < 0.1) in GF or CR mice, respectively. R, Pearson correlation. (C) Distribution of protein turnover rate ratios (GF/CR) before normalizing to 1. Median values are indicated above curves. (D) Most significantly changed protein turnover rates and abundances at each intestinal location annotated into Panther biological process (BP) and molecular function (MF) terms. The proteins with significantly faster turnover rate (p < 0.1) are given for GF in dark blue and CR in dark red. The proteins with higher abundance (p < 0.05) in GF or CR mice are presented in the light blue or light red boxes, respectively. Asterisk shows significantly enriched terms (p < 0.05). Extended data can be found in Table S2. (E) Proteins involved in lipid transport. Fabp1, liver-type fatty acid binding protein; Fabp2, intestinal fatty acid binding protein; Apoa1, Apolipoprotein A-I; Apoa4, Apolipoprotein A-IV. Bars represent protein abundance calculated based on MS peak intensity with SD; dots with connecting lines represent specific protein turnover rate and error bars coefficient of variance; dotted lines represent median protein turnover rate of all proteins; asterisk above dots represents protein turnover rate difference of GF versus CR, with p < 0.1 based on Significance A test; asterisk above bars represents protein abundance difference of GF versus CR, with p < 0.05 based on Significance A test. GF, blue; CR, red.
Figure 5
Figure 5
Turnover Rate and Protein Abundance for Mucus Components (A) Turnover and abundance of Muc2, Clca1, Fcgbp, and Zg16. Bars represent protein abundance calculated based on MS peak intensity with SD; dots with connecting lines represent specific protein turnover rate and error bars coefficient of variance; dotted lines represent median protein turnover rate of all proteins; asterisk above dot represents protein turnover rate difference GF versus CR, with p < 0.1 based on Significance A test. GF, blue; CR, red. (B) Turnover rate of mucus main components and estimated cell turnover (median of Tfam, Hist1h1b, Hist1h1c, Hist1h1d, Hist2h2aa1, and Hist1h4a) on the background of all of the turnover rates. (C) Turnover of all proteins: black empty boxes represent all proteins in epithelial cells; green filled boxes represent all of mucus proteins; and empty green boxes represent all secreted proteins in mucus (mucus proteins with a signal sequence). Boxes represent the medians and 25th and 75th percentiles, and the whiskers indicate the values within 1.5 times the IQR. Median protein turnover rate for mucus and for secreted proteins in mucus has been compared to epithelial cells; ns, non-significant. ∗∗∗p ≤ 0.0002; ∗∗∗∗p ≤ 0.0001 as determined with one-way ANOVA followed by Dunnett’s multiple comparison test. (D) Protein turnover of mucus components in ileum and distal colon for epithelial cells (filled dots) and mucus (empty dots) in GF (blue) and CR (red) mice.

References

    1. Abrams G.D., Bauer H., Sprinz H. Influence of the normal flora on mucosal morphology and cellular renewal in the ileum. A comparison of germ-free and conventional mice. Lab. Invest. 1963;12:355–364. - PubMed
    1. Alam M., Midtvedt T., Uribe A. Differential cell kinetics in the ileum and colon of germfree rats. Scand. J. Gastroenterol. 1994;29:445–451. - PubMed
    1. Anderson C.M.H., Ganapathy V., Thwaites D.T. Human solute carrier SLC6A14 is the beta-alanine carrier. J. Physiol. 2008;586:4061–4067. - PMC - PubMed
    1. Bäckhed F., Ding H., Wang T., Hooper L.V., Koh G.Y., Nagy A., Semenkovich C.F., Gordon J.I. The gut microbiota as an environmental factor that regulates fat storage. Proc. Natl. Acad. Sci. USA. 2004;101:15718–15723. - PMC - PubMed
    1. Bäckhed F., Manchester J.K., Semenkovich C.F., Gordon J.I. Mechanisms underlying the resistance to diet-induced obesity in germ-free mice. Proc. Natl. Acad. Sci. USA. 2007;104:979–984. - PMC - PubMed

Publication types

LinkOut - more resources