. 2020 Jan 28;30(4):1235-1245.e4.
doi: 10.1016/j.celrep.2019.12.067.

The ARK Assay Is a Sensitive and Versatile Method for the Global Detection of DNA-Protein Crosslinks

Affiliations

The ARK Assay Is a Sensitive and Versatile Method for the Global Detection of DNA-Protein Crosslinks

Qianghua Hu et al. Cell Rep. .

Abstract

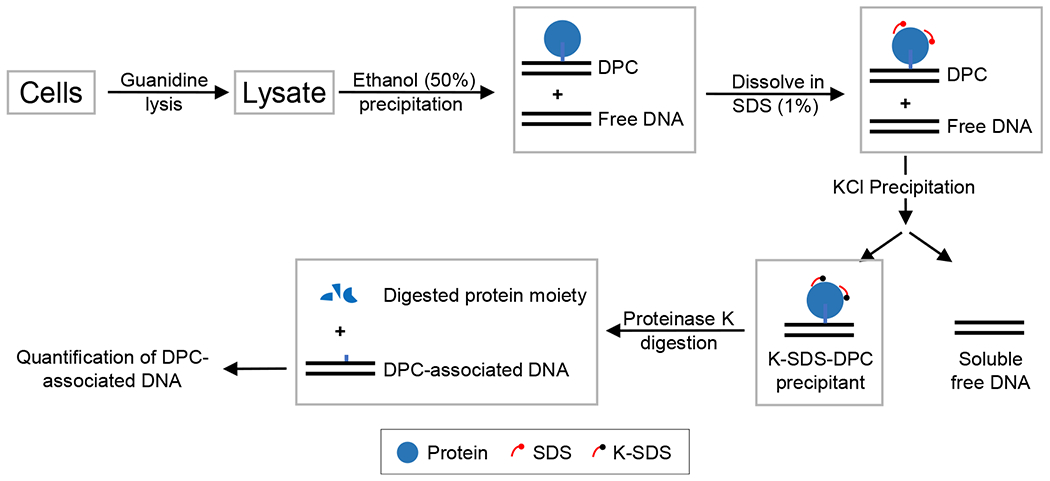
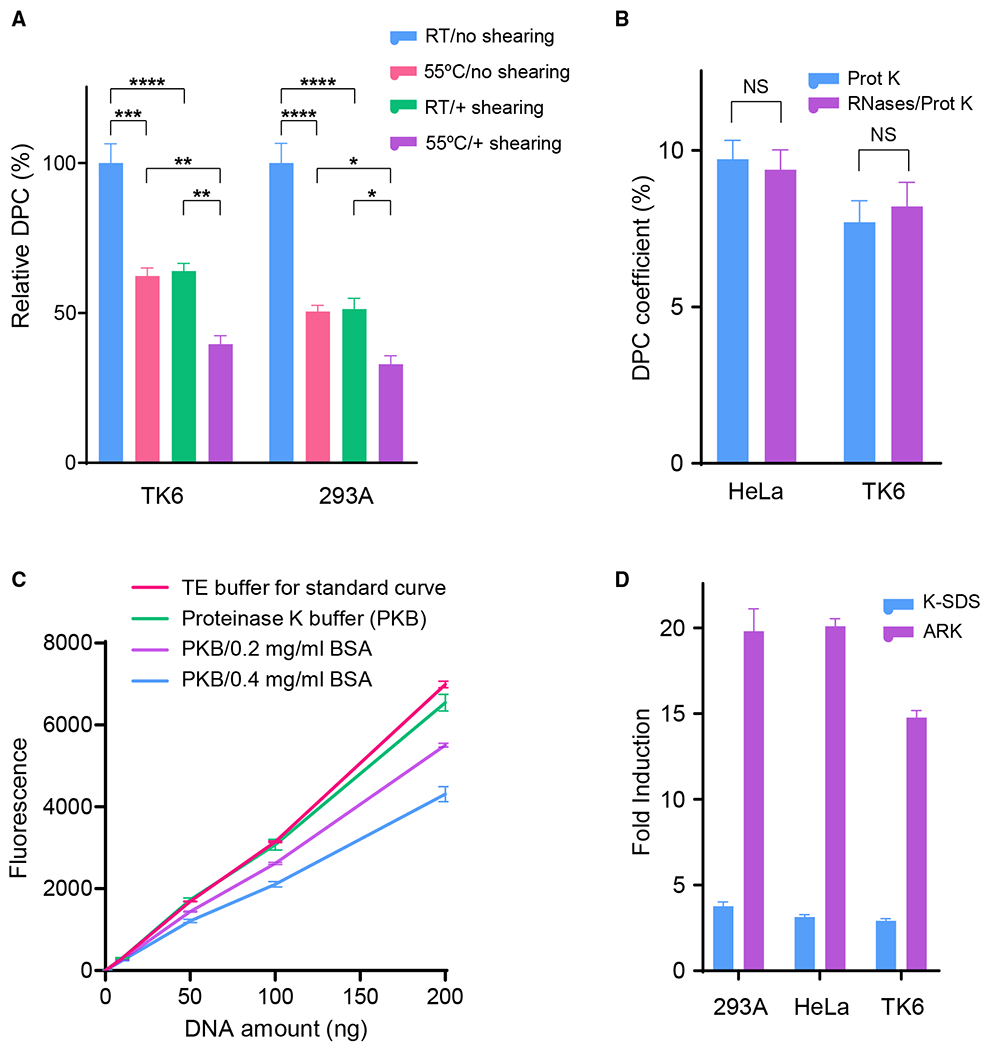
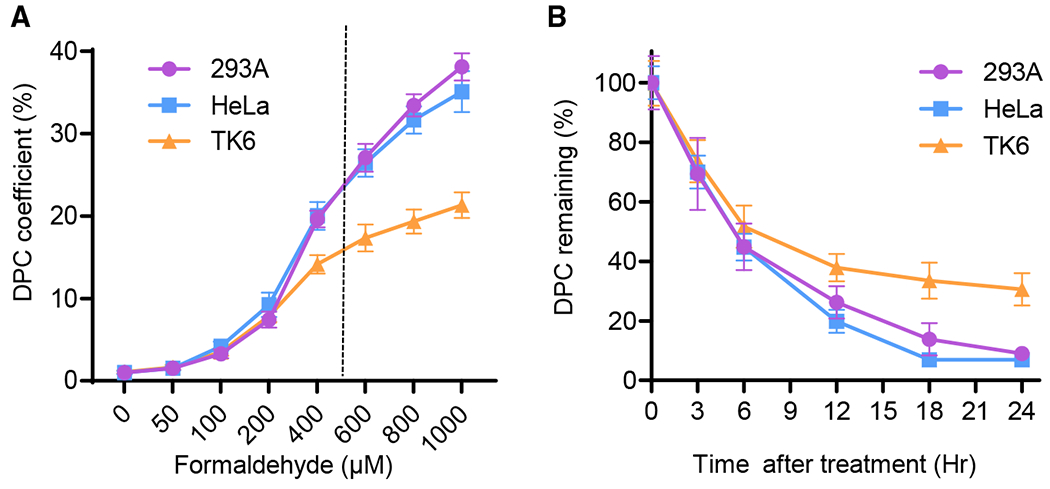
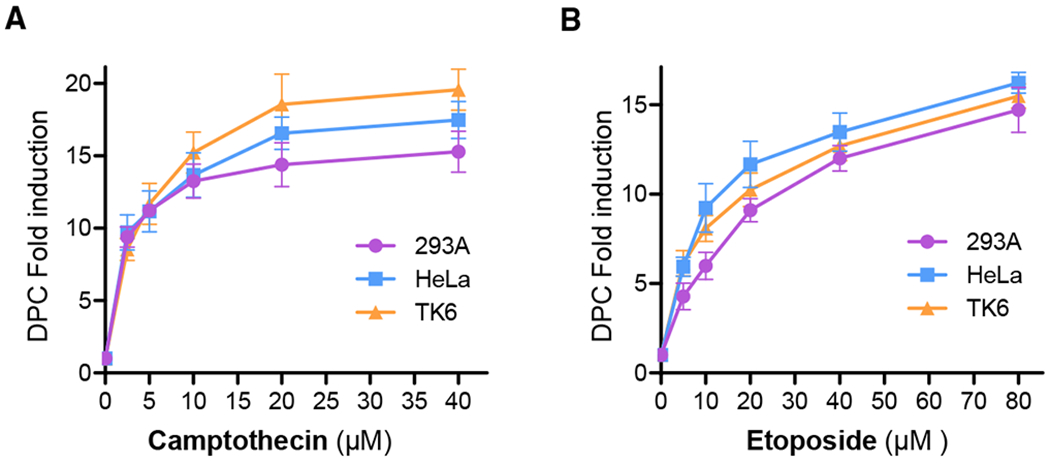
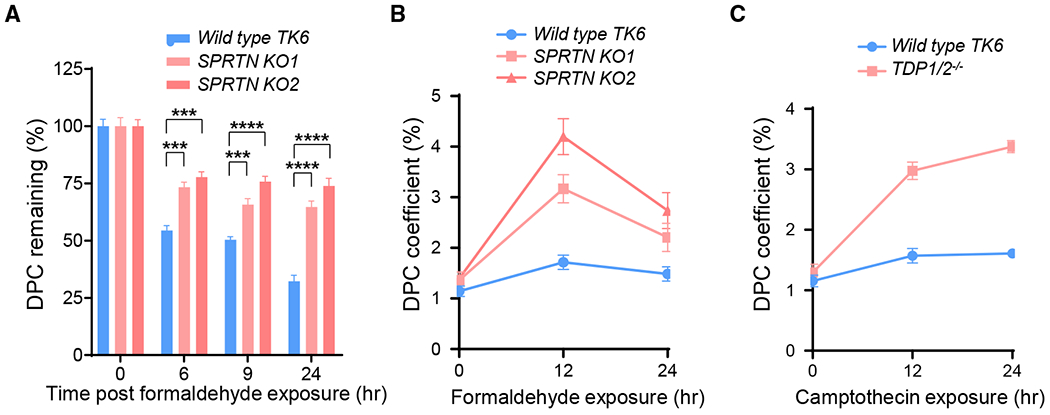
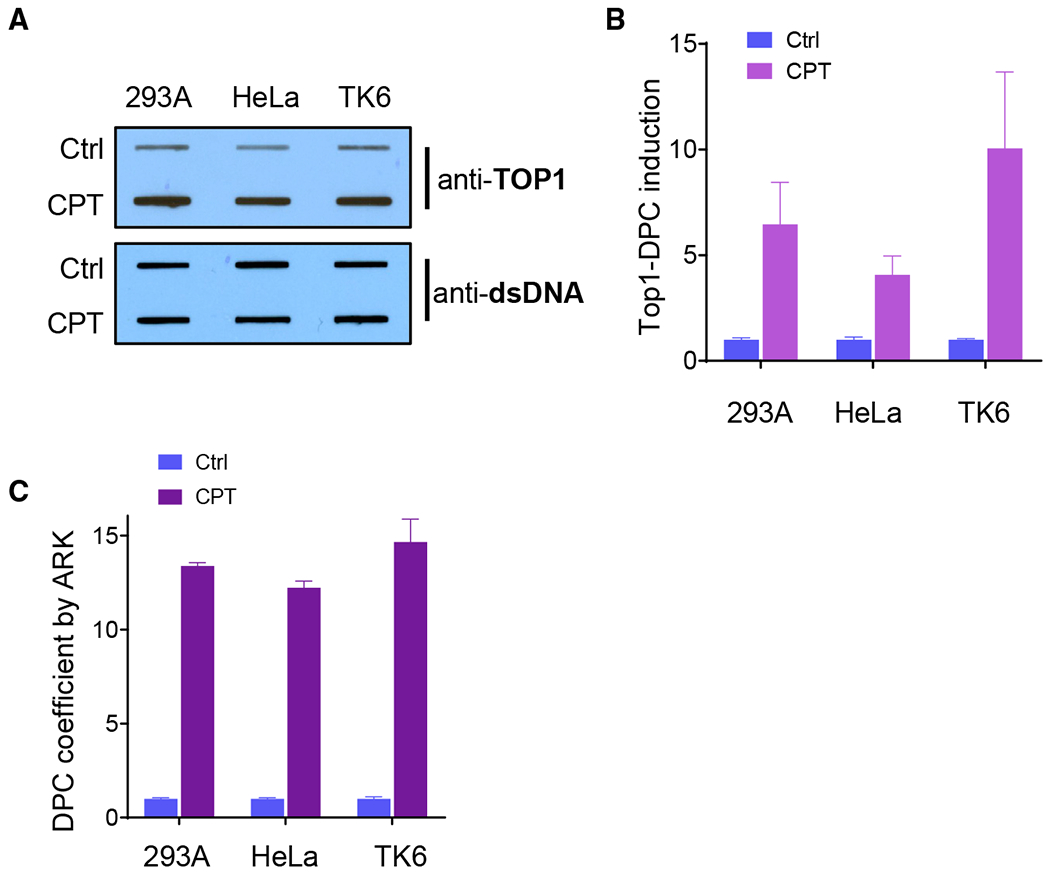
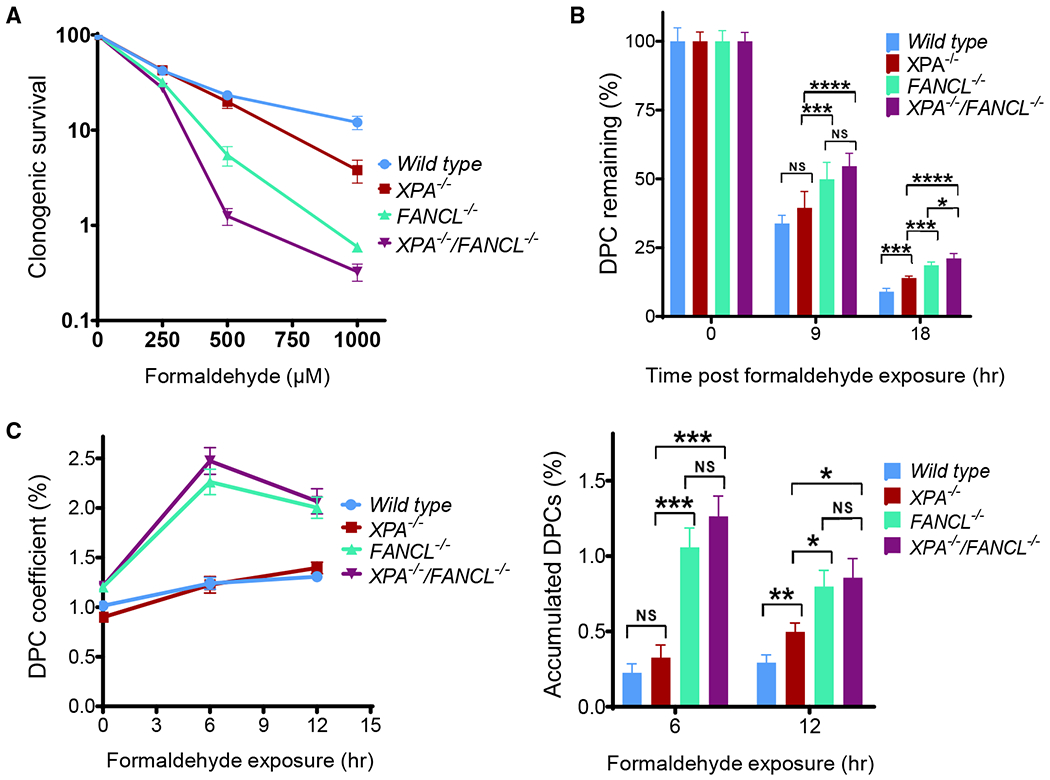
DNA-protein crosslinks (DPCs) are a frequent form of DNA lesion and are strongly inhibitive in diverse DNA transactions. Despite recent developments, the biochemical detection of DPCs remains a limiting factor for the in-depth mechanistic understanding of DPC repair. Here, we develop a sensitive and versatile assay, designated ARK, for the quantitative analysis of DPCs in cells. ARK uses sequential chaotropic and detergent-based isolation of DPCs and substantially enhances sample purity, resulting in a 5-fold increase in detection sensitivity and a 10-fold reduction in background reading. We validate the ARK assay with genetic mutants with established deficiencies in DPC repair and demonstrate its robustness by using common DPC-inducing reagents, including formaldehyde, camptothecin, and etoposide. In addition, we show that the Fanconi anemia pathway contributes to the repair of DPCs. Thus, ARK is expected to facilitate various studies aimed at understanding both fundamental biology and translational applications of DNA-protein crosslink repair.

Keywords: DNA damage response; DNA-protein crosslinks; DPC repair; K-SDS; RADAR; camptothecin; etoposide; formaldehyde.


Conflict of interest statement

Declaration of Interests The authors declare no competing interests.

Figures

Figure 1.
Figure 1.. Schematic Illustration of the ARK Assay
Cells are lysed with 5.6 M GTC to disrupt the noncovalent association between DNA and proteins. Free DNA and DPC-associated DNA are recovered by ethanol precipitation. The DNA-DPC pellet is dissolved in SDS buffer to further eliminate noncovalent DNA-protein interactions and to denature the proteins. The subsequent addition of KCl results in the precipitation of SDS-bound proteins along with DPC-associated DNA, while free DNA remains soluble. The DPCs that are recovered are digested with proteinase K to remove the protein adducts, resulting in the release of DPC-associated DNA for the quantification and calculation of the DPC coefficient.
Figure 2.
Figure 2.. ARK Assay Optimization Yielded Significantly Reduced Background and Increased Sensitivity
(A) Reduction of DPC coefficient background by pre-warming lysis buffer to 55°C (versus room temperature [RT]) and by syringe shearing after DPC precipitate is dissolved in 1% SDS buffer. The background DPC levels before these optimizations were set to 100% for comparison purposes. (B) Impact of RNA removal on DPC fold induction reading from HeLa and TK6 cells exposed to 200 μM FA (2 h). DNA samples recovered after proteinase K digestion were treated and mock-treated with RNase A-T1 mix and subsequently measured by PicoGreen quantification. (C) Effect of BSA in PicoGreen DNA measurement. Recovered DNA samples after proteinase K digestion were subjected to PicoGreen quantification in the presence or absence of the indicated amount of BSA. (D) Parallel comparison of assay readout between the K-SDS and ARK methods. Cells were treated with 400 μM FA for 2 h. DPC levels are represented by fold induction compared to mock-treated cells. Number of biological repeats: n = 6 for (A), n = 3 for (B)–(D). The error bars depict standard deviations.
Figure 3.
Figure 3.. Detection of Nonenzymatic DPCs by the ARK Assay
(A) Dose response of 293A, HeLa, and TK6 cells exposed to the indicated concentrations of FA for 2 h. DPC fold inductions were calculated by normalizing DPC-associated DNA to that of mock treatment. (B) DPC repair time course in 293A, HeLa, and TK6 cells exposed to 400 μM FA treatment for 2 h. DPC coefficient of each cell line after treatment is set as 100%. n = 4 for (A) and n = 6 for (B). The error bars depict standard deviations.
Figure 4.
Figure 4.. Detection of Enzymatic DPCs Induced by Topoisomerase Inhibitors with the ARK Assay
(A) 293A, HeLa, and TK6 cells were exposed to various doses of CPT for 1 h and analyzed by the ARK assay to generate DPC fold induction by normalizing the DPC coefficient of each sample against that of the mock-treated control. (B) HeLa, 293A, and TK6 cells were exposed to various doses of etoposide for 1 h and analyzed by the ARK assay to generate the DPC fold induction by normalizing the DPC coefficient of each sample against that of the mock-treated control. Each data point was generated from no less than 5 biological repeats with triplication. The error bars depict standard deviations.
Figure 5.
Figure 5.. Analysis of DPC Repair Deficiency in SPRTN and TDP1/TDP2 Knockout Mutants with the ARK Assay
(A) Removal of DPCs in wild-type TK6 cells and 2 SPRTN knockout derivatives (KO1 and KO2). Cells were exposed to 400 μM FA for 2 h. DPC coefficients were determined for each cell line at the indicated time points and normalized against the 0 time point to arrive at the percentages of DPCs remaining. (B) DPC accumulation in wild-type TK6 cells and 2 SPRTN knockout derivatives continuously exposed to low-dose FA (50 μM) for 12 and 24 h. (C) DPC accumulation in wild-type TK6 cells and a TDP1/2−/− double-knockout derivative continuously exposed to CPT (75 nM) for 12 and 24 h. Each data point in the plots and in the bar graphs was derived from no less than 5 biological repeats with duplicates or triplicates. One-way ANOVA analyses for the three time points 6, 9, and 24 h generated p < 0.0001 in (A) for the F-test and interested pairwise Tukey test results are indicated. Number of biological repeats with triplication = 3. The error bars depict standard deviations.
Figure 6.
Figure 6.. Parallel Comparison of Assay Readout between the RADAR and ARK Assays
(A) RADAR assay of 293A, HeLa, and TK6 cells treated with 10 μM CPT for 1 h. Upper panel: representative slot blot of DPC samples visualized by an anti-TOP1 antibody as performed by the standard RADAR assay. Lower panel: slot blot (using anti-double-stranded DNA [dsDNA]) of DNA isolated from corresponding samples in the upper panel. (B) Relative TOP1-DPC induction by normalizing the TOP1-DPC chemiluminescent signal to the corresponding DNA signal in (A). The background levels of the mock-treated sample (Ctrl) for each cell line were set to 1. (C) ARK detection of TOP1-DPC from identical cell samples used in (A). (D) DPC isolates were prepared by the ARK assay protocol from identical cell samples used in (A) and blotted with an anti-TOP1 antibody (upper panel). Lower panel: slot blotting of DNA isolated from corresponding samples in the upper panel. The number of biological repeats ≥3. The error bars depict standard deviations.
Figure 7.
Figure 7.. Removal of DPCs in Fanconi Anemia and NER Mutants
(A) Clonogenic survival of HeLa wild-type, XPA−/−, FANCL−/−, XPA−/−/FANCL−/− cells treated with FA. (B) Removal of DPCs in wild-type HeLa cells and other indicated knockout derivatives. Cells were exposed to 500 μM FA for 2 h. DPC coefficients were determined for each cell line at indicated time points and normalized against the 0 time point to arrive at the percentages of DPC remaining. (C) Left panel: DPC accumulation in wild-type HeLa cells and other indicated knockout derivatives continuously exposed to low-dose FA (75 μM) for 6 and 12 h; right panel: analysis of FA-induced DPC accumulation among HeLa cells examined in the left panel after formaldehyde treatment for 6 and 12 h, respectively. Accumulated DPCs are calculated from the DPC coefficient at the selected time point with a deduction of background level (time 0) for corresponding HeLa cell lines. Number of biological repeats with duplication: n = 2 for (A), n = 4 for (B) and (C). The error bars depict standard deviation. One-way ANOVA analyses for the indicated time points (9 and 18 hr in B; 6 and 12 h in C) generated p < 0.0002 for the F-test, and interested pain/vise Tukey test results are displayed.

References

    1. Barker S, Weinfeld M, Zheng J, Li L, and Murray D (2005). Identification of mammalian proteins cross-linked to DNA by ionizing radiation. J. Biol. Chem 280, 33826–33838. - PubMed
    1. Centore RC, Havens CG, Manning AL, Li JM, Flynn RL, Tse A, Jin J, Dyson NJ, Walter JC, and Zou L (2010). CRL4(Cdt2)-mediated destruction of the histone methyltransferase Set8 prevents premature chromatin compaction in S phase. Mol. Cell 40, 22–33. - PMC - PubMed
    1. Chválová K, Brabec V, and Kaspárková J (2007). Mechanism of the formation of DNA-protein cross-links by antitumor cisplatin. Nucleic Acids Res. 85, 1812–1821. - PMC - PubMed
    1. Cong L, Ran FA, Cox D, Lin S, Barretto R, Habib N, Hsu PD, Wu X, Jiang W, Marraffini LA, and Zhang F (2013). Multiplex genome engineering using CRISPR/Cas systems. Science 339, 819–823. - PMC - PubMed
    1. Costa M, Zhitkovich A, Gargas M, Paustenbach D, Finley B, Kuykendall J, Billings R, Carlson TJ, Wetterhahn K, Xu J, et al. (1996). Interlaboratory validation of a new assay for DNA-protein crosslinks. Mutat. Res 369, 13–21. - PubMed

Publication types