. 2020 Jan 28;30(4):959-968.e3.
doi: 10.1016/j.celrep.2019.12.084.

Circuit Integration Initiation of New Hippocampal Neurons in the Adult Brain

Affiliations

Circuit Integration Initiation of New Hippocampal Neurons in the Adult Brain

Chih-Hao Yang et al. Cell Rep. .

Abstract

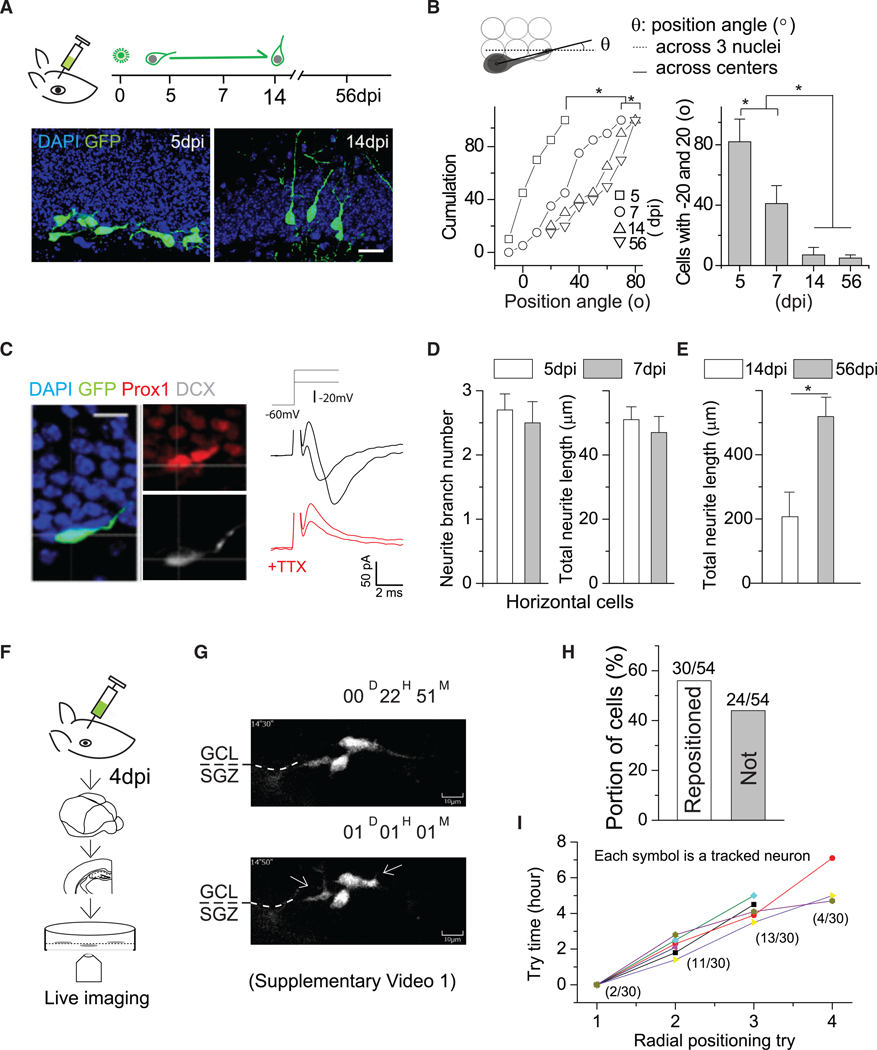
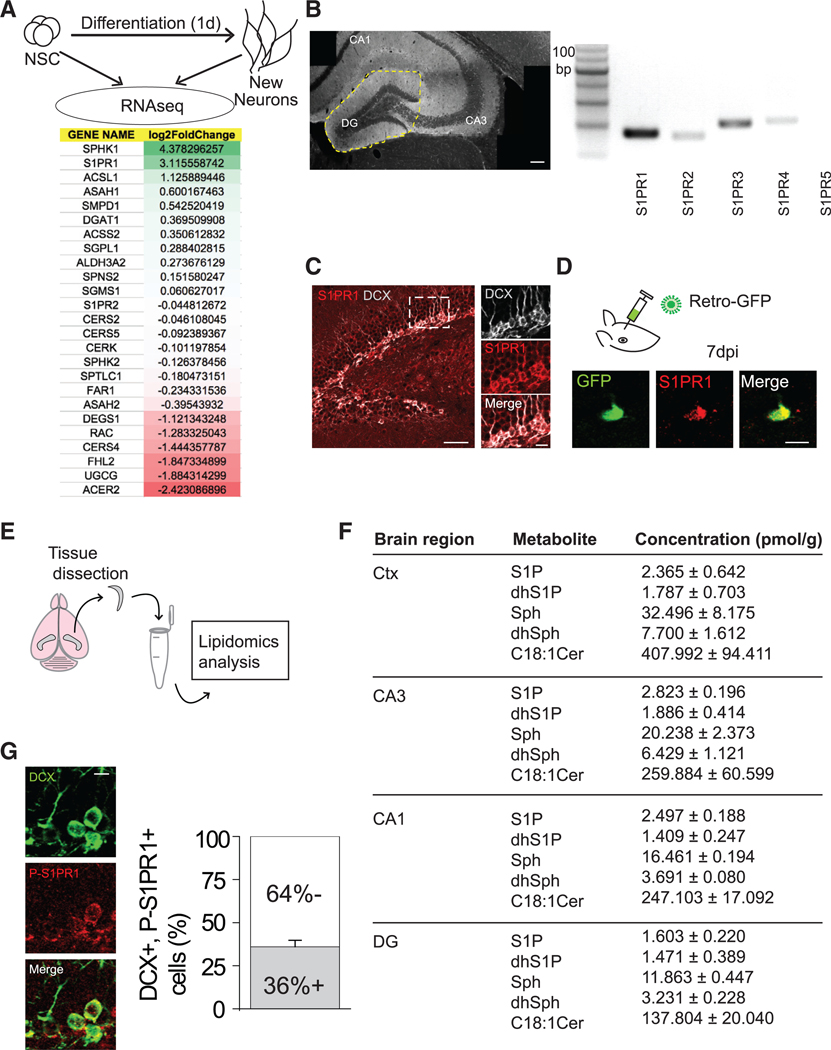
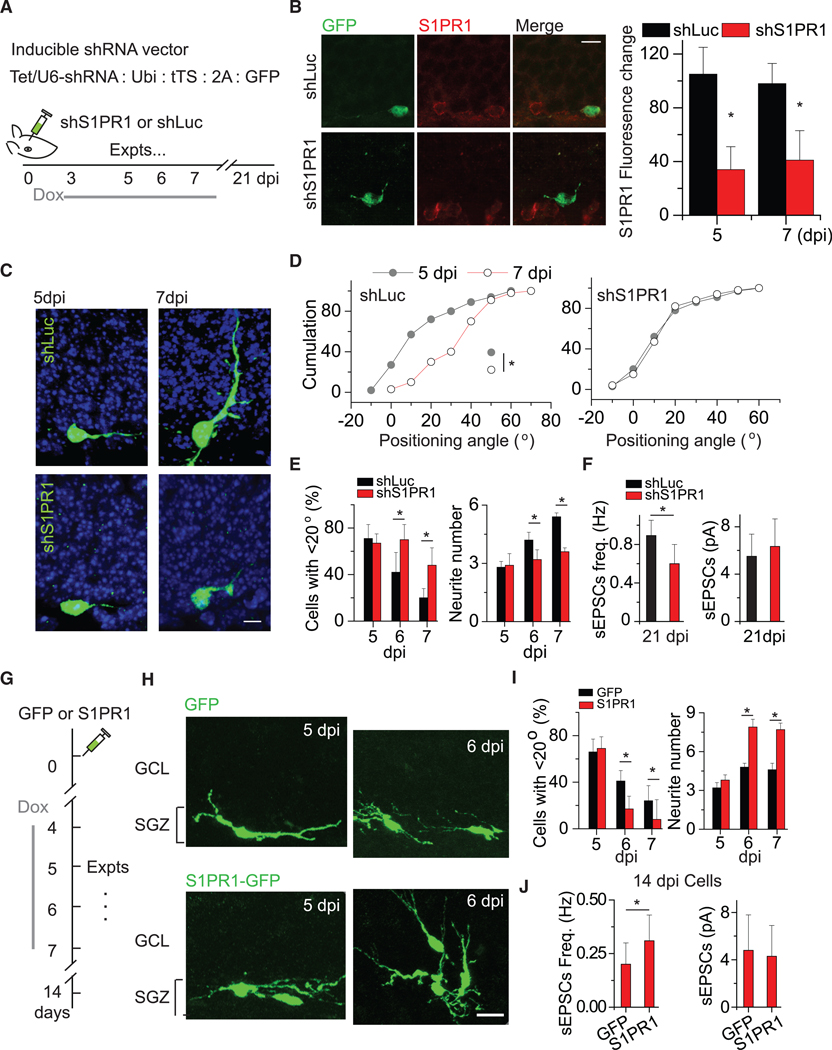
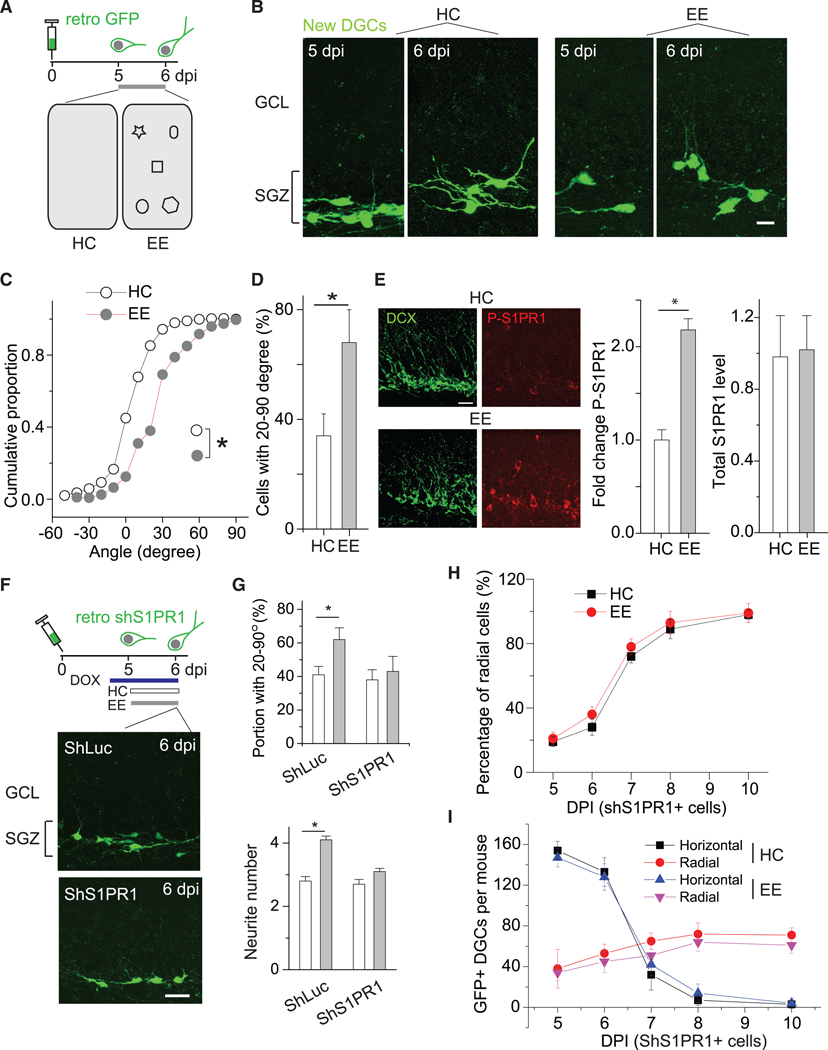
In the adult brain, new dentate granule cells integrate into neural circuits and participate in hippocampal functioning. However, when and how they initiate this integration remain poorly understood. Using retroviral and live-imaging methods, we find that new neurons undergo neurite remodeling for competitive horizontal-to-radial repositioning in the dentate gyrus prior to circuit integration. Gene expression profiling, lipidomics analysis, and molecular interrogation of new neurons during this period reveal a rapid activation of sphingolipid signaling mediated by sphingosine-1-phosphate receptor 1. Genetic manipulation of this G protein-coupled receptor reveals its requirement for successful repositioning of new neurons. This receptor is also activated by hippocampus-engaged behaviors, which enhances repositioning efficiency. These findings reveal that activity-dependent sphingolipid signaling regulates cellular repositioning of new dentate granule cells. The competitive horizontal-to-radial repositioning of new neurons may provide a gating strategy in the adult brain to limit the integration of new neurons into pre-existing circuits.

Keywords: G protein-coupled receptor; adult hippocampal neurogenesis; circuit integration initiation; dentate granule cell; electrophysiological maturation; environmental enrichment; hippocampus behavior-engaged activation; lipidomics; sphingosine-1-phosphate receptor 1.


Conflict of interest statement

Declaration of Interests The authors declare no competing interests.

Figures

Figure 1.
Figure 1.. Newly Generated DGCs Undergo Horizontal-to-Radial Repositioning via Neurite Remodeling
(A) (Top) Schematic showing the procedure and timeline for retroviral labeling of newly generated DGCs in adult mice. (Bottom) Representative images of new DGCs at 5 and 14 dpi. Scale bar, 20 μm. (B) (Top) Schematic showing the strategy for angle measurement. (Bottom) Summary plot of angle distributions of newly generated DGCs at 5, 7, 14, and 56 dpi. 5 dpi, 37 cells from 4 mice; 7 dpi, 59 cells from 5 mice; 14 dpi, 31 cells from 3 mice; 56 dpi, 26 cells from 3 mice. Komolgorov-Smirnov test, *p < 0.05, left. One-way ANOVA followed by post hoc LSD tests, *p < 0.05, right. (C) (Left) DCX and Prox1 immunostaining of horizontal new DGCs at 5 dpi. (Right) Sample recording traces of Na+ currents from horizontal GFP+ cells at 5 dpi. Scale bar, 10 μm. (D) Summary plots of the numbers (left) and lengths (right) of neurites from new DGCs at 5 and 7 dpi. Both groups were not statistically significant. Student’s t test(n = 3–4 mice). (E) Plot of total neurite length of DGCs at 14 and 56 dpi. Student’s t test, *p < 0.05 (n = 3–4 mice). (F) Illustration showing the experimental slice culture procedure. (G) Sequential views of two typical newborn DGCs repositioning during the first day of imaging (5 dpi). The full video is presented in Video S1. (H) Summary plot showing the proportion of analyzed cells that have either succeeded or failed in repositioning. (I) Summary plot for the attempts of cells to transit and succeeded in repositioning. From attempt to attempt, the interval is ~2 h. The parentheses indicate the proportion of cells that made the transition during that attempt to do so. Error bars represent standard error of mean.
Figure 2.
Figure 2.. Newly Generated DGCs Highly Express S1PR1
(A) (Top) Procedure for RNA-seq analysis of new neurons 1 day after differentiating from adult hippocampal neural stem cells. (Bottom) Expression profiling of sphingolipid signaling-related genes. Mann-Whitney U test, SPHK1 p = 0.064, S1PR1 p = 0.064, ACSL1 p = 0.064, ASAH1 p = 0.064, SMPD1 p = 0.064, DGAT1 p = 0.064, ACSS2 p = 0.355, SGPL1 p = 0.064, ALDH3A2 p = 0.04, SPNS2 p = 1.000, SGMS1 p = 0.064, S1PR2 p = 0.165, CERS2 p = 0.064, CERS5 p = 0.355, CERK p = 0.355, SPHK2 p = 0.064, SPTLC1 p = 1.000, FAR1 p = 0.064, ASAH2 p = 0.643, DEGS1 p = 0.060, RAC p = 0.165, CERS4 p = 0.064, FHL2 p =1.000, UGCG p = 0.06, ACER2 p = 0.643. (B) (Left) Region of dentate gyrus dissected. (Right) S1PR isoform mRNA detection (S1PR5 was not detected). Scale bar, 100 μm. (C) (Left) Representative image of the dentate gyrus immunostained for DCX and S1PR1. Scale bar, 50 μm. (Right) Magnified view of the region outlined in the image on the left. Scale bar, 10 μm. (Related to Figures S1 and S2). (D) (Top) Retroviral GFP was delivered to the DG to label newly born DGCs. (Bottom) Representative image showing expression of S1PR1 in a DGC at 7 dpi. Scale bar, 10 μm. (E) Schematic of hippocampal/cortical dissection and lipidomics analysis. (F) Concentrations of various sphingolipid metabolites in several brain regions. DG versus Ctx: p < 0.0001 (two-way ANOVA), followed by post hoc LSD tests, Sph p < 0.05, dhSph p < 0.05, S1P p = 0.32, dsS1P p = 0.738, Cer18:1 p < 0.001. Experiment repeated in triplicates. Cer, ceramide; Ctx, cortex; DG, dentate gyrus; S1P, sphingosine1-phosphate; dhS1P, dihydrosphingosine 1phosphate; Sph, sphingosine; dhSph, dihydrosphingosine. (G) (Left) Representative image of DCX and phospho (Thr236)-S1PR1 (P-S1PR1) immunostaining in the DG. Scale bar, 10 μm. (Right). Quantification of the proportion of DCX+ cells immunopositive for P-S1PR1 (n = 3–4). Error bars represent standard error of mean.
Figure 3.
Figure 3.. S1PR1 Knockdown Reduces Neurite Growth and Horizontal-to-Radial Repositioning
(A) Description of shRNA expression vector and experimental timeline of shRNA viral injection and doxycycline induction. (B) (Left) Representative images of S1PR1 expression in shS1PR1+ and shLuc+ DGCs at 5 dpi. (Right) Summary plot of the S1PR1 fluorescent signal intensity. *p < 0.05 (two-tailed unpaired t test). (C) Representative images of shS1PR1+ and shLuc+ newborn DGCs and their morphological maturation at 5 and 7 dpi. (D) Cumulative distribution plots of positioning angles of shS1PR1+ and shLuc+ DGCs at 5 and 7 dpi. *p < 0.05 (n = 5 for shLuc group and n = 7 for shS1PR1; Kolmogorov-Smirnov tests). (E) Summary of the proportions of cells with an angle <20°at 5, 6, and 7 dpi. *p < 0.05 (n = 5 for shLuc group and n = 7 for shS1PR1; two-way ANOVA followed by post hoc LSD tests). (F) Glutamatergic synaptic transmission recorded from shLuc and shS1PR1 adult-born DGCs at 21 dpi (n = 6 neurons from 3 mice for each, unpaired t tests, *p < 0.05). (G) Schematic for examining the effect of S1PR1 expression on the repositioning of newly generated DGCs. (H) Representative images of new DGCs with GFP only or S1PR1 expression. Scale bar, 15 μm. (I) Plot of the numbers of position angles and neurite branches of control and shRNA-expressing cells at 5, 6, and 7 dpi. The statistics are the same as described for (E) (n = 3 for GFP and n = 6 for S1PR1-GFP). (J) Glutamatergic synaptic transmission recorded from GFP and GFP-S1PR1 newly generated DGCs at 14 dpi (n = 7 neurons from 3–4 mice, *p < 0.05). Expts, experiments. Error bars represent standard error of mean.
Figure 4.
Figure 4.. Environmental Enrichment Accelerates the Horizontal-to-Radial Repositioning of Newly Generated DGCs via S1PR1 Activation
(A) Schematic showing the experimental design, including the timeline for viral labeling and experiments (top) and two environments, HC and EE (bottom). HC, home cage; EE, enriched environment. (B) Sample images of GFP+ newly generated DGCs at 5 and 6 dpi from both HC and EE conditions. Scale bar, 10 μm. (C) Plot of the distribution of primary neurite angles of newly generated DGCs under either HC or EE conditions. *p < 0.05 (n = 5 mice for HC and n = 6 for EE; Kolmogorov-Smirnov test). (D) Summary plot of the proportion of newly generated DGCs with radial primary neurites of 20°−90°at 6 dpi under HC and EE conditions. *p < 0.05 (n = 3–4 mice; two-tailed unpaired t test). (E) (Left) Representative images showing phosph-S1PR1 in DCX+ new DGCs under HC and EE conditions. (Right) Summary of S1PR1 and P-S1PR1 levels in DCX+ cells. *p < 0.05 (n = 4 mice for HC and n = 3 for EE; two-tailed unpaired t tests). (F) Experimental outline (top) and representative images of GFP+ shS1PR1- and shLuc-expressing DGCs at 6 dpi (bottom) under HC conditions. Scale bar, 20 μm. (G) Summary of the portion of DGCs with angles between 20°and 90°at 6 dpi from mice under HC and EE conditions. *p < 0.05 (shLuc), p = 0.330 (shS1PR1) (two-tailed unpaired t test) (top). Summary of the numbers of neurites from DGCs at 6 dpi from mice under HC and EE conditions. *p < 0.01 (shLuc), p > 0.05 (shS1PR1) (n = 5 mice; two-tailed unpaired t test) (bottom). Related to Figures S3 and S4. (H) Summary of percentages of radially positioned GFP+ DGCs at 5, 6,7,8,and10 dpi under HC and EE conditions(n= 3–5mice per group and developmental stage). (I) Summary of the numbers of GFP+ DGCs (shS1PR1) at 5, 6, 7, 8, and 10 dpi under HC and EE conditions (n = 3–5 mice per group and developmental stage). Error bars represent standard error of mean.

References

    1. Altman J, and Das GD (1965). Autoradiographic and histological evidence of postnatal hippocampal neurogenesis in rats. J. Comp. Neurol. 124, 319–335. - PubMed
    1. Bielawski J, Szulc ZM, Hannun YA, and Bielawska A (2006). Simultaneous quantitative analysis of bioactive sphingolipids by high-performance liquid chromatography-tandem mass spectrometry. Methods 39, 82–91. - PubMed
    1. Chavez A, Schmidt TT, Yazbeck P, Rajput C, Desai B, Sukriti S, Giantsos-Adams K, Knezevic N, Malik AB, and Mehta D (2015). S1PR1 Tyr143 phosphorylation downregulates endothelial cell surface S1PR1 expression and responsiveness. J. Cell Sci. 128, 878–887. - PMC - PubMed
    1. Christian KM, Song H, and Ming GL (2014). Functions and dysfunctions of adult hippocampal neurogenesis. Annu. Rev. Neurosci. 37, 243–262. - PMC - PubMed
    1. Eriksson PS, Perfilieva E, Björk-Eriksson T, Alborn AM, Nordborg C, Peterson DA, and Gage FH (1998). Neurogenesis in the adult human hippocampus. Nat. Med. 4, 1313–1317. - PubMed

MeSH terms

LinkOut - more resources