. 2020 Jan 29;5(1):e00550-19.
doi: 10.1128/mSphere.00550-19.

Toxoplasma gondii Dysregulates Barrier Function and Mechanotransduction Signaling in Human Endothelial Cells

Affiliations

Toxoplasma gondii Dysregulates Barrier Function and Mechanotransduction Signaling in Human Endothelial Cells

Armond L Franklin-Murray et al. mSphere. .

Abstract

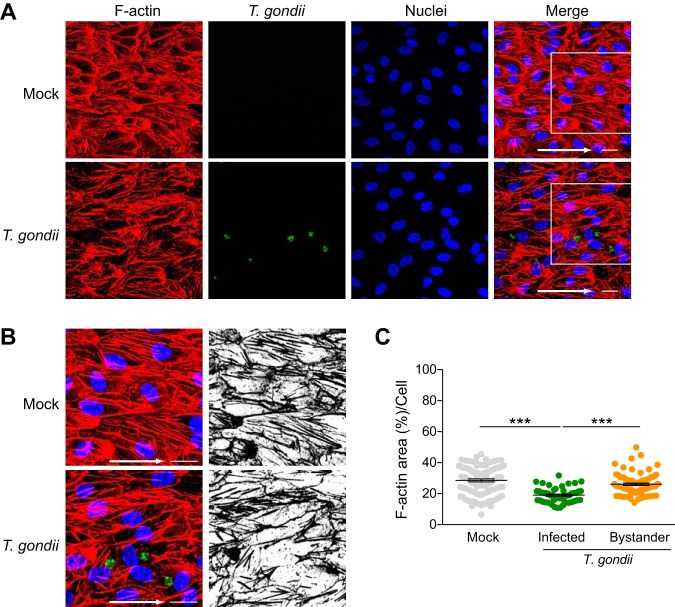
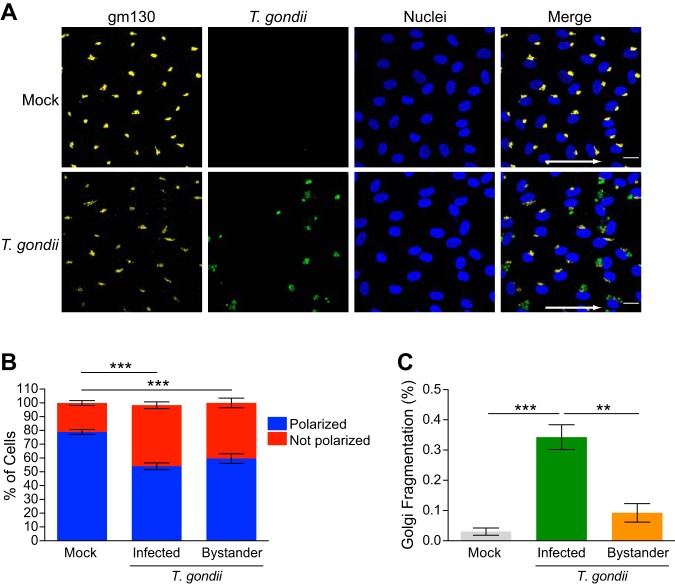
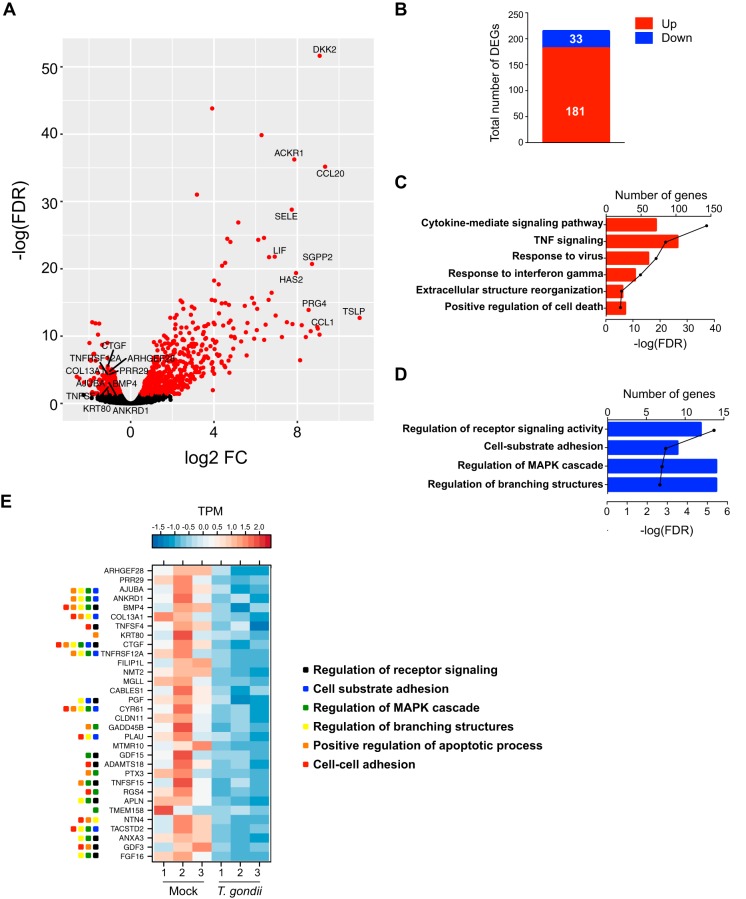
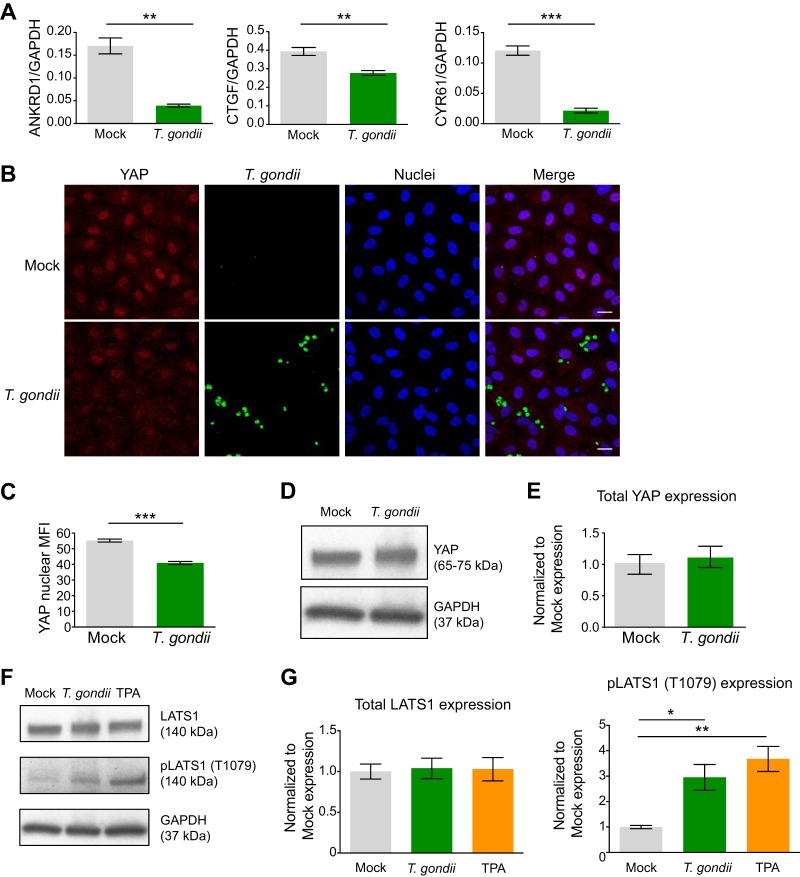
Toxoplasma gondii can infect and replicate in vascular endothelial cells prior to entering host tissues. However, little is known about the molecular interactions at the parasite-endothelial cell interface. We demonstrate that T. gondii infection of primary human umbilical vein endothelial cells (HUVEC) altered cell morphology and dysregulated barrier function, increasing permeability to low-molecular-weight polymers. T. gondii disrupted vascular endothelial cadherin (VE-cadherin) and β-catenin localization to the cell periphery and reduced VE-cadherin protein expression. Notably, T. gondii infection led to reorganization of the host cytoskeleton by reducing filamentous actin (F-actin) stress fiber abundance under static and microfluidic shear stress conditions and by reducing planar cell polarity. RNA sequencing (RNA-Seq) comparing genome-wide transcriptional profiles of infected to uninfected endothelial cells revealed changes in gene expression associated with cell-cell adhesion, extracellular matrix reorganization, and cytokine-mediated signaling. In particular, genes downstream of Hippo signaling and the biomechanical sensor and transcriptional coactivator Yes-associated protein (YAP) were downregulated in infected endothelial cells. Interestingly, T. gondii infection activated Hippo signaling by increasing phosphorylation of LATS1, leading to cytoplasmic retention of YAP, and reducing YAP target gene expression. These findings suggest that T. gondii infection triggers Hippo signaling and YAP nuclear export, leading to an altered transcriptional profile of infected endothelial cells.IMPORTANCE Toxoplasma gondii is a foodborne parasite that infects virtually all warm-blooded animals and can cause severe disease in individuals with compromised or weakened immune systems. During dissemination in its infected hosts, T. gondii breaches endothelial barriers to enter tissues and establish the chronic infections underlying the most severe manifestations of toxoplasmosis. The research presented here examines how T. gondii infection of primary human endothelial cells induces changes in cell morphology, barrier function, gene expression, and mechanotransduction signaling under static conditions and under the physiological conditions of shear stress found in the bloodstream. Understanding the molecular interactions occurring at the interface between endothelial cells and T. gondii may provide insights into processes linked to parasite dissemination and pathogenesis.

Keywords: Hippo signaling; Toxoplasma gondii; VE-cadherin; actin; endothelial cell; mechanotransduction.


Figures

FIG 1
FIG 1
Effect of T. gondii infection on HUVEC barrier function. (A) Transendothelial electrical resistance (TEER) of mock-infected, T. gondii-infected, or IL-1β-treated (0.5 ng/ml) HUVEC monolayers is shown. HUVEC were cultured to confluence for 3 days. T. gondii or IL-1β was added at time zero (start), and barrier integrity was measured at 15-min intervals for 18 h by ECIS. Data reflect combined results from three independent experiments and are presented as means ± standard errors of the means (SEM) (error bars). Values that are significantly different by two-way ANOVA with a Bonferroni posttest correction are indicated by asterisks as follows: *, P < 0.05; ***, P < 0.001. (B) Permeability of mock-infected, T. gondii-infected, or IL-1β-treated (0.5 ng/ml) HUVEC monolayers, as measured by transendothelial flux of 40-kDa FITC-dextran at 18 h. Flux is presented as means ± SEM. Data reflect combined results from three independent experiments. Values that are significantly different by one-way ANOVA with a Tukey posttest are indicated by bars and asterisks as follows: *, P < 0.05; ***, P < 0.001.
FIG 2
FIG 2
Adherens junction protein expression in T. gondii-infected HUVEC. (A) HUVEC were cultured to confluence on fibronectin-coated glass coverslips for 3 days and then either mock infected with fresh media or infected with T. gondii. At 18 hpi, the cells were fixed, permeabilized, and stained with antibodies specific to VE-cadherin and β-catenin and counterstained with DAPI. Bars, 20 μm. (B and C) The continuity of VE-cadherin and β-catenin signal at the cell periphery was quantified by examining immunofluorescent signal of VE-cadherin at the cell periphery and defining gaps of ≥2.5 μm as discontinuous signal. Data are presented as the means ± SEM from at least three independent experiments. Student’s t test was performed (***, P < 0.001). (D) HUVEC were cultured to confluence for 3 days and either mock infected with fresh media or infected with T. gondii. At 18 hpi, cells were lysed and analyzed by Western blotting using antibodies for total VE-cadherin, β-catenin, and glyceraldehyde-3-phosphate dehydrogenase (GAPDH). Representative blots from five independent experiments are shown. (E and F) Densitometry was performed on Western blots of VE-cadherin and β-catenin by normalizing band intensities to those of GAPDH. Data are presented as the means ± SEM. Combined data from five independent experiments are shown. Student’s t test was performed (*, P < 0.05).
FIG 3
FIG 3
Cell morphology and stress fiber abundance in HUVEC during T. gondii infection. HUVEC were cultured to confluence on fibronectin-coated glass coverslips for 3 days and then either mock infected with fresh media or infected with T. gondii. Eighteen hours later, the cells were fixed, permeabilized, and stained to detect nuclei, VE-cadherin, or F-actin for confocal microscopy. (A) The number of nuclei per 63× field of view (FOV) was quantified. Each symbol represents one FOV. (B) The maximal cell length of individual HUVEC in each condition was determined. Each symbol represents the value for an individual cell. The means (horizontal lines) ± SEM (error bars) from 3 to 10 independent experiments are shown. Values that are significantly different (P < 0.05) by Student’s t test are indicated by a bar and asterisk. (C) Representative images of F-actin (as detected by phalloidin staining) and DAPI in mock-infected and T. gondii-infected HUVEC are shown. Bars, 20 μm. (D and E) Percent area of F-actin per 63× FOV (D) or F-actin area per cell (E) under each condition are shown. The means ± SEM (error bars) from four independent experiments are shown. Statistical significance was analyzed by Student’s t test for panels A, B, and D and by one-way ANOVA with a Tukey posttest correction for panel E and is indicated by asterisks as follows: *, P < 0.05, ***, P < 0.001.
FIG 4
FIG 4
Stress fiber abundance in HUVEC exposed to shear stress during T. gondii infection. HUVEC were cultured to confluence on ibiTreat 0.4-luer ibidi microchannels under 5.5-dyne/cm2 shear stress for 3 days and either mock infected with fresh media or infected with T. gondii. At 18 hpi, the samples were fixed, permeabilized, and stained with phalloidin to detect F-actin. (A) Fluorescence microscopy of F-actin, GFP-expressing T. gondii, and nuclei under 5.5-dyne/cm2 shear stress in mock-infected and T. gondii-infected cells at 18 hpi is shown. The arrows in the merged images indicate the direction of flow. Bars = 20 μm. (B) Magnified insets of the white squares shown in the merged images of panel A, with F-actin (red), GFP-expressing T. gondii (green), and nuclei (blue) in mock-infected and T. gondii-infected HUVEC exposed to 5.5-dyne/cm2 shear stress. Black and white images show F-actin only. (C) Percent area of F-actin on a per cell basis is shown. The means ± SEM (error bars) from four independent experiments are shown. One-way ANOVA with a Tukey posttest correction was performed (***, P < 0.001).
FIG 5
FIG 5
Effect of T. gondii infection on HUVEC planar cell polarity. HUVEC were cultured to confluence on ibiTreat 0.4-luer ibidi microchannels under 5.5-dyne/cm2 shear stress for 3 days and either mock infected with fresh media or infected with T. gondii. At 18 hpi, the samples were fixed, permeabilized, and stained with anti-gm130 to detect the Golgi complex. (A) Fluorescence microscopy of gm130, GFP-expressing T. gondii, and nuclei at 5.5-dyne/cm2 shear stress in mock-infected and T. gondii-infected cells at 18 hpi is shown. The arrows in the merged images indicate the direction of flow. Bars = 20 μm. (B) Planar cell polarity of mock-infected and T. gondii-infected HUVEC at 18 hpi is shown. Combined data from three independent experiments are presented as the means ± SEM. One-way ANOVA with a Tukey posttest correction was performed (***, P < 0.001). (C) The percentage of cells exhibiting Golgi fragmentation was quantified in the mock-infected and T. gondii-infected cultures at 18 hpi. Directly infected cells and bystander cells in the infected cultures are shown. Data are presented as means ± SEM from three independent experiments. One-way ANOVA with a Tukey posttest correction was performed (***, P < 0.001; **, P < 0.01).
FIG 6
FIG 6
RNA-Seq in mock-infected or T. gondii-infected HUVEC at 18 hpi. HUVEC were mock infected with fresh media or infected with T. gondii at an MOI of 2 for 18 h, and RNA-Seq was performed on samples from three independent experiments. (A) Volcano plot depicting total gene expression changes in HUVEC at 18 hpi with red representing significantly differentially expressed genes (DEGs) (FDR < 0.05) and black representing nonsignificantly changed genes (FDR ≥ 0.05). The top 10 upregulated and downregulated DEGs with RPKM of >5 are labeled. FC, fold change. (B) Total number of DEGs (fold change of >2, FDR < 0.05, RPKM > 5) that were up- or downregulated by infection. (C and D) Bar graphs show Gene Ontology (GO) terms for gene sets with increased (C) or decreased (D) transcript abundance at 18 hpi. The number of genes within each GO term is shown, and the black line represents the −log (FDR-adjusted P value) for each GO term. TNF, tumor necrosis factor. (E) Heatmaps represent expression of the 33 downregulated DEGs at 18 hpi. Normalized TPM (transcripts per million) values are shown. The range of colors is based on scaled and centered TPM values of the entire set of genes (red represents high expression, and blue represents low expression). For genes that mapped to multiple GO pathways, the pathways are indicated by colored squares.
FIG 7
FIG 7
Activation of Hippo signaling in HUVEC during T. gondii infection. HUVEC were mock infected with fresh media or infected with T. gondii at an MOI of 2 for 18 h. (A) qPCR was performed with specific primers for ANKRD1, CTGF, CYR61, or GAPDH. The transcript levels relative to those of GAPDH from one representative experiment out of a total of three experiments are shown. Student’s t test was performed (**, P < 0.01; ***, P < 0.001). (B) HUVEC were mock infected or infected with GFP-expressing T. gondii, and 18 h later, the cells were fixed, permeabilized, and stained with antibody to detect YAP and counterstained with DAPI. Bars, 20 μm. (C) The mean fluorescence intensity (MFI) of nuclear YAP in mock-infected and T. gondii-infected cells at 18 hpi is shown. Combined data from three independent experiments are shown and presented as the means ± SEM. Student’s t test was performed (***, P < 0.001). (D and F) HUVEC were cultured to confluence and either mock infected, infected with T. gondii, or treated with TPA. Eighteen hours later, the cells were lysed and analyzed by Western blotting using antibodies for total YAP, total LATS1, phospho-LATS1 (Thr1079), or GAPDH. Representative blots from three independent experiments are shown. (E and G) Densitometry was performed on Western blots of total YAP, total LATS1 protein, and phospho-LATS1 (Thr1079) by normalizing band intensities to those of GAPDH. Data are presented as means ± SEM. Combined data from five independent experiments are shown. One-way ANOVA with a Tukey posttest correction was performed (*, P < 0.05).

References

    1. Michiels C. 2003. Endothelial cell functions. J Cell Physiol 196:430–443. doi:10.1002/jcp.10333. - DOI - PubMed
    1. Dejana E, Orsenigo F, Lampugnani MG. 2008. The role of adherens junctions and VE-cadherin in the control of vascular permeability. J Cell Sci 121:2115–2122. doi:10.1242/jcs.017897. - DOI - PubMed
    1. Lampugnani MG, Resnati M, Raiteri M, Pigott R, Pisacane A, Houen G, Ruco LP, Dejana E. 1992. A novel endothelial-specific membrane protein is a marker of cell-cell contacts. J Cell Biol 118:1511–1522. doi:10.1083/jcb.118.6.1511. - DOI - PMC - PubMed
    1. Barry AK, Wang N, Leckband DE. 2015. Local VE-cadherin mechanotransduction triggers long-ranged remodeling of endothelial monolayers. J Cell Sci 128:1341–1351. doi:10.1242/jcs.159954. - DOI - PMC - PubMed
    1. Yu FX, Zhao B, Guan KL. 2015. Hippo pathway in organ size control, tissue homeostasis, and cancer. Cell 163:811–828. doi:10.1016/j.cell.2015.10.044. - DOI - PMC - PubMed

MeSH terms