. 2020 Feb 11;117(6):3123-3134.
doi: 10.1073/pnas.1918611117. Epub 2020 Jan 29.

Remethylation of Dnmt3a-/- hematopoietic cells is associated with partial correction of gene dysregulation and reduced myeloid skewing

Affiliations

Remethylation of Dnmt3a-/- hematopoietic cells is associated with partial correction of gene dysregulation and reduced myeloid skewing

Shamika Ketkar et al. Proc Natl Acad Sci U S A. .

Abstract

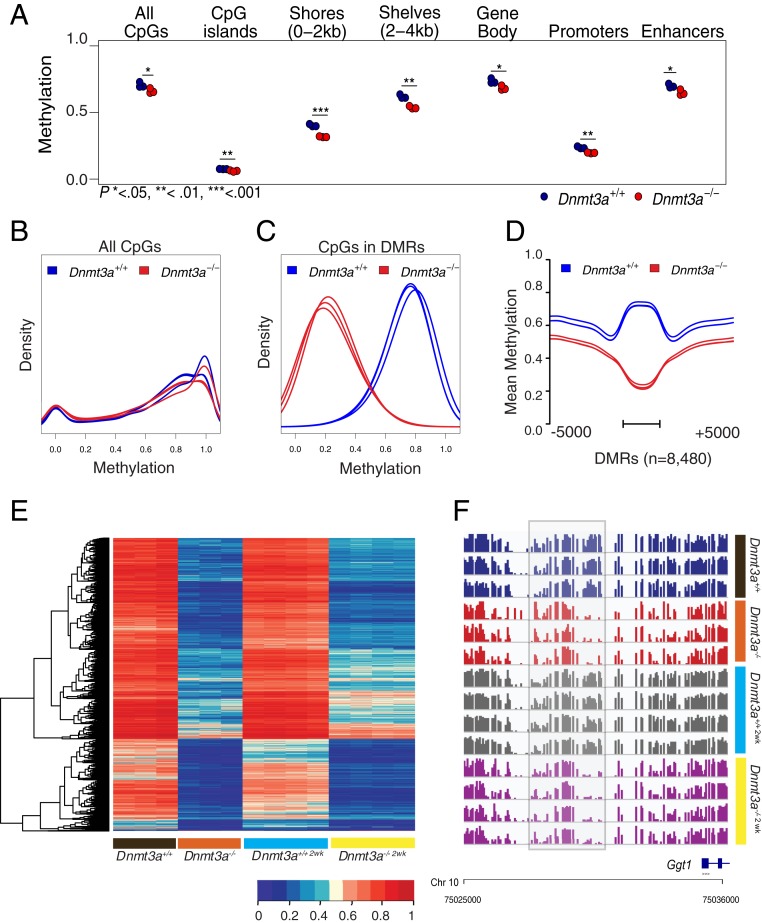
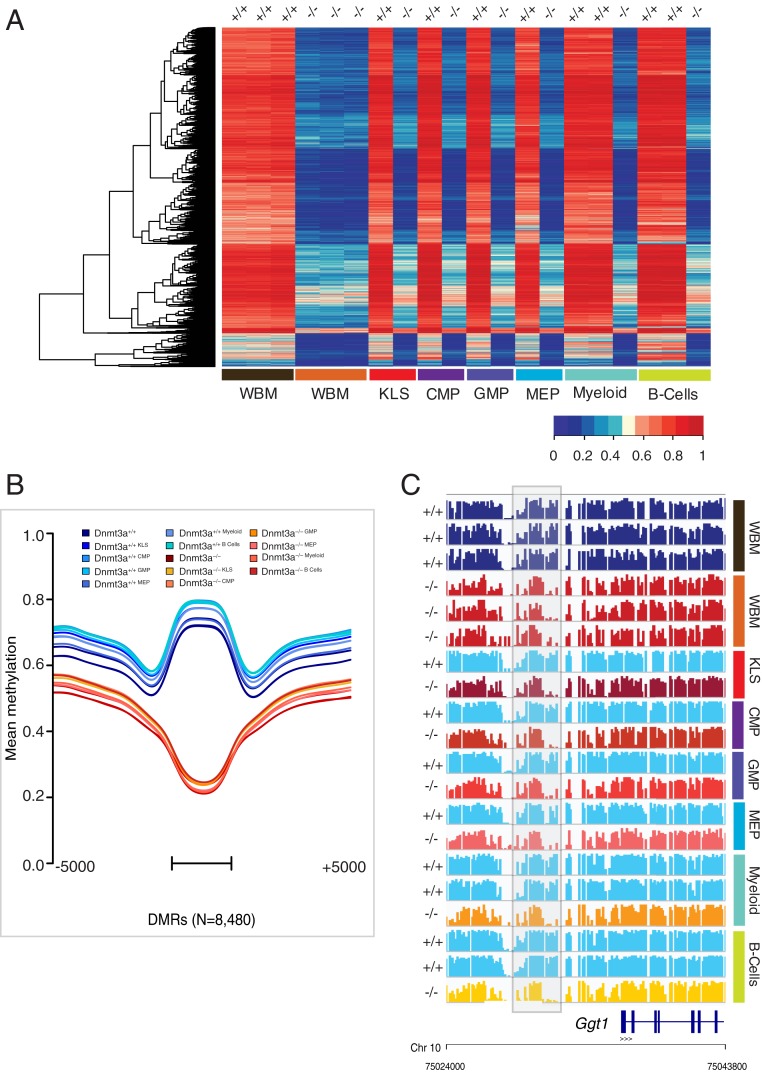
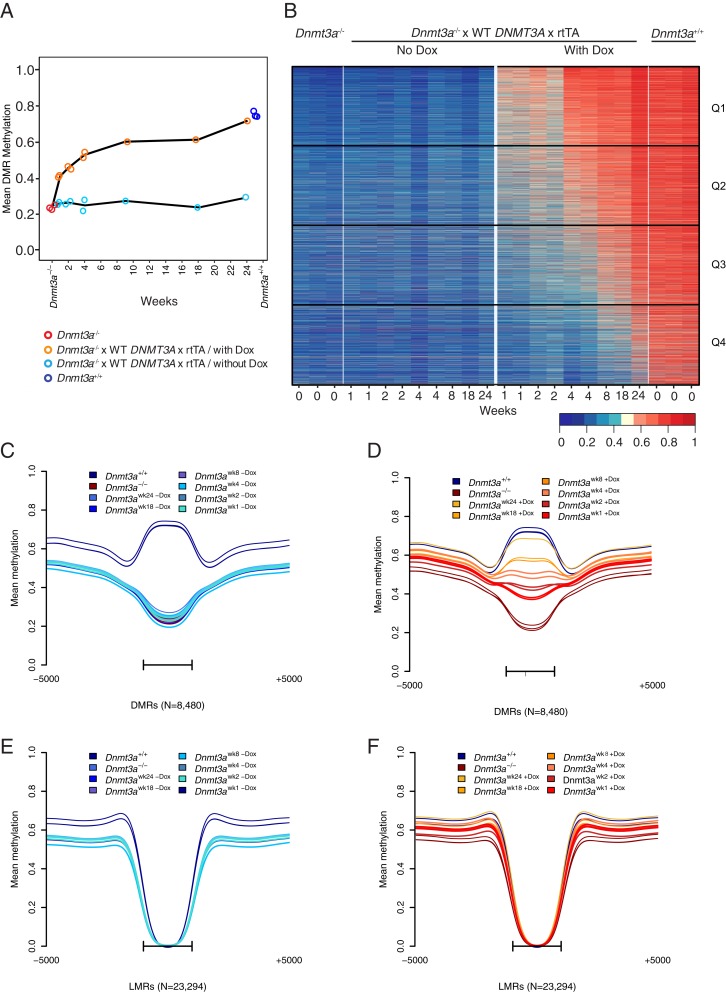
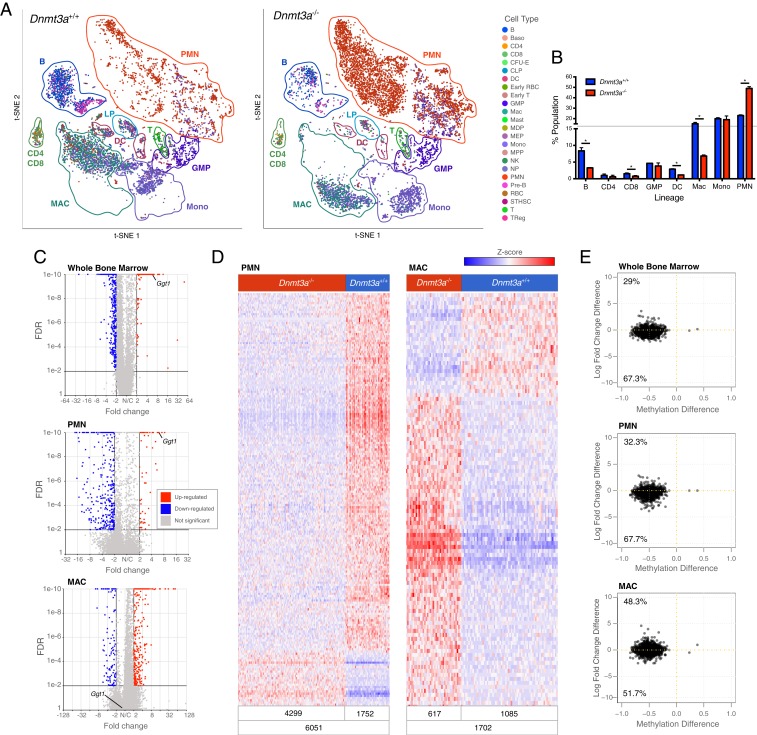
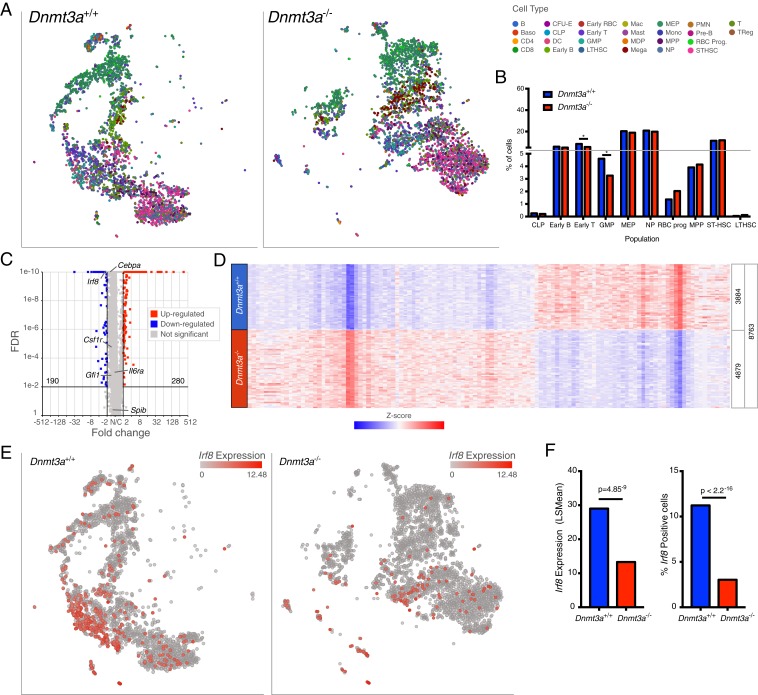
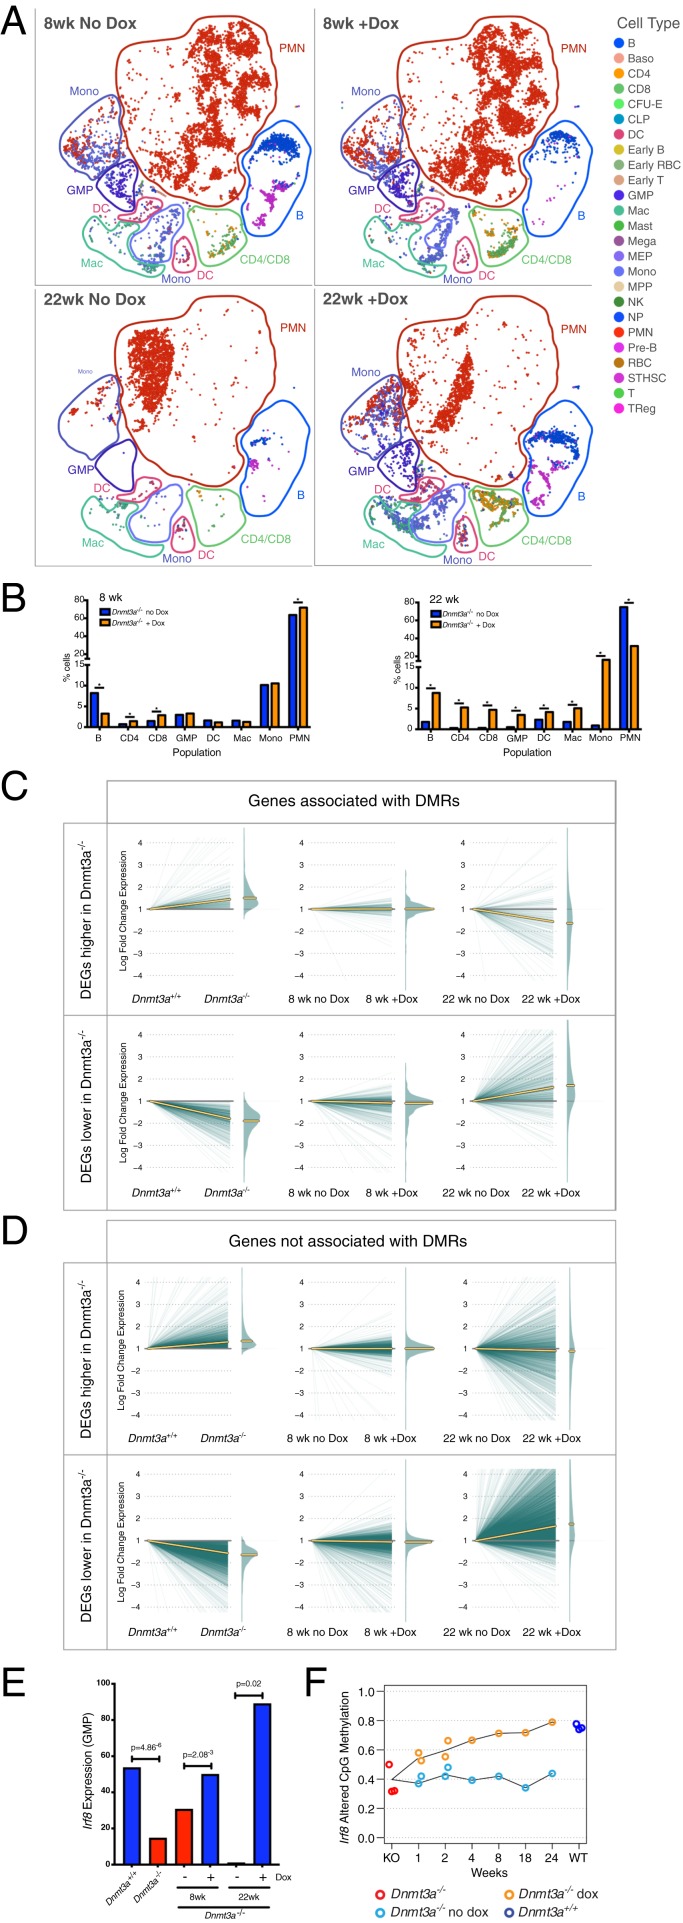
Mutations in the DNA methyltransferase 3A (DNMT3A) gene are the most common cause of age-related clonal hematopoiesis (ARCH) in older individuals, and are among the most common initiating events for acute myeloid leukemia (AML). The most frequent DNMT3A mutation in AML patients (R882H) encodes a dominant-negative protein that reduces methyltransferase activity by ∼80% in cells with heterozygous mutations, causing a focal, canonical DNA hypomethylation phenotype; this phenotype is partially recapitulated in murine Dnmt3a-/- bone marrow cells. To determine whether the hypomethylation phenotype of Dnmt3a-/- hematopoietic cells is reversible, we developed an inducible transgene to restore expression of DNMT3A in transplanted bone marrow cells from Dnmt3a-/- mice. Partial remethylation was detected within 1 wk, but near-complete remethylation required 6 mo. Remethylation was accurate, dynamic, and highly ordered, suggesting that differentially methylated regions have unique properties that may be relevant for their functions. Importantly, 22 wk of DNMT3A addback partially corrected dysregulated gene expression, and mitigated the expansion of myeloid cells. These data show that restoring DNMT3A expression can alter the epigenetic "state" created by loss of Dnmt3a activity; this genetic proof-of-concept experiment suggests that this approach could be relevant for patients with ARCH or AML caused by loss-of-function DNMT3A mutations.

Keywords: DNA methylation; DNA methyltransferase; gene expression; hematopoiesis.


Conflict of interest statement

Competing interest statement: T.J.L. is engaged in a scientific collaboration with Rigel Pharmaceuticals to develop drugs that inhibit the function of the DNMT3A R882H mutation. He has received two honoraria from Rigel Pharmaceuticals to give presentations at their company in South San Francisco, CA. None of this work is described in this paper.

Figures

Fig. 1.
Fig. 1.
DNA methylation phenotypes of Dnmt3a+/+ and Dnmt3a−/− bone marrow cells. (A) Mean CpG methylation levels from whole-genome bisulfite sequencing of bone marrow cells derived from Dnmt3a+/+ (n = 3) and Dnmt3a−/− mice (n = 3), harvested 6 wk after transplantation into lethally irradiated recipients. Mean values for all CpGs and annotated regions of the genome are shown. Hypothesis testing was performed via two-tailed, pairwise t tests, with Bonferroni correction for multiple testing within each genomic region; *P < 0.05; **P < 0.01; ***P < 0.001. Small but statistically significant differences are consistently observed in the methylation status of Dnmt3a+/+ and Dnmt3a−/− bone marrow cells across the genome. (B) Density plot of methylation values from all CpGs for each bone marrow sample shown in A. (C) Density plot of CpG methylation values from 8,480 DMRs defined by comparing the Dnmt3a+/+ (n = 3) and Dnmt3a−/− (n = 3) samples. (D) Aggregate (mean) methylation of 8,480 DMRs for each bone marrow sample. DMRs were scaled to a uniform length and are shown with the adjacent 5 kb of flanking sequence. The bar represents the span of the scaled DMR regions (see Methods). (E) Heatmap showing mean methylation values for the 8,480 DMRs as defined above. Values for the same DMRs were plotted passively for Dnmt3a+/+2wk and Dnmt3a−/−2wk samples (processed directly from 2-wk-old mice, and not transplanted). (F) Primary methylation values for each CpG (shown as a bar from 0 to 100% methylated for each sample) near a Dnmt3a−/− hypomethylated DMR in the 5′ flanking region of the Ggt1 gene. This region was identified as a DMR by comparing methylation values for Dnmt3a+/+ vs. Dnmt3a−/− or Dnmt3a−/−2wk samples (P = 3.20E-08 and 2.10E-15 by Mann−Whitney U test with Bonferroni correction).
Fig. 2.
Fig. 2.
Canonical DMRs identified in whole bone marrow (WBM) cells are conserved in multiple hematopoietic progenitor compartments and lineages. (A) Heatmap showing mean methylation values for the 8,480 DMRs from the unfractionated WBM cells of Dnmt3a+/+ (n = 3) and Dnmt3a−/− mice (n = 3). Values for the same DMRs were plotted passively for the KLS, GMP, CMP, and MEP compartments, and for mature flow-sorted populations consisting of Gr1+ cells (mature myeloid) and B220+ cells (predominantly B cells); “+/+” and “−/−” refer to the Dnmt3a genotype of each population. (B) Aggregate (mean) methylation at 8,480 DMRs as described in A: myeloid progenitor compartments: KLS, GMP, CMP, and MEP and mature populations, neutrophils, and B cells are plotted passively for the same loci. DMRs were scaled to a uniform length and are shown with the adjacent 5 kb of flanking sequence. The bar represents the span of the scaled DMR regions. (C) Primary methylation values for each CpG (shown as a bar from 0 to 100% methylated for each sample) near a Dnmt3a−/− DMR in the 5′ flanking region of the Ggt1 gene (gray box; see Fig. 1F). This region is significantly hypomethylated in total bone marrow samples, and all other purified cellular compartments (P = 3.30E-45 and P < 2.2e-16 by Mann−Whitney U test with Bonferroni correction).
Fig. 3.
Fig. 3.
Restoration of DNMT3A expression is associated with remethylation of Dnmt3a−/−-dependent DMRs in bone marrow cells. (A) Global mean methylation of the 8,480 DMRs over time (weeks). Red dots represent Dnmt3a−/− as baseline values, followed by values for samples from mice fed with Dox (i.e., DNMT3A reexpression) for the designated time in weeks. There are two independent datasets for weeks 1, 2, and 4, and one dataset each for weeks 8, 18, and 24. By week 24, DNMT3A reexpression causes near-complete remethylation of these DMRs compared to the methylation levels in Dnmt3a+/+ bone marrow (dark blue dots). (B) Heatmap of mean methylation values from the 8,480 DMRs. The columns are grouped by Dnmt3a−/−, Dnmt3a−/− x WT DNMT3A x rtTA without and with Dox, and Dnmt3a+/+. Low methylation levels in the DMRs from marrow derived from the Dnmt3a−/− x WT DNMT3A x rtTA mice without Dox remain unchanged over time. Time-dependent restoration of methylation across all DMRs is observed in Dnmt3a−/− x WT DNMT3A x rtTA/with Dox, where the 24-wk time point shows near-WT levels of methylation. Quartiles of 2,120 DMRs representing fast (Q1), intermediate (Q2 and Q3), and slow (Q4) remethylating regions are shown on the right. (C and D) Aggregate (mean) methylation at 8,480 DMRs from Dnmt3a+/+ and Dnmt3a−/− samples (n = 3, each). DMRs from Dnmt3a−/− x WT DNMT3A x rtTA bone marrow (C) without Dox and (D) with Dox were plotted passively for the same 8,480 DMRs. In both C and D, DMRs have been scaled to a uniform length, and are shown with the adjacent 5 kb of flanking sequence. Bars represent the span of the scaled DMR regions. (E and F) Aggregate (mean) methylation at 23,294 LMRs. Dnmt3a−/− x WT DNMT3A x rtTA (E) without Dox and (F) with Dox were plotted passively for the same LMRs. In both E and F, LMRs have been scaled to a uniform length and are shown with the adjacent 5 kb of flanking sequence. Bars represent the span of the scaled LMR regions.
Fig. 4.
Fig. 4.
Dnmt3a−/− bone marrow cells have population-restricted DEGs, and a myeloid lineage bias. (A) The t-SNE projections of scRNA-seq data from whole bone marrow cells derived from mice transplanted with Dnmt3a+/+ (n = 2; Left) or Dnmt3a−/− donors (n = 2; Right), and showing known hematopoietic populations based on Haemopedia gene expression profiling (35). (B) Population fractions associated with the scRNA-seq data shown in A; * indicates FDR < 0.05 via Fisher’s exact test with multiple hypothesis correction. (C) Volcano plots showing DEGs in whole bone marrow, PMNs, and macrophage populations (MACs) from Dnmt3a−/− mice (FDR ≤ 0.01, FC ≤ −2, ≥ 2). (D) Heatmaps of normalized (Z-score) expression values for 388 DEGs identified in PMNs (59 up-regulated and 329 down-regulated) and 450 DEGs identified in macrophages (340 up-regulated and 110 down-regulated). Numbers of cells represented in each grouping are shown at the bottom of each heatmap. (E) Methylation difference of each DMR associated with a gene within 5 kb (x axis), plotted against the difference in expression values between Dnmt3a+/+ and Dnmt3a−/− cells (y axis). Inset numbers indicate the fraction of genes in each quadrant. Nearly all DMRs associated with genes are hypomethylated, and the majority of these genes are expressed at lower levels in Dnmt3a−/− cells.
Fig. 5.
Fig. 5.
Dnmt3a−/− progenitors express reduced Irf8. (A) The t-SNE projections of scRNA-seq data from Dnmt3a+/+ (Left) and Dnmt3a−/− (Right) lineage-negative (i.e., depleted for cells expressing B220, CD19, CD11b, Ter119, and/or CD71), c-KIT−positive cells with known populations assigned according to Haemopedia gene expression profiling. (B) Population distributions assigned using the scRNA-seq data shown in A; * indicates FDR < 0.05 via Fisher’s exact test and multiple hypothesis correction. (C) Volcano plot showing DEGs in lineage-negative, c-KIT−positive cells from Dnmt3a−/− mice (FDR ≤ 0.01, fold change ≤ −2, ≥ 2). The values for several transcription factors associated with myelomonocytic lineage determination are shown. (D) Heatmap of normalized (Z-score) expression values for 470 DEGs (280 up-regulated, and 190 down-regulated) identified in lineage-negative, c-KIT−positive cells defined by the comparison of Dnmt3a+/+ vs. Dnmt3a−/−cells. Numbers of cells represented in each grouping are shown at the right of the heatmap. (E) Cells colored red according to levels of Irf8 expression in Dnmt3a+/+ (Left) and Dnmt3a−/− (Right) lineage-negative, c-KIT−positive cells. (F) Mean expression levels (Left) and fractions of cells positive for Irf8 relative to total cells (Right).
Fig. 6.
Fig. 6.
Restoring DNMT3A expression partially corrects myeloid skewing and dysregulated gene expression in Dnmt3a−/− bone marrow cells. (A) The t-SNE projections of scRNA-seq data of whole bone marrow from recipient mice transplanted with Dnmt3a null-3A addback bone marrow and fed normal chow (no Dox), or 10,000 ppm Dox chow (with Dox) for the indicated times. Known populations are annotated according to Haemopedia gene expression profiling. (B) Population percentages identified using the scRNA-seq data from 8 wk (Top) or 22 wk (Bottom) of Dox chow feeding; * indicates FDR < 0.05 via Fisher’s exact test with multiple hypothesis correction. (C) Expression changes in DEGs within 5 kb of a DMR, defined by comparing Dnmt3a+/+ vs. Dnmt3a−/− cells. Plots are split into up-regulated genes (Top) or down-regulated genes (Bottom). Left shows the log fold change difference of each gene in Dnmt3a+/+ vs. Dnmt3a−/− cells. Middle and Right passively plot the expression values for the same sets of DEGs, displaying the effects of feeding Dox for 8 or 22 wk. Yellow lines indicate the median expression value for each set of genes. (D) Identical to C, but displaying DEGs not associated with a DMR. (E) Fraction of GMPs positive for Irf8 expression in Dmnt3a+/+ (blue) vs. Dnmt3a−/− (red) bone marrow cells, identified by scRNA-seq. The expression of Irf8 in GMPs is significantly increased after 8 or 22 wk of feeding Dox chow (red vs. blue bars). (F) Remethylation of differentially methylated CpGs in the Irf8 gene body with Dox feeding (orange line). No remethylation was detected in mice fed with normal chow (blue line).

Similar articles

Cited by

References

    1. Steensma D. P., et al. , Clonal hematopoiesis of indeterminate potential and its distinction from myelodysplastic syndromes. Blood 126, 9–16 (2015). - PMC - PubMed
    1. Jaiswal S., et al. , Age-related clonal hematopoiesis associated with adverse outcomes. N. Engl. J. Med. 371, 2488–2498 (2014). - PMC - PubMed
    1. Xie M., et al. , Age-related mutations associated with clonal hematopoietic expansion and malignancies. Nat. Med. 20, 1472–1478 (2014). - PMC - PubMed
    1. Genovese G., et al. , Clonal hematopoiesis and blood-cancer risk inferred from blood DNA sequence. N. Engl. J. Med. 371, 2477–2487 (2014). - PMC - PubMed
    1. Ley T. J., et al. , DNMT3A mutations in acute myeloid leukemia. N. Engl. J. Med. 363, 2424–2433 (2010). - PMC - PubMed

Publication types

Substances

LinkOut - more resources