. 2020 Jan 29;11(1):583.
doi: 10.1038/s41467-019-13989-3.

Modeling medulloblastoma in vivo and with human cerebellar organoids

Affiliations

Modeling medulloblastoma in vivo and with human cerebellar organoids

Claudio Ballabio et al. Nat Commun. .

Abstract

Medulloblastoma (MB) is the most common malignant brain tumor in children and among the subtypes, Group 3 MB has the worst outcome. Here, we perform an in vivo, patient-specific screen leading to the identification of Otx2 and c-MYC as strong Group 3 MB inducers. We validated our findings in human cerebellar organoids where Otx2/c-MYC give rise to MB-like organoids harboring a DNA methylation signature that clusters with human Group 3 tumors. Furthermore, we show that SMARCA4 is able to reduce Otx2/c-MYC tumorigenic activity in vivo and in human cerebellar organoids while SMARCA4 T910M, a mutant form found in human MB patients, inhibits the wild-type protein function. Finally, treatment with Tazemetostat, a EZH2-specific inhibitor, reduces Otx2/c-MYC tumorigenesis in ex vivo culture and human cerebellar organoids. In conclusion, human cerebellar organoids can be efficiently used to understand the role of genes found altered in cancer patients and represent a reliable tool for developing personalized therapies.


Conflict of interest statement

The authors declare no competing interests.

Figures
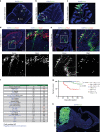
Fig. 1
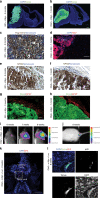
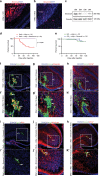
Fig. 1. In vivo transfection of mouse cerebellum with different gene combinations.
ac Confocal images of DAPI staining and GFP immunofluorescence (Venus) of sagittal brain section of CD1 mouse 3 (a), 7 (b), 23 (c) days after transfection with pPBase and pPBVenus at P0. Arrows point to Venus-positive cells. d Confocal images of DAPI staining and immunofluorescence for GFP (Venus) and Sox9 of sagittal brain section of CD1 mouse 7 days after transfection with pPBase and pPBVenus at P0. e Confocal images of DAPI staining and immunofluorescence for GFP (Venus) and Olig2 of sagittal brain section of CD1 mouse 7 days after transfection with pPBase and pPBVenus at P0. The white square in (d, e) marks the region shown at higher magnification. f List of combinations of putative oncogenes and putative oncosuppressors transfected in CD1 mice at P0. Putative oncogenes are reported in blue, putative oncosuppressors are reported in black. The number of mice displaying abnormal clusters and tumors are reported. g Kaplan–Meier survival curve of mice injected at P0 with different gene combinations. h DAPI staining and GFP immunofluorescence (Venus) of sagittal brain section of CD1 mouse 3 months after transfection with pPBase + pPBMyc + pPBGfi1 + pPBVenus at P0. Scale bars 250 µm (a), 500 µm (b, c), 100 µm in (d, e), 1 mm in (h).
Fig. 2
Fig. 2. In vivo transfection of cerebellar cells with Gfi1/c-MYC and Otx2/c-MYC induces Group 3 MB.
a DAPI staining and GFP immunofluorescence of CD1 mouse brain section 3 months after transfection with pPBase + pPBMyc + pPBGfi1 + pPBVenus at P0. b DAPI and GFP immunofluorescence of CD1 mouse brain section 1 month after transfection with pPBase + pPBMyc + pPBOtx2 + pPBVenus at P0. c Hematoxylin and Flag (Gfi1) immunohistochemistry of CD1 mouse tumors after transfection with pPBase + pPBMyc + pPBGfi1 + pPBVenus at P0. d DAPI and Otx2 immunofluorescence of CD1 mouse brain section 1 month after transfection with pPBase + pPBMyc + pPBOtx2 + pPBVenus at P0. e, f Hematoxylin and NPR3 immunohistochemistry of CD1 mice tumors after transfection with pPBase + pPBMyc + pPBGfi1 + pPBVenus at P0 (e) and with pPBase + pPBMyc + pPBOtx2 + pPBVenus at P0 (f). g, h GFP and GFAP immunofluorescence of tumors in CD1 mice after transfection with pPBase + pPBMyc + pPBGfi1 + pPBVenus at P0 (g) and with pPBase + pPBMyc + pPBOtx2 + pPBVenus at P0 (h). i In vivo bioluminescent imaging of the upper body of a CD1 mouse transfected with pPBase + pPBMyc + pPBOtx2 + pPBVenus at P0, with a plasmid encoding firefly luciferase (pPBLuc). Imaging was performed weekly from the sixth week after transfection. j In vivo bioluminescent imaging of the lumbosacral region of a CD1 mouse 8 weeks after transfection with pPBase + pPBMyc + pPBOtx2 + pPBVenus + pPBLuc at P0. The luminescence signal is expressed in photons/sec/mm2. k DAPI and immunofluorescence for pH3 of transversal section of the sacral portion of the spine of a CD1 mouse 8 weeks after transfection with pPBase + pPBMyc + pPBOtx2 + pPBVenus + pPBLuc at P0. l DAPI and immunofluorescence for GFP and pH3 of sacral transversal section of the spine of a CD1 mouse 8 weeks after transfection with pPBase + pPBMyc + pPBOtx2 + pPBVenus + pPBLuc at P0. l is the higher magnification of the white square in (k). Scale bars 1 mm in (a, b), 100 µm in (ch), 500 µm in (k).
Fig. 3
Fig. 3. SMARCA4 represses Otx2/c-MYC induced Group 3 medulloblastoma.
a DAPI staining and Smarca4 immunofluorescence of sagittal brain tumor section of CD1 mouse 3 months after transfection with pPBase + pPBMyc + pPBGfi1 + pPBVenus at P0. b DAPI staining and Smarca4 immunofluorescence of sagittal brain tumor section of CD1 mouse 1 month after transfection with pPBase + pPBMyc + pPBOtx2 + pPBVenus at P0. c Western blot of brain tumors of CD1 mice after transfection with pPBase + pPBMyc + pPBGfi1 + pPBVenus (GM) and pPBase + pPBMyc + pPBOtx2 + pPBVenus (OM). d Kaplan–Meier survival curve of mice injected at P0 with Otx2 + c-Myc and Otx2 + c-Myc + Smarca4. e Kaplan–Meier survival curve of mice injected at P0 with Gfi1 + c-Myc and Gfi1 + c-Myc + Smarca4. fh Confocal images of GFP (Venus) and Ki67 (f), β3-tubulin (g), GFAP (h) immunofluorescence of transfected cell clusters in CD1 mouse 10 days after transfection with pPBase + pPBMyc + pPBOtx2 + pPBVenus at P0. The white squares in (f, g, h) mark the region shown at higher magnification in (f’, g’, h’). ik Confocal images of GFP (Venus) and Ki67 (i), β3-tubulin (j), GFAP (k) immunofluorescence of transfected cell clusters in CD1 mouse 10 days after transfection with pPBase + pPBMyc + pPBOtx2 + pPBSmarca4 + pPBVenus at P0. The white squares in (i, j, k) mark the region shown at higher magnification in (i’, j’, k’). Arrows point to double-positive cells. Scale bars 100 µm.
Fig. 4
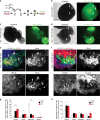
Fig. 4. Cerebellar organoids electroporation with Gfi1/c-MYC and Otx2/c-MYC induces overproliferation.
a Schematic representation of organoids electroporation. b Brightfield and fluorescence images of cerebellar organoids at day 60 electroporated at day 35 with pPBVenus. c Brightfield and fluorescence images of cerebellar organoids at day 60 electroporated at day 35 with pPBase + pPBMyc + pPBGfi1 + pPBVenus. d Brightfield and fluorescence images of cerebellar organoids at day 60 electroporated at day 35 with pPBase + pPBMyc + pPBOtx2 + pPBVenus. Arrows in (b, c, d) indicate Venus-positive cells. e Confocal images of GFP (Venus) and PCNA immunofluorescence of cerebellar organoids at day 60 electroporated at day 35 with pPBase + pPBVenus + pPBMyc and pPBOtx2. Arrows indicate double-positive cells. f Confocal images of GFP (Venus) and β3-tubulin immunofluorescence of cerebellar organoids at day 60 electroporated at day 35 with pPBase + pPBMyc + pPBOtx2 + pPBVenus. Arrows indicate β3-tubulin-negative cells. g Quantification of cerebellar organoids at day 60, electroporated at day 35 with either pPBVenus or pPBase + pPBMyc + pPBOtx2 + pPBVenus (OM) or pPBase + pPBMyc + pPBGfi1 + pPBVenus (GM). n = 6 biologically independent organoids. h Quantification of cerebellar organoids at day 40, electroporated at day 35 with either pPBVenus or pPBase + pPBMyc + pPBOtx2 + pPBVenus (OM) or pPBase + pPBMyc + pPBGfi1 + pPBVenus (GM). n = 6 biologically independent organoids. Error bars in (g, e) represent standard error of the mean. Scale bars 250 µm in (bd),100 µm in (e, f). Paired Student's t test, two tails. *p-value < 0.05, **p-value < 0.01. ***p-value < 0.001.
Fig. 5
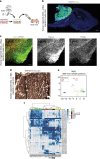
Fig. 5. Cerebellar organoids electroporation with Otx2/c-MYC induces Group 3 MB in vivo.
a Schematic representation of in vivo injection of modified cerebellar organoids. b DAPI staining and GFP immunofluorescence (Venus) of the sagittal brain section of nude mouse 1 month after injection of human cerebellar organoids electroporated with pPBase + pPBMyc + pPBOtx2 + pPBVenus. c Confocal images of GFP (Venus) and PCNA immunofluorescence of tumors in nude mouse 1 month after injection of human cerebellar organoids electroporated with pPBase + pPBMyc + pPBOtx2 + pPBVenus. d NPR3 immunohistochemistry and Hematoxylin staining of tumor in nude mouse 1 month after injection of human cerebellar organoids electroporated with pPBase + pPBMyc + pPBOtx2 + pPBVenus. e MDS (multidimensional scaling) analysis performed on the 1000 most variable probes of the whole-genome DNA methylation data shows a close similarity between organoids and group 3 MBs. Color legend of the MDS plot as follows: OM Organoids (Organoids_OM, black); GM Organoids (Organoids_GM, gray); WNT, Wingless MB (blue); SHH-A, Sonic Hedgehog MB-adulthood and childhood (red); SHH-B Sonic Hedgehog MB infant (dark red); G3, Group 3 MB (yellow); G4, Group 4 MB (green). f Hierarchical clustering and heatmap of beta values relative to the 39 high-quality CpG islands better discriminating MB subgroup in the Hovestadt set (Hovestadt et al.). The heatmap shows normalized methylation levels in organoid samples and MB samples. Clusters were obtained by means of Ward’s minimum variance method, using the Euclidean distance. Color legend: OM Organoids (Organoids_OM, black); GM Organoids (Organoids_ GM, gray); WNT, Wingless MB (blue); SHH-A, Sonic Hedgehog MB-adulthood and childhood (red); SHH-B Sonic Hedgehog MB infant (dark red); G3, Group 3 MB (yellow); G4, Group 4 MB (green). Scale bars 1 mm in (b), 100 µm in (c, d).
Fig. 6
Fig. 6. Mutant SMARCA4 represses wild-type SMARCA4 functions.
a mRNA expression analysis of human cerebellar progenitors (AF22 cells) 72 h after nucleofecion with pPBase + pPBVenus (V), pPBase + pPBMyc + pPBOtx2 + pPBVenus (OM), pPBase + pPBMyc + pPBOtx2 + pPBSmarca4wt + pPBVenus (OM + S). b, c qRT-PCR analysis of human cerebellar progenitors (AF22 cells) 72 h after nucleofecion with pPBase + pPBVenus (V), pPBase + pPBMyc + pPBOtx2 + pPBVenus (OM), pPBase + pPBMyc + pPBOtx2 + pPBSmarca4wt + pPBVenus (OM + S), pPBase + pPBMyc + pPBOtx2 + pPBSmarca4wt + pPBSmarca4 T910M + pPBVenus (OM + S + ST910M). d Western blot analysis of human cerebellar progenitors (AF22 cells) 72 h after nucleofecion with pPBase + pPBMyc + pPBOtx2 + pPBVenus + pSCV2shCTRL (OM + shRNACTRL), pPBase + pPBMyc + pPBOtx2 + pSCV2shSMARCA4 (OM + shRNASMARCA4). e qRT-PCR analysis of human cerebellar progenitors (AF22 cells) electroporated with pPBase + pPBMyc + pPBOtx2 + pPBVenus + pSCV2shCTRL (OM + shRNACTRL), pPBase + pPBMyc + pPBOtx2 + pSCV2shSMARCA4(OM + shRNASMARCA4). f NPR3 immunohistochemistry and hematoxylin staining of tumors in CD1 mice after transfection with pPBase + pPBMyc + pPBOtx2 + pPBSmarca4wt + pPBSmarca4 T910M + pPBVenus (OM + S + ST910M). g Histograms show the percentage of mice that develop MB (3 months) after transfection at P0 with either OM, OM + S or OM + S + ST910M. h Quantification of cerebellar organoids GFP + /PCNA + cells at day 40 electroporated at day 35 with PBase + pPBVenus (V), pPBase + pPBMyc + pPBOtx2 + pPBVenus (OM), pPBase + pPBMyc + pPBOtx2 + pPBSmarca4wt + pPBVenus (OM + S), pPBase + pPBMyc + pPBOtx2 + pPBSmarca4wt + pPBSmarca4 T910M + pPBVenus (OM + S + ST910M). a, b, c At least n = 3 biologically independent experiments. e n = 2 biologically independent experiments. h n = 6–11 biologically independent organoids. Error bars in (a, b, c, e, h) represent standard error of the mean. Paired Student's t test, one tail (a, b, c, e), two tails (h). *p-value < 0.05, **p-value < 0.01. ***p-value < 0.001. ****p-value < 0.0001. Chi-square test (g). Scale bar 100 µm in (f).
Fig. 7
Fig. 7. EZH2 inhibition with Tazemetostat increases cell death of OM-derived tumor spheroids and in MB organoids.
a Histograms show FACS analysis of OM-induced tumor spheroids cell death (late and early apoptosis) after 1 day of drug treatment (DMSO, Tazemetostat, GSK-126). b Histograms show FACS analysis of OM-induced tumor spheroids (cell cycle analysis) after 1 day of drug treatment (DMSO, Tazemetostat, GSK-126). c Histograms show FACS analysis of OM-induced tumor spheroids cell death (late and early apoptosis) after 3 days of drug treatment (DMSO, Tazemetostat, GSK-126). d Representative FACS analysis of OM-induced tumor spheroids cell death (late and early apoptosis) after 3 days of drug treatment (DMSO, Tazemetostat, GSK-126). e Histograms show FACS analysis of OM-induced tumor spheroids (cell cycle analysis) after 3 days of drug treatment (DMSO, Tazemetostat, GSK-126). f Representative FACS analysis of OM-induced tumor spheroids (cell cycle analysis) after 3 days of drug treatment (DMSO, Tazemetostat, GSK-126. g Quantification of cerebellar organoids at day 41, electroporated at day 35 with pPBase + pPBMyc + pPBOtx2 + pPBVenus (OM), and treated for 5 days with either DMSO or Tazemetostat or GSK-126. Percentage of active caspase-3-positive cells between Venus-positive cells. h Quantification of cerebellar organoids cells at day 41, electroporated at day 35 with pPBase + pPBMyc + pPBOtx2 + pPBVenus (OM), and treated for 5 days with either DMSO or Tazemetostat or GSK-126. Percentage of PCNA-positive cells between Venus-positive cells. a n = 2 biologically independent experiments. (b, c, e) n = 5 biologically independent experiments. g, h n = 5–11 biologically independent organoids. Error bars in (a, b, c, e) represent standard deviation, error bars in (g, h) represent standard error of the mean. Paired Student's t test, two tails. *p-value < 0.05, **p-value < 0.01.

Similar articles

Cited by

References

    1. Rutkowski S, et al. Survival and prognostic factors of early childhood medulloblastoma: an international meta-analysis. J. Clin. Oncol. 2010;28:4961–4968. doi: 10.1200/JCO.2010.30.2299. - DOI - PubMed
    1. Northcott PA, et al. Medulloblastomics: the end of the beginning. Nat. Rev. Cancer. 2012;12:818–834. doi: 10.1038/nrc3410. - DOI - PMC - PubMed
    1. Jones DTW, et al. Dissecting the genomic complexity underlying medulloblastoma. Nature. 2012;488:100–105. doi: 10.1038/nature11284. - DOI - PMC - PubMed
    1. Northcott PA, et al. Subgroup-specific structural variation across 1,000 medulloblastoma genomes. Nature. 2012;487:49–56. doi: 10.1038/nature11327. - DOI - PMC - PubMed
    1. Parsons DW, et al. The genetic landscape of the childhood cancer medulloblastoma. Science. 2011;331:435–439. doi: 10.1126/science.1198056. - DOI - PMC - PubMed

MeSH terms