. 2020 Jan 29;11(1):569.
doi: 10.1038/s41467-020-14282-4.

Disappearance of superconductivity due to vanishing coupling in the overdoped Bi 2 Sr 2 CaCu 2 O 8 + δ

Affiliations

Disappearance of superconductivity due to vanishing coupling in the overdoped Bi 2 Sr 2 CaCu 2 O 8 + δ

T Valla et al. Nat Commun. .

Abstract

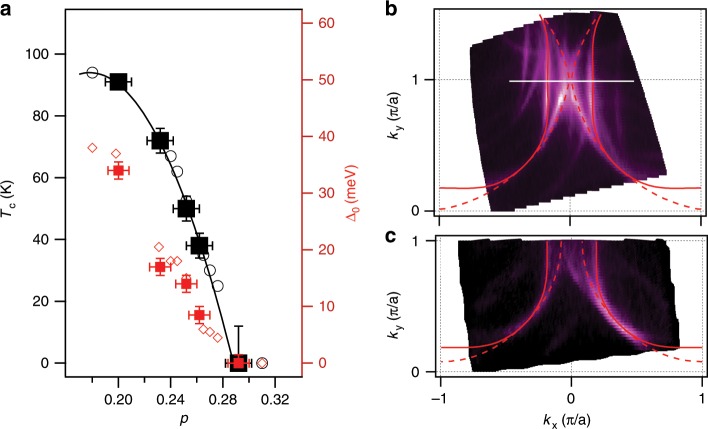
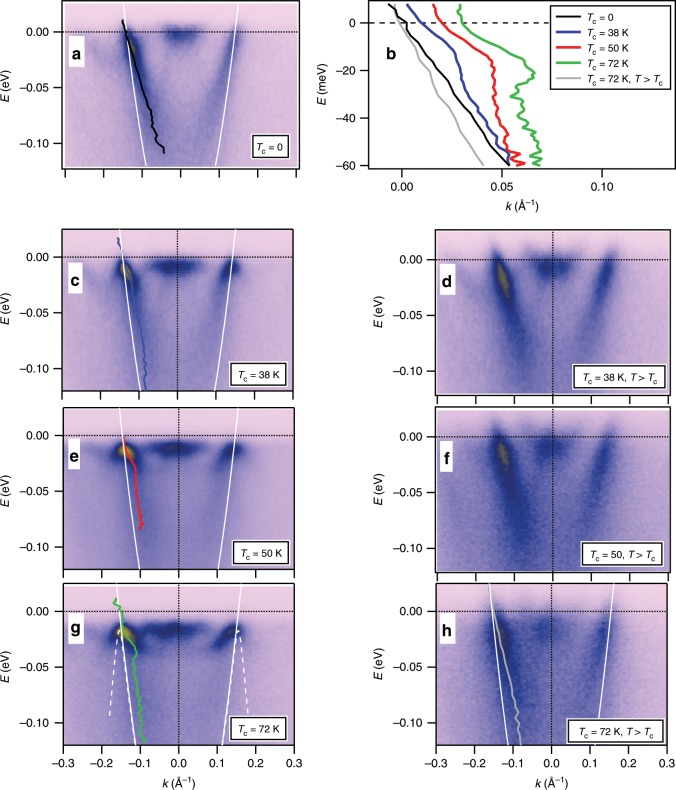
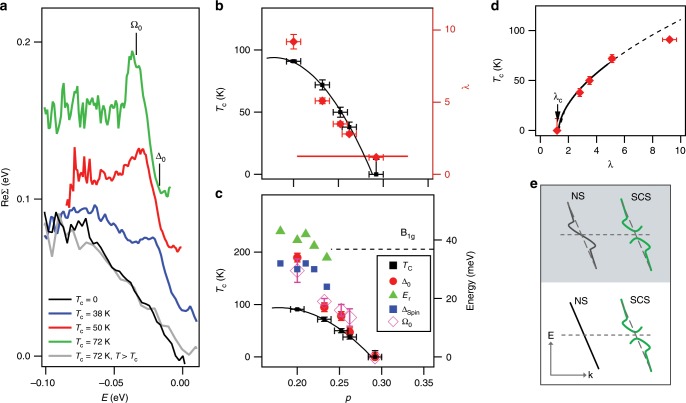
In cuprate superconductors, superconductivity is accompanied by a plethora of orders and phenomena that complicate our understanding of superconductivity in these materials. Prominent in the underdoped regime, these orders weaken or vanish with overdoping. Here, we approach the superconducting phase from the more conventional overdoped side. We present angle-resolved photoemission spectroscopy studies of Bi 2 Sr 2 CaCu 2 O 8 + δ , cleaved and annealed in ozone to increase the doping all the way to the non-superconducting phase. We show that the mass renormalization in the antinodal region of the Fermi surface that possibly reflects the pairing, weakens with doping and completely disappears precisely where superconductivity disappears. This is the evidence that in the overdoped regime, superconductivity is determined primarily by the coupling strength. A doping dependence and an abrupt disappearance above the transition temperature eliminate phononic mechanism of the observed renormalization and identify the onset of spin-fluctuations as its likely origin.


Conflict of interest statement

The authors declare no competing interests.

Figures

Fig. 1
Fig. 1. Strongly overdoped regime of Bi2Sr2CaCu2O8+δ.
a Phase diagram near the edge of the superconducting dome, as determined from ref. . Tc and Δ0 for the doping levels from this study are indicated by the black and red solid squares, respectively. b Fermi surface (E=0 contour) of the overdoped, non-superconducting sample, corresponding to p=0.29 and c of the Tc=72 K sample, corresponding to p=0.23. Maps in b and c were recorded at T = 12 K. The uncertainty in doping, Δp, (horizontal error bars in a) is approximated to be proportional to the width of the Fermi surface: Δpp~2ΔkFkF. The uncertainty in Tc is given by the temperature step size in T-dependent ARPES measurements that identify Tc. The uncertainty in gap magnitude corresponds to the standard deviation of the quasiparticle peak position determined from fitting.
Fig. 2
Fig. 2. Coupling strength in the overdoped Bi2212 as a function of doping.
a Electronic structure of Bi2212 near the antinode along the momentum line indicated in Fig. 1b at low temperature (T~10 K) for overdoped, non-superconducting sample. The spectra corresponding to the three overdoped superconducting samples with Tc=38 K, Tc=50 K, and Tc=72 K taken in the superconducting state (c, e, g) and normal state (d, f, h). The MDC-fitted dispersions of the bonding state are indicated by the black, blue, red, green, and gray curves. The TB dispersions are indicated by the solid white curves. The dashed white curve in g represents the TB dispersion gapped by Δ0=17 meV. b The same measured dispersions, referenced to the corresponding gap value. The momentum scale is referenced to kF. The dispersions corresponding to superconducting states are offset in k by 0.01 Å1, consecutively. Spectra in c, e, and g were recorded at T=12 K and those in d, f, and h at 45, 60, and 90 K, respectively.
Fig. 3
Fig. 3. Doping dependence of the antinodal renormalization effects.
a ReΣ for four samples shown in Fig. 2. The curves are referenced to the Fermi level and those obtained in superconducting state are offset in y by 30 meV for clarity. b coupling strength λ, approximated as λ=ReΣ(ω)ω(Ω0<ω<Δ0) (red diamonds), plotted vs. doping. The normal state value, λc1.3, is indicated by the red line. Corresponding Tc is also shown (black squares). c Kink’s energy, Ω0, as measured from the corresponding gap value (energy of the maximum in the state's dispersion) (magenta diamonds). Ω0 of the as-grown sample is determined as described in the Methods section. Corresponding gap magnitude, Δ0 (red circles) of the studied samples and antiferromagnetic resonance energy, Er (green triangles), and spin gap, ΔSpin (blue squares), from refs. are also shown. The energy of B1g phonon is indicated by the dashed line. Tc is referenced to the left-hand axis, while all the other quantities are referenced to the right-hand axis. d Dependence of Tc on the antinodal coupling strength, λ, measured in the superconducting state. The solid curve represents the fit to the power-law behavior, Tc(λλc)p for the four overdoped samples. The dashed curve is the extrapolation from the fitted region. The as-grown sample was not used in fitting. e Schematic view of temperature development of the electronic dispersion upon transition from the normal state (NS) to superconducting state (SCS) in the conventional coupling scenario (top, shaded) and the actual one, observed in cuprate superconductors (bottom). The uncertainties in p, Tc, and Δ0 are the same as in Fig. 1a. The uncertainty in λ in b and d is the standard deviation of the slope obtained from the linear fit of low-energy ReΣ. The uncertainty in Ω0 in c corresponds to the standard deviation of the peak position in ReΣ determined from fitting, except for the as-grown sample (see the Methods section).
Fig. 4
Fig. 4. As grown Bi2212 sample (Tc = 91 K).
a Electronic structure near the antinode along the momentum line indicated in Fig. 1b at low temperature (T~12 K) for the as-grown Bi2212 sample. The MDC-fitted dispersions of the bonding state is indicated by the blue curve. The TB dispersion is indicated by the solid red curve. The dashed red curve represents the TB dispersion gapped by Δ0=34 meV. b The energy distribution curves corresponding to the kF (black) and the momentum indicated by the red vertical arrow in a. The horizontal black arrow indicates the dip in the intensity.

References

    1. McMillan WL, Rowell JM. Lead phonon spectrum calculated from superconducting density of states. Phys. Rev. Lett. 1965;14:108. doi: 10.1103/PhysRevLett.14.108. - DOI
    1. Valla T, et al. Evidence for quantum critical behavior in the optimally doped cuprate Bi2Sr2CaCu2O8+ Science. 1999;285:2110–2113. doi: 10.1126/science.285.5436.2110. - DOI - PubMed
    1. Johnson P, et al. Doping and temperature dependence of the mass enhancement observed in the cuprate Bi2Sr2CaCu2O8+δ. Phys. Rev. Lett. 2001;87:177007. doi: 10.1103/PhysRevLett.87.177007. - DOI - PubMed
    1. Gromko AD, et al. Mass-renormalized electronic excitations at (π, 0) in the superconducting state of Bi 2 Sr 2 CaCu 2 O 8 + π. Phys. Rev. B. 2003;68:174520. doi: 10.1103/PhysRevB.68.174520. - DOI
    1. Carbotte JP, Timusk T, Hwang J. Bosons in high-temperature superconductors: an experimental survey. Rep. Prog. Phys. 2011;74:066501. doi: 10.1088/0034-4885/74/6/066501. - DOI