. 2020 Jan 29;11(1):575.
doi: 10.1038/s41467-020-14430-w.

mTORC2-AKT signaling to ATP-citrate lyase drives brown adipogenesis and de novo lipogenesis

Affiliations

mTORC2-AKT signaling to ATP-citrate lyase drives brown adipogenesis and de novo lipogenesis

C Martinez Calejman et al. Nat Commun. .

Erratum in

Abstract

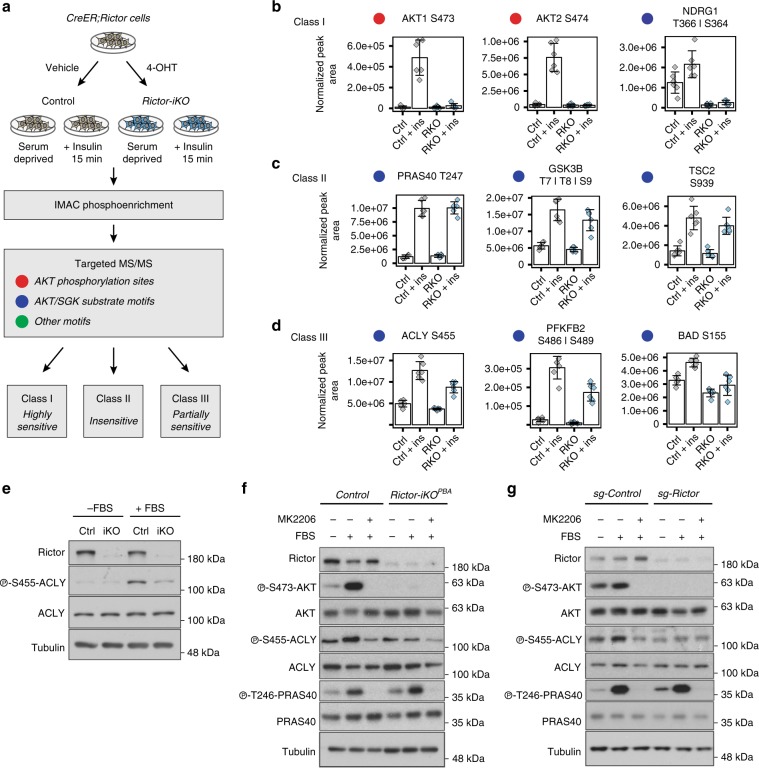
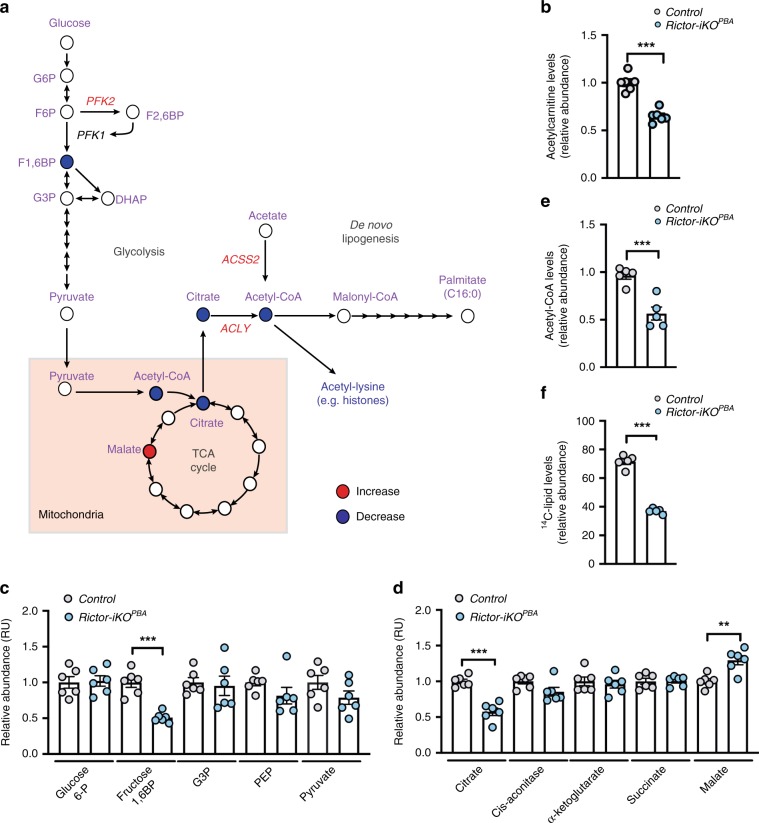
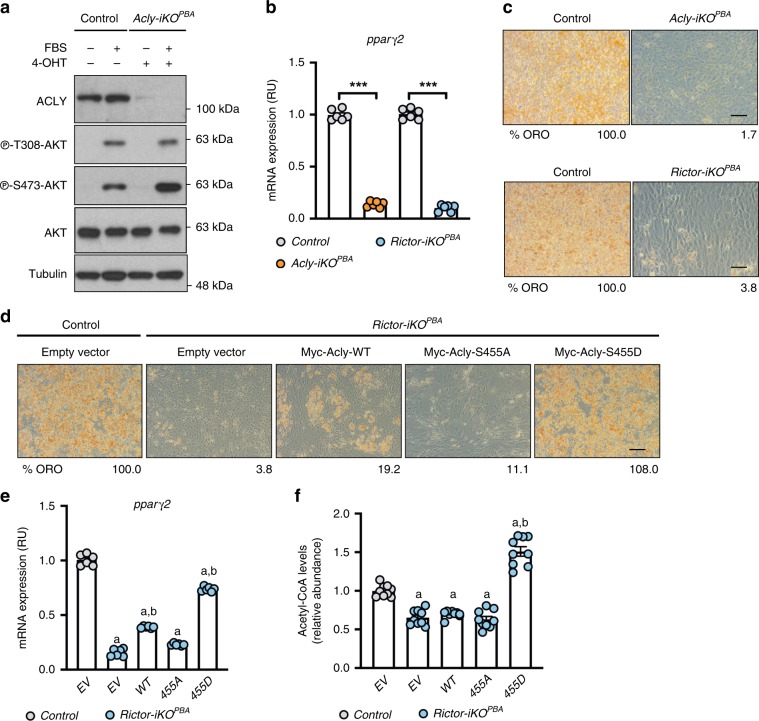
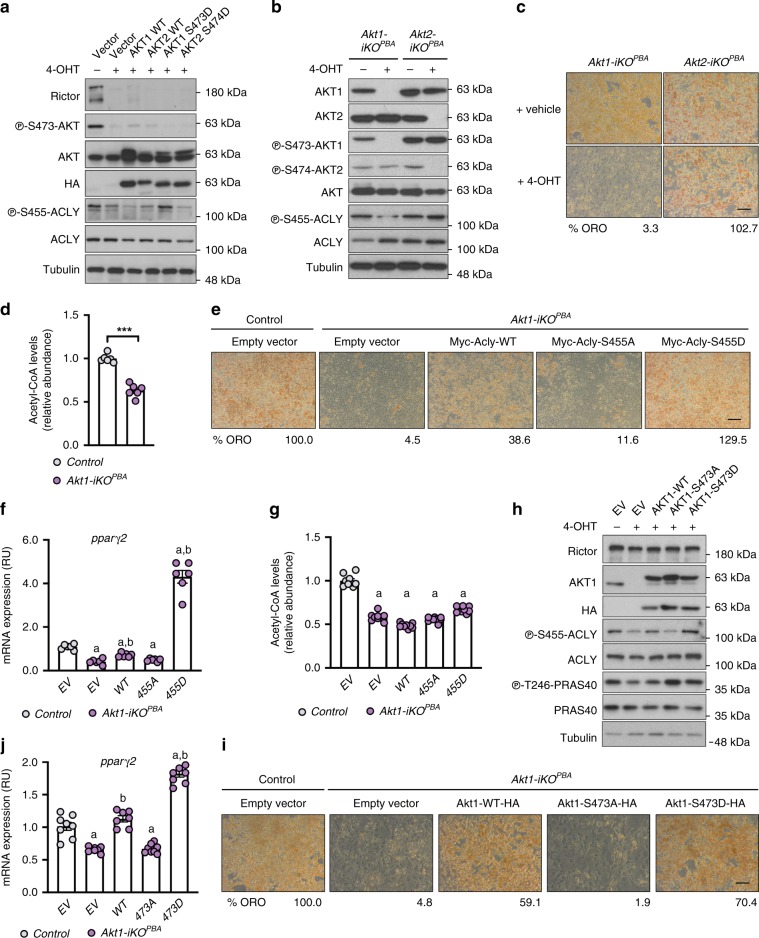
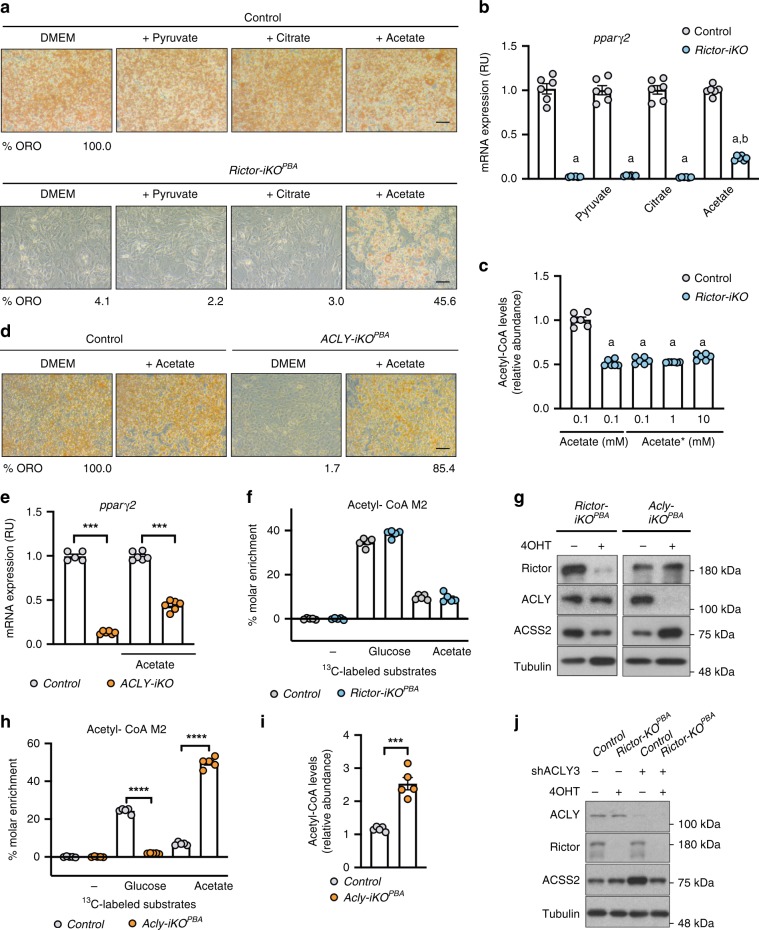
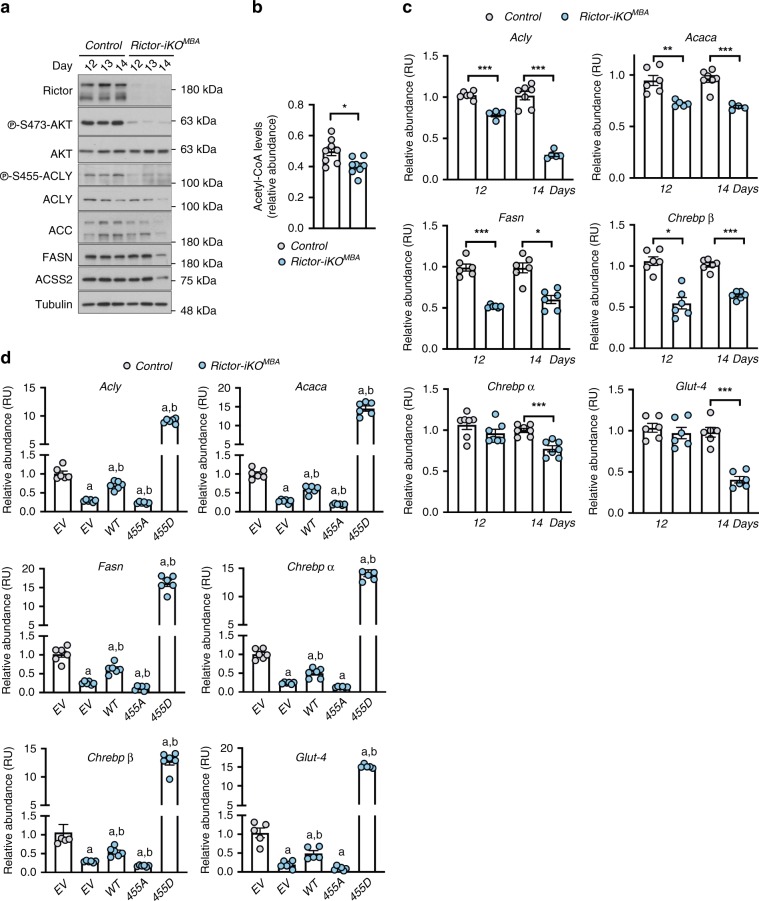
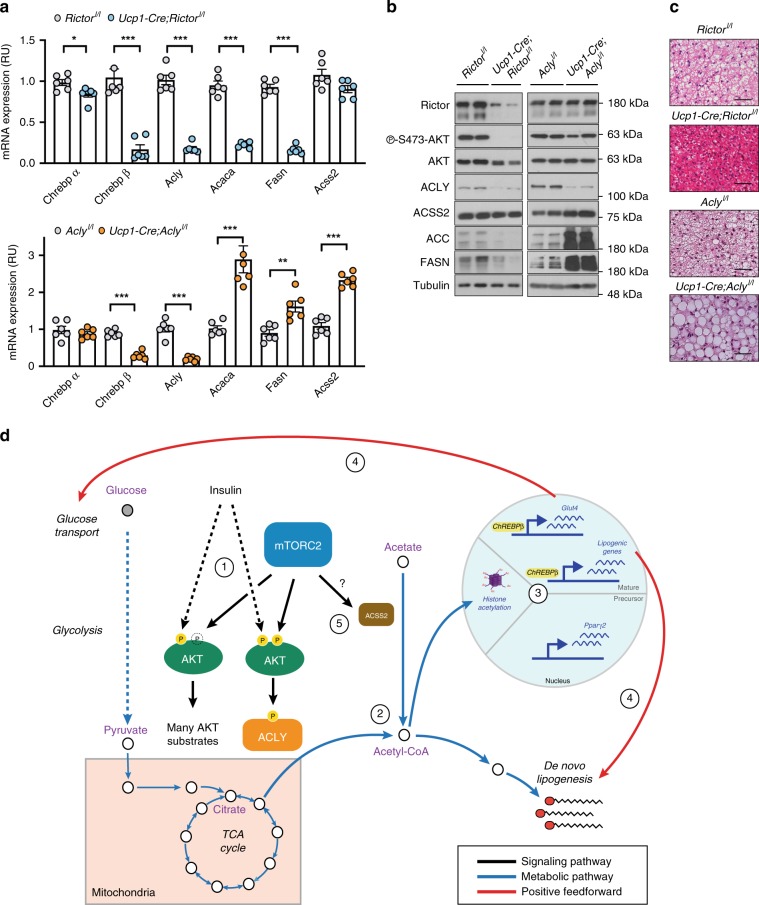
mTORC2 phosphorylates AKT in a hydrophobic motif site that is a biomarker of insulin sensitivity. In brown adipocytes, mTORC2 regulates glucose and lipid metabolism, however the mechanism has been unclear because downstream AKT signaling appears unaffected by mTORC2 loss. Here, by applying immunoblotting, targeted phosphoproteomics and metabolite profiling, we identify ATP-citrate lyase (ACLY) as a distinctly mTORC2-sensitive AKT substrate in brown preadipocytes. mTORC2 appears dispensable for most other AKT actions examined, indicating a previously unappreciated selectivity in mTORC2-AKT signaling. Rescue experiments suggest brown preadipocytes require the mTORC2/AKT/ACLY pathway to induce PPAR-gamma and establish the epigenetic landscape during differentiation. Evidence in mature brown adipocytes also suggests mTORC2 acts through ACLY to increase carbohydrate response element binding protein (ChREBP) activity, histone acetylation, and gluco-lipogenic gene expression. Substrate utilization studies additionally implicate mTORC2 in promoting acetyl-CoA synthesis from acetate through acetyl-CoA synthetase 2 (ACSS2). These data suggest that a principal mTORC2 action is controlling nuclear-cytoplasmic acetyl-CoA synthesis.


Conflict of interest statement

The authors declare no competing interests.

Figures

Fig. 1
Fig. 1. Identification of mTORC2-sensitive phosphorylation sites, including S455 in ATP citrate lyase (ACLY).
a Phosphoproteomics work flow and analysis in Rictor-iKOPBAs. Colored circles correspond with the type of motifs analyzed (n = 6 per group). b, c Motifs were stratified by their sensitivity to mTORC2 loss as being highly sensitive Class I sites (b), insensitive Class II sites (c), or partially sensitive Class III sites (d). e Western blots of protein lysates from control and Rictor-iKOPBA cells using the indicated total and phospho-specific antibodies. Cells growing in DMEM were either serum deprived (−FBS) or serum deprived and then stimulated with fresh serum for 15 min (+FBS) prior to lysis. f Western blots of protein lysates treated as in e with or without the AKT inhibitor MK2206. g Western blots using lysates from HEK293 cells in which Rictor was deleted by CRISPR/Cas9 genome editing. The AKT inhibitor MK2206 (10 μM) was administered 1 h prior to lysis in both f and g.
Fig. 2
Fig. 2. mTORC2 regulates acetyl-CoA levels and glucose-dependent fatty acid synthesis.
a Schematic of metabolic pathways and individual metabolites regulated by mTORC2. Blue-filled circles correspond to metabolites that significantly decrease in abundance in Rictor-iKOPBA cells; red-filled circles indicate a significant increase in abundance. Enzymes labeled in red are those identified in this study as being regulated by mTORC2. b, c Bar graph representations showing the average relative abundance of acetylcarnitine (b), glycolytic (c), and TCA cycle (d) intermediates (n = 6 per group). e Direct acetyl-CoA measurements using control and Rictor-iKOPBA cells (n = 5 per group). f De novo lipogenesis assay measuring D-[U-14C]-glucose labeling of de novo synthesized lipids (n = 5 per group). Bar graphs represent mean ± SEM. **p < 0.01 and ***p < 0.001. Statistical significance was calculated by using two-tailed unpaired Student’s t test (b, e, f) or two-way ANOVA with Sidak’s test multiple comparisons (c, d).
Fig. 3
Fig. 3. ACLY is the critical mTORC2 effector during brown adipocyte differentiation.
a Western blot showing ablation of ACLY protein and AKT phosphorylation upon brief 4-OHT treatment of Acly-iKOPBA cells. b, c Acly-iKOPBA and Rictor-iKOPBA cells were differentiated and pparγ2 mRNA expression (n = 6 per group) (b) and Oil Red O (ORO) staining of lipids (c) were quantified at day 10 to determine differentiation efficiency. Scale bar represents 50 μm. d, e Representative differentiation rescue experiments showing ORO staining (d) and Pparγ2 mRNA expression (n = 6 per group) (e) in Rictor-iKOPBA cells stably expressing empty (EV), Myc-ACLY-WT, Myc-ACLY-S455A, or Myc-ACLY-455D constructs. Percentage of ORO in d is relative to empty vector control. Scale bar represents 50 μm. f Direct acetyl-CoA measurements of Rictor-iKOPBA cells (n = 9 per group) stably expressing empty (EV), Myc-ACLY-WT, Myc-ACLY-S455A, or Myc-ACLY-455D constructs. Bar graphs represent mean ± SEM. ***p < 0.001. a represents ***p < 0.001 vs control (EV), and b represents ***p < 0.001 vs Rictor-iKOPBA (EV). Statistical significance was calculated by using two-way ANOVA with Sidak’s test multiple comparisons (b, e, f).
Fig. 4
Fig. 4. AKT1 HM phosphorylation is necessary for ACLY stimulation and differentiation, while ACLY-S455D is sufficient to rescue acetyl-CoA levels and differentiation upon Rictor loss.
a Rictor-iKOPBAs cells were stably transfected with the indicated HA-tagged AKT constructs, which were tested for their ability to rescue ACLY-S455 phosphorylation by western blot. b, c Western blot (b) and ORO (c) of Akt1-iKOPBAs and Akt2-iKOPBAs cells. Scale bar represents 50 μm. d Direct acetyl-CoA measurements of Akt1-iKOPBAs cells (n = 6 per group). e, f Representative differentiation rescue experiments showing ORO staining (e) and pparγ expression (n = 6 per group) (f) in Akt1-iKO cells stably expressing empty (EV), Myc-ACLY-WT, Myc-ACLY-S455A, or Myc-ACLY-455D constructs. Scale bar represents 50 μm. g Direct acetyl-CoA measurements of Akt1-iKOPBA cells (n = 9) stably transfected with the indicated Myc-tagged ACLY constructs. hj Western blot (h), pparγ expression (n = 7–8 per group) (i), and ORO staining (j) of Akt1-iKOPBA stably expressing empty (EV), HA-AKT1-WT, HA-AKT1-S473A, or HA-AKT1-473D constructs. Scale bar represents 50 μm. Bar graphs represent mean ± SEM. ***p < 0.001, a represents ***p < 0.001 vs control (EV), and b represents ***p < 0.001 vs Akt1-iKOPBA (EV). Statistical significance was calculated by using two-tailed unpaired Student’s t test (d) or two-way ANOVA with Sidak’s test multiple comparisons (f, g, i).
Fig. 5
Fig. 5. mTORC2 also regulates acetyl-CoA synthesis from acetate.
a, b Isogenic control and Rictor-iKO brown preadipocytes were supplemented with the indicated metabolites during differentiation and Oil Red O (ORO) staining of lipids (a) and pparγ2 mRNA expression (n = 6 per group) (b) were quantified as indicators of differentiation efficiency. Percentage of ORO is relative to control in DMEM. Scale bar represents 50 μm. c Direct acetyl-CoA levels in control and Rictor-iKOPBA cells (n = 6 per group) supplemented with unlabeled acetate (0.1 mM) or increasing [1,2-13C] acetate concentration. d, e Acly-iKOPBA cells were differentiated with or without acetate supplementation followed by Oil Red O (ORO) staining (d) and pparγ2 mRNA expression (n = 6 per group) (e) analysis. Scale bar represents 50 μm. f M2 isotopic tracer labeling of total acetyl-CoA levels in Rictor-iKOPBA cells (n = 5 per group) that were serum deprived for 12 h and then incubated for 1 h with fresh glucose-free DMEM supplemented with 5 mM of labeled [U-13C] glucose and 100 μM of unlabeled acetate or unlabeled glucose and 100 μM of [1,2-13C] acetate, at 37 °C for 1 h. g Western blot showing total ACSS2 protein expression in Rictor-iKOPBA and Acly-iKOPBA cells. h M2 isotopic tracer labeling of total acetyl-CoA levels in Acly-iKOPBA cells (n = 5) as described in f. i Direct acetyl-CoA levels in control and Acly-iKOPBA cells (n = 5 per group). j Control and Rictor-iKO cells were stably transfected with control (scrambled-shRNA) or an shRNA targeting ACLY. Knockdown efficiency and effects on ACSS2 expression were confirmed by western blot. Bar graphs represent mean ± SEM. ***p < 0.001, ****p < 0.0001, a represents ***p < 0.001 vs control (EV), and b represents ***p < 0.001 vs Rictor-iKOPBA (EV) cells. Statistical significance was calculated by using two-way ANOVA with Sidak’s test multiple comparisons (b, c, e, f, h) or two-tailed unpaired Student’s t test (i).
Fig. 6
Fig. 6. mTORC2 drives lipogenic and Glut4 gene expression through ACLY in mature brown adipocytes.
a Time-course western blots showing the indicated phospho-specific and total proteins in Rictor-iKOMBA or Acly-iKOMBA cells following acute and prolonged protein loss. b Direct acetyl-CoA measurements in Rictor-iKOMBA cells following acute Rictor loss (day 12) (n = 8 per group). c qRT-PCR analysis of the indicated genes following acute (day 12) and prolonged (day 14) Rictor loss (n = 6 per group). Rictor deletion was induced at day 8 during differentiation. d qRT-PCR analysis of the indicated genes Rictor-iKOMBA (n = 6 per group) stably expressing empty (EV), Myc-ACLY-WT, Myc-ACLY-S455A, or Myc-ACLY-455D constructs. Bar graphs represent mean ± SEM. *p < 0.05, **p < 0.01, ***p < 0.001, a represents ***p < 0.001 vs control (EV), and b represents ***p < 0.001 vs Rictor-iKOMBA (EV) cells. Statistical significance was calculated by using two-tailed unpaired Student’s t test (b) or two-way ANOVA with Sidak’s test multiple comparisons (c, d).
Fig. 7
Fig. 7. In vivo, mTORC2 and ACLY both promote ChREBPβ expression, but their loss has opposite effects on ACC and FASN expression that correlates with differential ACSS2 regulation.
a qRT-PCR analysis of the indicated genes in brown fat tissue isolated from control (Rictorl/l and Aclyl/l) or UCP1-Cre-Rictorl/l and UCP1-Cre-Aclyl/l mice (n = 6 per group). Bar graphs represent mean ± SEM. *p < 0.05, **p < 0.01, and ***p < 0.001. Statistical significance was calculated by using two-way ANOVA with Sidak’s test multiple comparisons (a). b Corresponding western blots for a. Black arrows indicate the ACC1 and ACC2 isoforms. c Hematoxylin and eosin stains showing brown fat morphology for the indicated genotypes. Scale bar represents 200 μm. d Our results support the following model of mTORC2 action in brown adipocytes: (1) mTORC2-dependent AKT phosphorylation is distinctly important for ACLY phosphorylation, while for many other AKT substrates, mTORC2 may normally facilitate their phosphorylation, but it is dispensable (indicated by “P” within an unshaded broken circle). This is indicated by the fact that phosphorylation of many AKT substrates is unimpaired by Rictor deletion while ACLY phosphorylation is reduced. (2) mTORC2/AKT-dependent ACLY phosphorylation promotes acetyl-CoA synthesis and primes de novo lipogenesis downstream of glucose uptake and glycolysis. (3) The increased flux to acetyl-CoA additionally stimulates histone acetylation. In brown adipocyte precursors, this coincides with pparγ induction to drive differentiation; in mature brown adipocytes, this coincides with ChREBPβ activity to increase expression of gluco-lipogenic genes. (4) Gluco-lipogenic gene expression then provides a positive feedback effect on glucose transport and de novo lipogenesis. (5) mTORC2 may also stimulate acetate metabolism to acetyl-CoA by regulating the expression and/or activity of ACSS2. Notably, from these data we cannot distinguish between cytoplasmic and nuclear pools of acetyl-CoA.

References

    1. Saxton RA, Sabatini DM. mTOR Signaling in growth, metabolism, and disease. Cell. 2017;169:361–371. doi: 10.1016/j.cell.2017.03.035. - DOI - PubMed
    1. Lee PL, Jung SM, Guertin DA. The complex roles of mechanistic target of rapamycin in adipocytes and beyond. Trends Endocrinol. Metab. 2017;28:319–339. doi: 10.1016/j.tem.2017.01.004. - DOI - PMC - PubMed
    1. Sarbassov DD, Guertin DA, Ali SM, Sabatini DM. Phosphorylation and regulation of Akt/PKB by the rictor-mTOR complex. Science. 2005;307:1098–1101. doi: 10.1126/science.1106148. - DOI - PubMed
    1. Pearce LR, Komander D, Alessi DR. The nuts and bolts of AGC protein kinases. Nat. Rev. Mol. Cell Biol. 2010;11:9–22. doi: 10.1038/nrm2822. - DOI - PubMed
    1. Manning BD, Toker A. AKT/PKB signaling: navigating the network. Cell. 2017;169:381–405. doi: 10.1016/j.cell.2017.04.001. - DOI - PMC - PubMed

MeSH terms