. 2020 Jan 29;11(1):586.
doi: 10.1038/s41467-019-14171-5.

Single-cell transcriptomics identifies CD44 as a marker and regulator of endothelial to haematopoietic transition

Affiliations

Single-cell transcriptomics identifies CD44 as a marker and regulator of endothelial to haematopoietic transition

Morgan Oatley et al. Nat Commun. .

Abstract

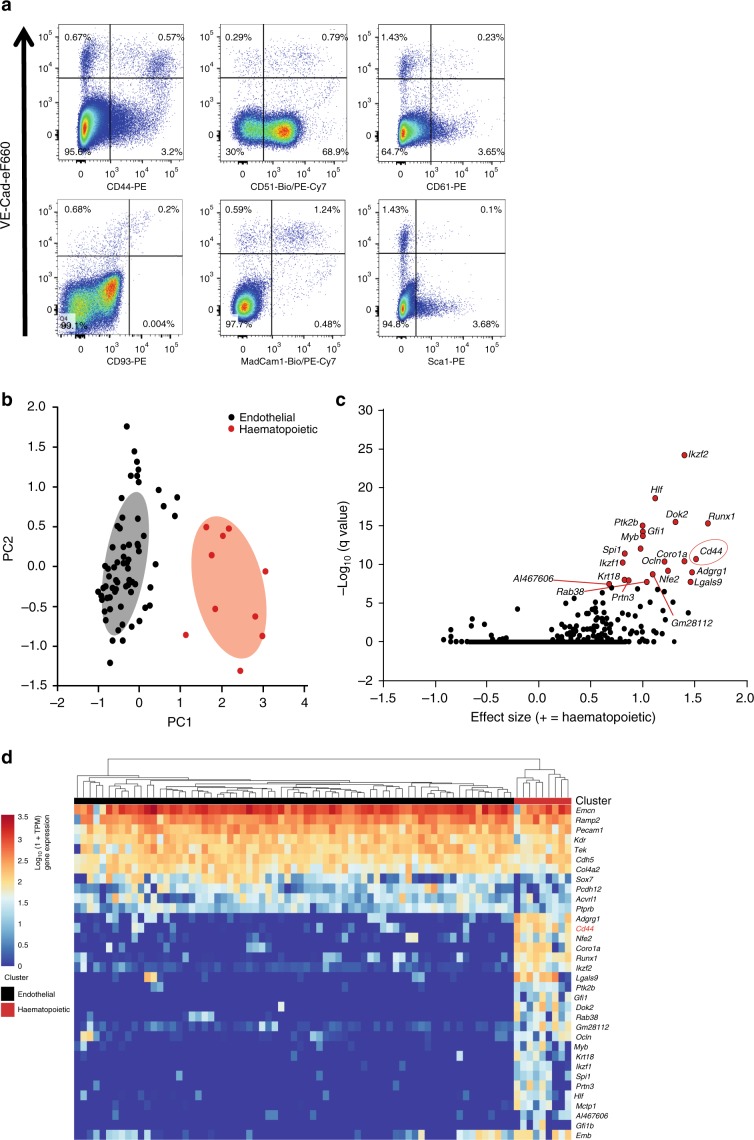
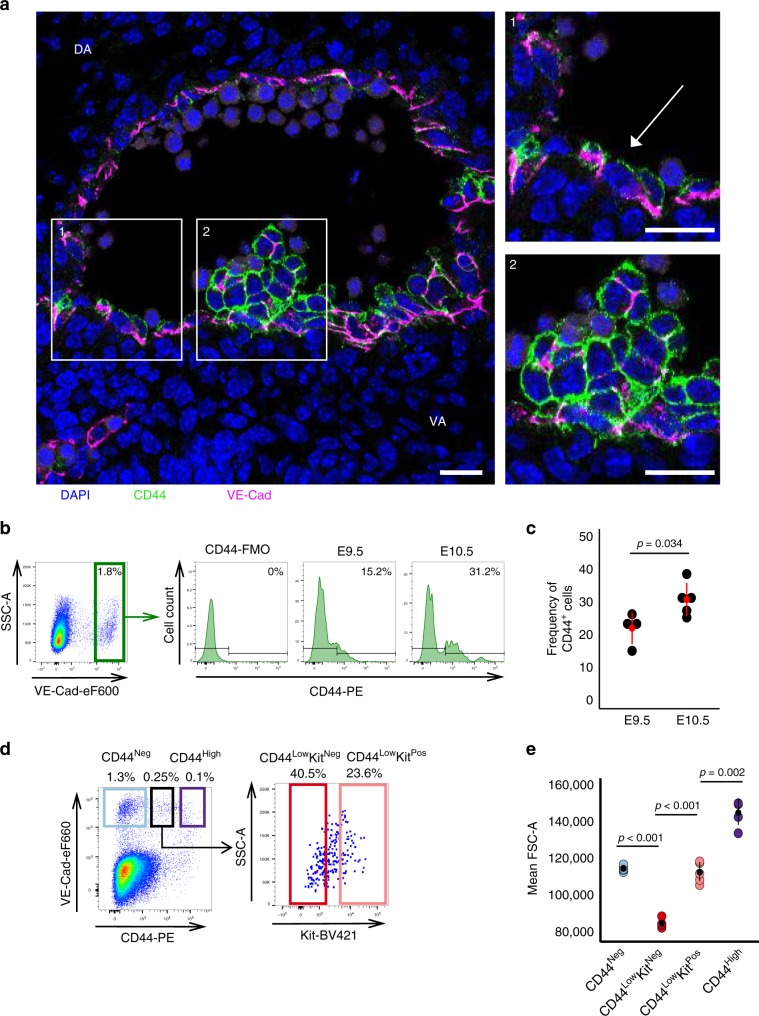
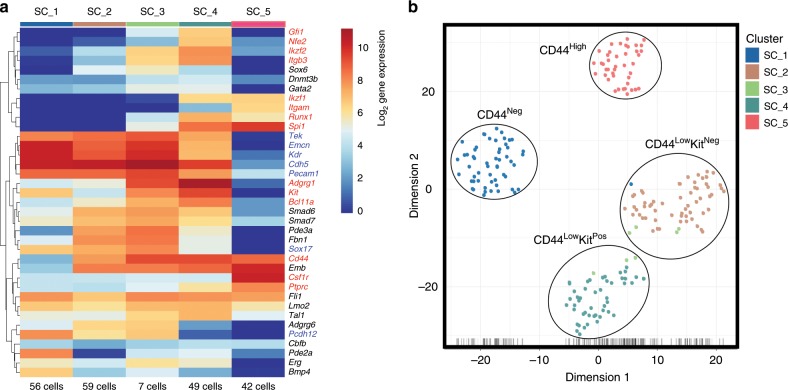
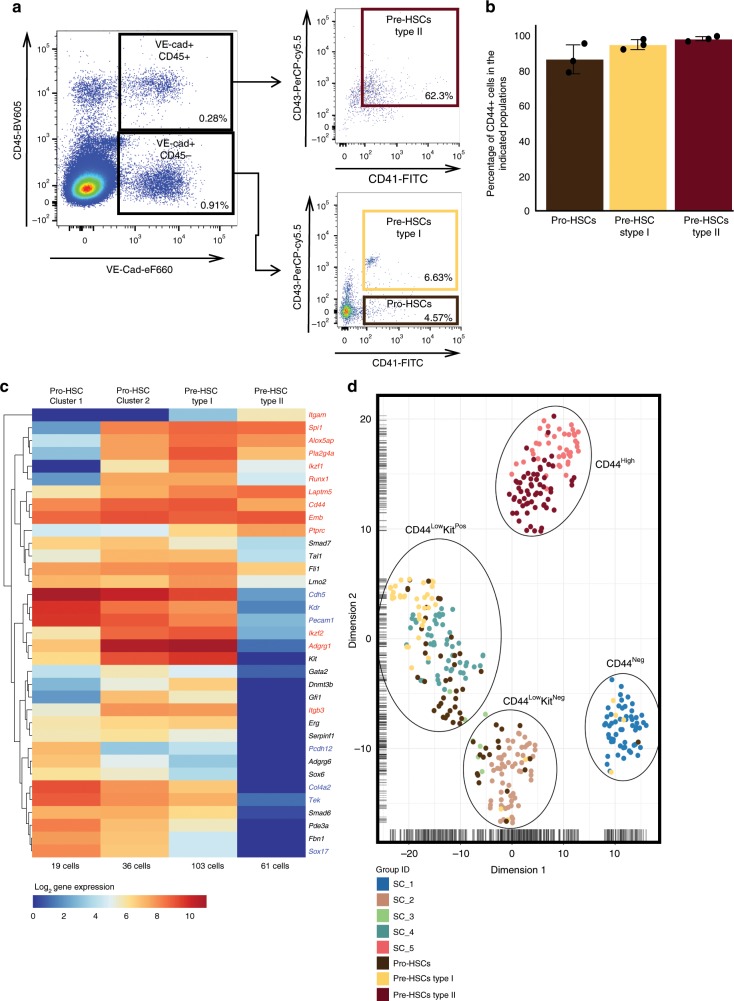
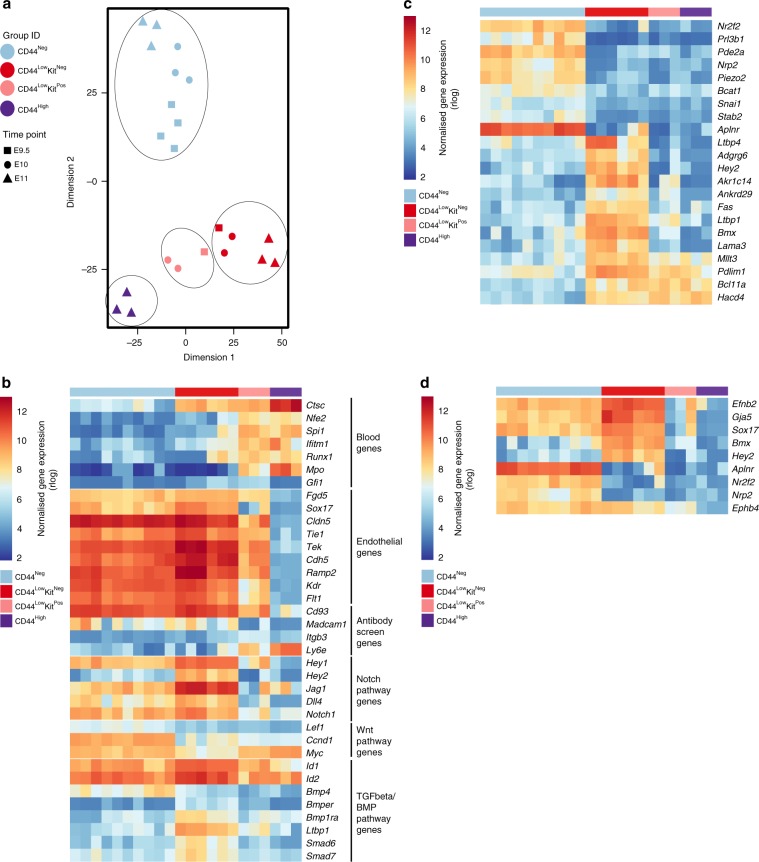
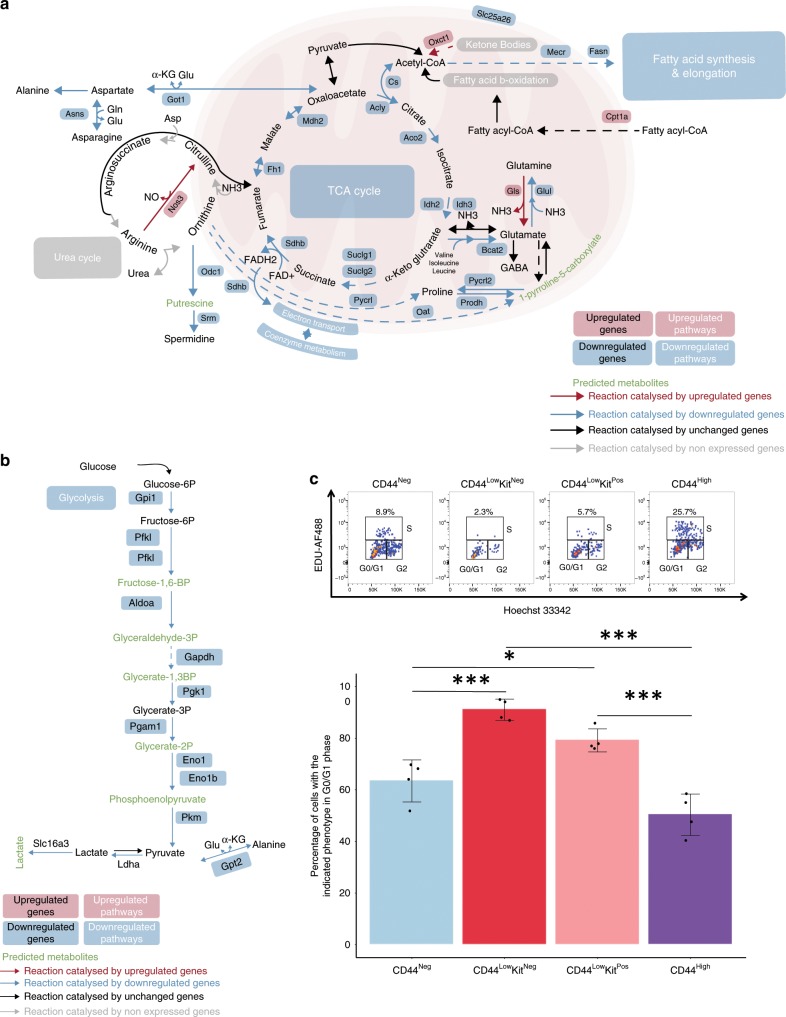
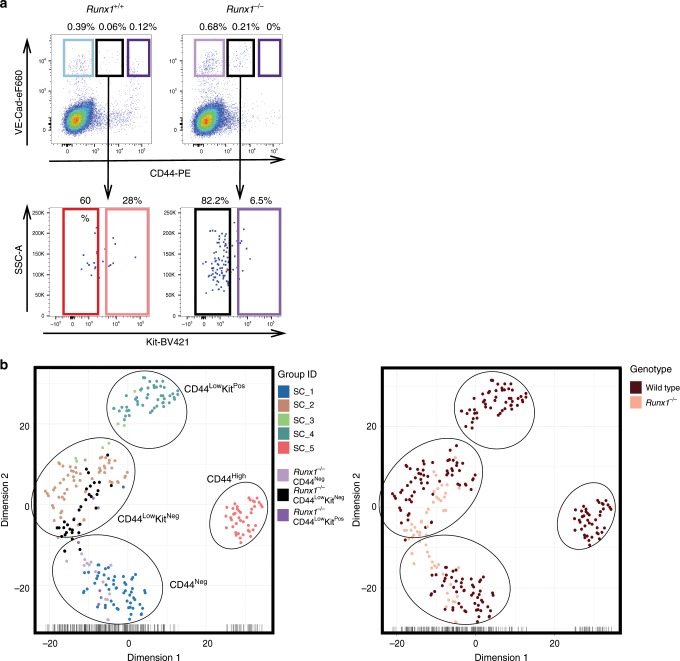
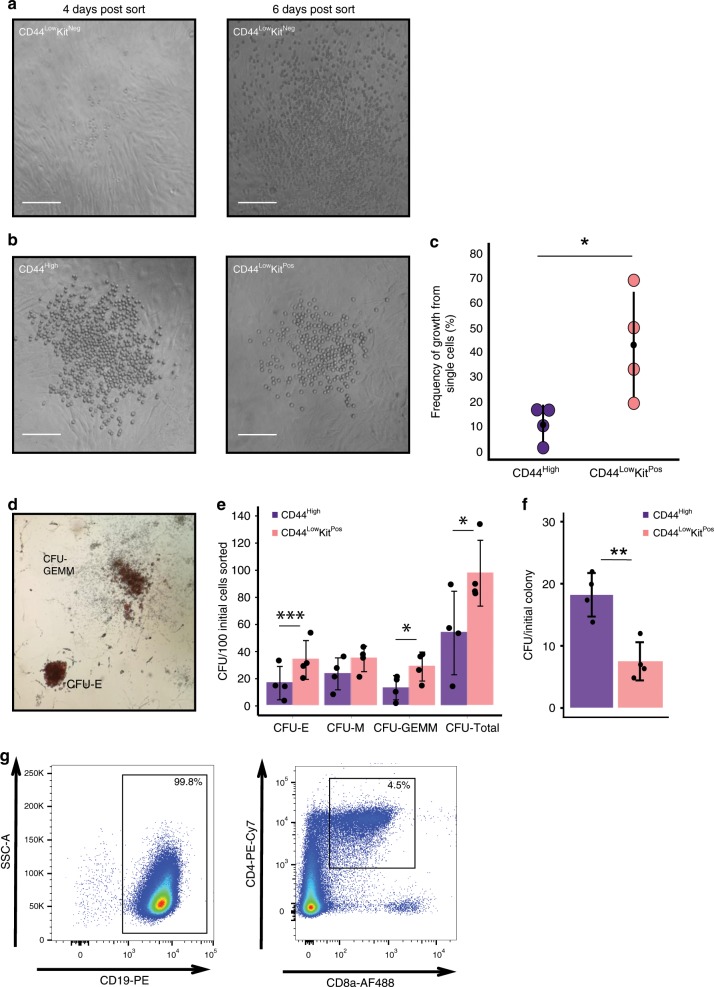
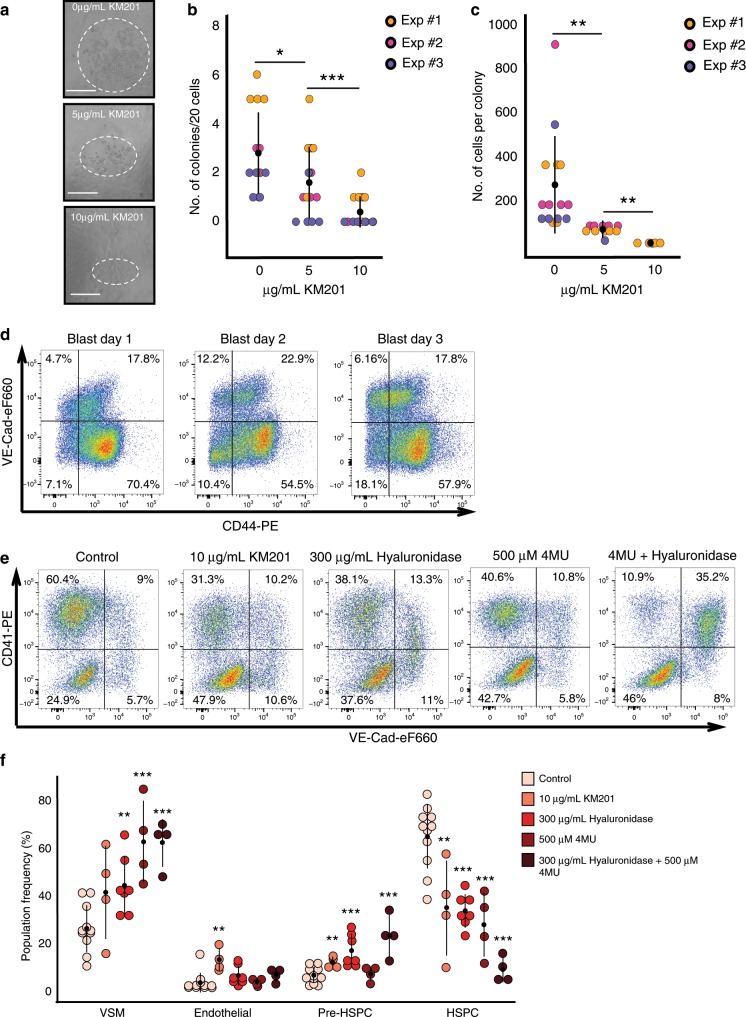
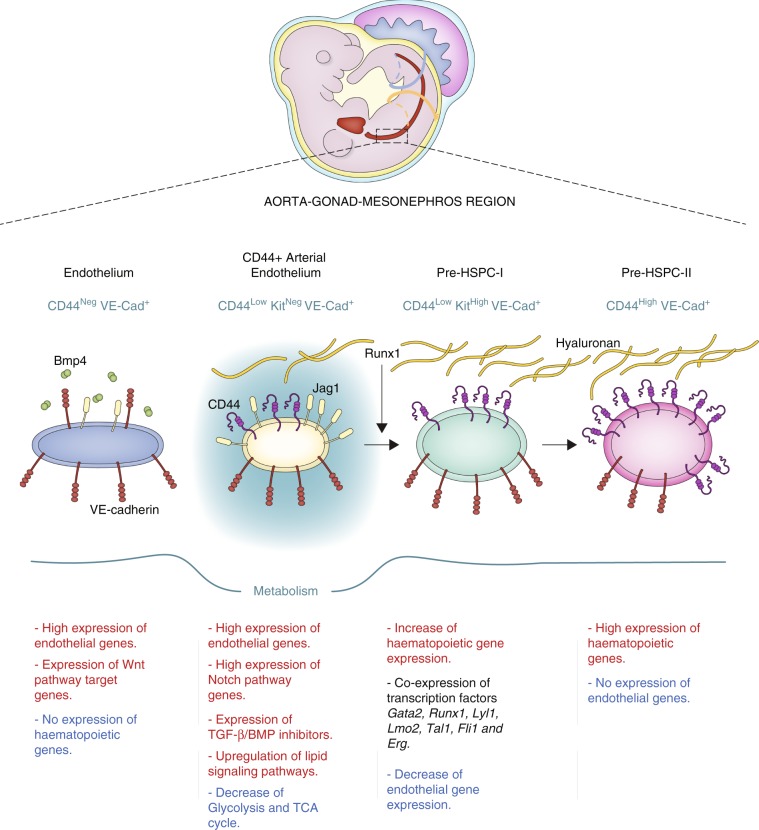
The endothelial to haematopoietic transition (EHT) is the process whereby haemogenic endothelium differentiates into haematopoietic stem and progenitor cells (HSPCs). The intermediary steps of this process are unclear, in particular the identity of endothelial cells that give rise to HSPCs is unknown. Using single-cell transcriptome analysis and antibody screening, we identify CD44 as a marker of EHT enabling us to isolate robustly the different stages of EHT in the aorta-gonad-mesonephros (AGM) region. This allows us to provide a detailed phenotypical and transcriptional profile of CD44-positive arterial endothelial cells from which HSPCs emerge. They are characterized with high expression of genes related to Notch signalling, TGFbeta/BMP antagonists, a downregulation of genes related to glycolysis and the TCA cycle, and a lower rate of cell cycle. Moreover, we demonstrate that by inhibiting the interaction between CD44 and its ligand hyaluronan, we can block EHT, identifying an additional regulator of HSPC development.


Conflict of interest statement

The authors declare no competing interests.

Figures

Fig. 1
Fig. 1. Search for markers to dissect the endothelial to hematopoietic transition.
a FACS plots of cells isolated from the AGM region at E11, stained with VE-Cad and indicated cell surface markers selected from the antibody screen. b Principal component analysis of the single-cell RNA-seq data done at E10.5. Cells expressing haematopoietic genes are marked in red, while the other cells are marked in green. c Volcano plot showing a selection of marker genes specific to the group of cells expressing haematopoietic genes. Cd44 is highlighted with a red circle. d Heatmap displaying the expression of a selection of genes in the endothelial and haematopoietic clusters. Cd44 is highlighted in red. See also Supplementary Fig. 1 and Supplementary Data 1.
Fig. 2
Fig. 2. CD44 splits the VE-Cadherin+ cells of the AGM into different populations.
a Immunofluorescence of VE-Cad (magenta) and CD44 (green) expression in a cross-section of the AGM region of a wild-type embryo at E10 (32 somite pairs). Images 1 and 2 show higher magnification of the areas highlighted in the main image, showing CD44 marking endothelial cells in the vascular wall and a haematopoietic cluster. Scale bars represents 25 μM. b FACS plots indicating percentage of cells expressing high levels of VE-Cad from dissected AGMs of wild-type embryos. The histograms indicate the percentage of VE-CadHigh cells positive for CD44 at both E9.5 (28 somite pairs) and E10.5 (35 somite pairs) compared with the FMO. c Percentage of CD44+ cells within the VE-CadHigh fraction, each data point represents an independent experiment and independent pooled litter of embryos, E9.5 n = 4 and E10.5 n = 5. We compared the average proportion of CD44+ cells at E9.5 (M = 22.13, SD = 4.85) to E10.5 (M = 30.88, SD = 5.08). Significance was determined by a Welch’s two-sample t-test, t(6.7) = 2.635, p-value = 0.0345. d Representative FACS plots of gating strategy and expression of VE-Cad and CD44 in the AGM region of wild-type embryos at E10 (30–34 somite pairs). Expression of Kit cell surface marker is highlighted for the CD44Low population. Full gating strategy is shown in Supplementary Fig. 5a. e Mean FSC-A as an indication of cell size is plotted for each population (CD44Neg, CD44LowKitNeg, CD44LowKitPos and CD44High) for five independent litters of E10 wild-type embryos (n = 5). Significance was determined by a one-way ANOVA, F(3, 16) = 142.01, p-value < 0.0001 followed by Tukey’s HSD post-hoc tests to determine where the significance lies *p < 0.05, **p < 0.01, ***p < 0.001. Error bars represent SD. Source data are provided as a Source Data file. See also Supplementary Fig. 2.
Fig. 3
Fig. 3. The VE-Cad+ subpopulations defined by CD44 are transcriptionally distinct.
a Heatmap showing average expression of endothelial (blue), haematopoietic (red) and various (black) genes in the indicated groups (genes are clustered using Pearson’s correlation). The number of cells for each cluster is indicated at the bottom of the panel. Five groups are indicated. b tSNE plot from single-cell q-RT-PCR data shown in a. See also Supplementary Fig. 3, Supplementary Fig. 4 and Supplementary Data 3.
Fig. 4
Fig. 4. Comparison of the CD44 populations with Pro-HSC, Pre-HSC type I and type II.
a FACS plots of VE-Cad, CD45, CD43 and CD41 expression in the AGM region at E10 (31−32 somite pairs). b Average of CD44-positive frequency in Pro-HSCs, Pre-HSCs type I and Pre-HSCs type II groups (n = 3 independent experiments). Error bars represent SD. Source data are provided as a Source Data file. c Single cells from Pro-HSCs (VE-Cad+ CD41+ CD45 CD43), Pre-HSCs type I (VE-Cad+ CD41+ CD45 CD43+) and Pre-HSCs type II (VE-Cad+ CD45+) populations were isolated and tested by single-cell q-RT-PCR. The heatmap shows the result of the hierarchical clustering analysis (the genes were clustered by Pearson’s correlation) based on average expression of indicated gene for each cell cluster. Genes marked in red are blood genes while the ones marked in blue are endothelial genes. d tSNE plot combining single-cell q-RT-PCR data from Figs. 3 and 4. See also Supplementary Data 4.
Fig. 5
Fig. 5. Bulk RNA sequencing identifies early changes in the EHT process.
a tSNE plot from 25-cell bulk RNA sequencing generated from E9.5, E10 and E11 AGM. Four groups are indicated. b Heatmap of gene expression highlighting a selection of genes. c Heatmap of gene expression highlighting the most differentially expressed genes between CD44Neg and CD44LowKitNeg endothelial populations (p-value < 0.01). d Heatmap of gene expression highlighting arterial (Efbn2, Gja5, Sox17, Bmx and Hey2) and venous (Aplnr, Nr2f2, Nrp2 and Ephb4) coding genes in CD44LowKitNeg and CD44Neg populations. See also Supplementary Data 5.
Fig. 6
Fig. 6. Reduced expression of genes involved in TCA cycle and glycolysis in CD44LowKitNeg endothelial cells.
a, b Overview of key metabolic nodes and pathways enriched in differentially expressed genes when comparing the CD44LowKitNeg and CD44Neg endothelial populations. These were selected based on reporter metabolite analysis. Pathway boxes summarize multiple genes/reporter metabolites (Supplementary Data 8). The mentioned upregulated and downregulated genes refer to the expression in the CD44LowKitNeg population compared with CD44Neg. c Cell proliferation analysis of the four indicated populations showing a representative flow cytometry profile of cell cycle status (top panel) and a bar graph summarizing the proportion of cells in G0/G1 cell cycle phases for each population (bottom panel) (n = 4 independent experiments). Error bars represent SD. A one-way ANOVA was used to compare the proportion of cells in the G0/G1 phase across all populations F(3,12) = 30.24, p-value < 0.0001. A Tukey’s HSD post-hoc test was used to determine where the significance lies, *p-value < 0.05, **p-value < 0.01, ***p-value < 0.001. Source data are provided as a Source Data file.
Fig. 7
Fig. 7. Runx1 is required for the generation of CD44LowKitPos and CD44High cells.
a FACS plots of VE-Cad and CD44 expression in the AGM region at E10.5 from Runx1+/+ (left) and Runx1−/− (right) embryos. b tSNE plots from single-cell q-RT-PCR data shown in a. See also Supplementary Fig. 14 and Supplementary Data 9.
Fig. 8
Fig. 8. VE-Cad+ CD44+ populations have haematopoietic potential.
a Images of OP9 co-cultures after 4 and 6 days of incubation. Haematopoietic potential was observed from CD44LowKitNeg cells with colonies of round cells resulting from 300 cells sorted per well. No round cell colonies were observed with CD44Neg cells. Scale bars represent 100 μM. b Images of OP9 co-culture after 3 days of culture are shown. A single CD44High or CD44LowKitPos cell was FACS sorted onto a confluent OP9 stromal layer and incubated in HE medium. Scale bars represent 100 μM. c The percentage of single cells giving rise to colonies was quantified across four independent experiments (n = 4). The graph compares the frequency of growth from single CD44High (M = 0.11, SD = 0.07) cells with CD44LowKitPos cells (M = 0.43, SD = 0.22). Statistical significance was determined by a two-tailed, paired t-test, t(3) = −4.11, p-value = 0.026. Source data are provided as a Source Data file. d Colony-forming unit assays were performed following three days OP9 culture of CD44LowKitPos and CD44High cells (100 cells per well). Cells were kept for a further 7 days in methocult medium before quantification. Images show representative CFU-E and CFU-GEMM colonies. e The bar graphs show the number of CFUs generated per 100 initial FACS sorted cells (n = 4 independent experiments). Significance was determined by two-tailed, paired t-tests (see Source Data file). f The bar graph indicates the total number of colony-forming units formed per initial colony grown on the OP9 stromal layer. Although the CD44LowKitPos population gives rise to approximately six times more round cell colonies on OP9 then the CD44High population, only ~2.5 times more CFUs are generated. Significance was determined by a two-tailed, paired t-test t(3) = 6.67, p-value = 0.0069 (n = 4 independent experiments). Source data are provided as a Source Data file. g B- and T-cell lymphoid assays were performed following 21 days of OP9 (B cells) and OP9-DL1 (T cells) culture of 50 FACS-sorted CD44High cells. Percentages of CD19+ (B-cells) and CD4+CD8a+ (immature T-cells) are shown. *p-value < 0.05, **p-value < 0.01, ***p-value < 0.001. Error bars indicate SD.
Fig. 9
Fig. 9. Blocking the interaction between CD44 and hyaluronan inhibits the EHT.
a Images of round cell colonies generated from CD44High cells after 4 days of OP9 co-culture with different concentrations of KM201 anti-CD44 blocking antibody. Dotted line indicates approximate size of colonies. Scale bar corresponds to 100 μm. b Dot plot comparing number of round cells colonies formed as a function of the concentration of anti-CD44 blocking antibody applied. Source data are provided as a Source Data file. c Dot plot indicating the number of cells per colony as a function of the concentration of anti-CD44 blocking antibody applied. b, c Kruskal–Wallis tests were used to compare treatment groups and Dunn post-hoc test with Benjamini–Hochberg adjustment was used to identify significance between the conditions (see Source Data file) where *p-value < 0.05, **p-value < 0.01 and ***p-value < 0.001. Each data point represents one well. For each of the three independent experiments (n = 3), there were five different wells. Source data are provided as a Source Data file. d Flow cytometry analysis of CD44 and VE-Cad expression in Hemangioblast culture between day 1 and day 3. The dot plots show expression of VE-Cadherin and CD44 at the indicated time points. e Representative FACS plots of VE-Cad and CD41 expression after 2 days of haemangioblast differentiation. Cells were either untreated (control) or treated with anti-CD44 blocking antibody, hyaluronidase enzyme, 4MU hyaluronan synthase inhibitor or a combination. f Dot plot showing the population percentage for vascular smooth muscle (VSM) (VE-CadCD41), endothelial cells (VE-Cad+CD41), Pre-HSPCs (VE-Cad+CD41+) and HSPCs (VE-CadCD41+) after 2 days of haemangioblast differentiation, summarizing the results of FACS analysis shown in d. Each data point represents an independent experiment for the indicated conditions (n = 11 for control, n = 4 for 10 μg/mL KM201, n = 7 for 300 μg/mL Hyaluronidase, n = 4 for 500 μM 4MU and n = 4 for 300 μg/mL Hyaluronidase + 500 μM 4MU). Significance was determined for VSM, pre-HSPCs, and HSPC populations using a one-way ANOVA followed by Dunnett’s post-hoc tests (see Supplementary Material). As the distribution of values for the endothelial population was not normally distributed a Kruskal–Wallis test was applied and significant differences evaluated with a Dunn post-hoc test (see Source Data file). For d, *p-value < 0.05, **p-value < 0.01 and ***p-value < 0.001. Error bars represent SD. Source data are provided as a Source Data file.
Fig. 10
Fig. 10. New model for the progression of EHT.
Scheme summarising the findings of the present study. We identified two different sets of endothelial cell populations in the AGM with very distinct properties in term of signalling pathways and metabolic states. Expression of Runx1 in the CD44+ arterial endothelial population triggers the upregulation of haematopoietic genes and the formation of the Pre-HSPC-I, which co-expresses endothelial and haematopoietic genes. Continuous expression of haematopoietic genes and interaction between CD44 and hyaluronan eventually lead to the loss of endothelial genes and the formation of Pre-HSPC-II expressing only haematopoietic genes.

References

    1. Medvinsky A, Dzierzak E. Definitive hematopoiesis is autonomously initiated by the AGM region. Cell. 1996;86:897–906. doi: 10.1016/S0092-8674(00)80165-8. - DOI - PubMed
    1. de Bruijn MFTR, et al. Hematopoietic stem cells localize to the endothelial cell layer in the midgestation mouse aorta. Immunity. 2002;16:673–683. doi: 10.1016/S1074-7613(02)00313-8. - DOI - PubMed
    1. Bertrand JY, et al. Haematopoietic stem cells derive directly from aortic endothelium during development. Nature. 2010;464:108–111. doi: 10.1038/nature08738. - DOI - PMC - PubMed
    1. Boisset J-C, et al. In vivo imaging of haematopoietic cells emerging from the mouse aortic endothelium. Nature. 2010;464:116–120. doi: 10.1038/nature08764. - DOI - PubMed
    1. Kissa K, Herbomel P. Blood stem cells emerge from aortic endothelium by a novel type of cell transition. Nature. 2010;464:112–115. doi: 10.1038/nature08761. - DOI - PubMed

MeSH terms