. 2020 Jan 29;11(1):578.
doi: 10.1038/s41467-019-14176-0.

Spatiotemporal contact between peroxisomes and lipid droplets regulates fasting-induced lipolysis via PEX5

Affiliations

Spatiotemporal contact between peroxisomes and lipid droplets regulates fasting-induced lipolysis via PEX5

Jinuk Kong et al. Nat Commun. .

Abstract

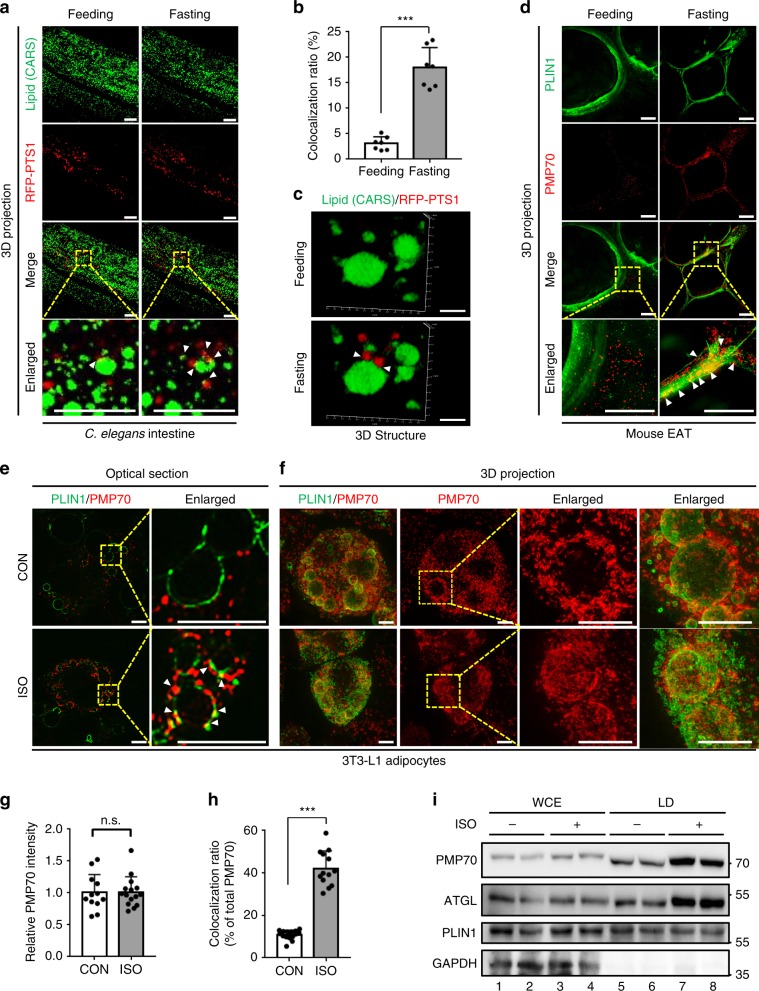
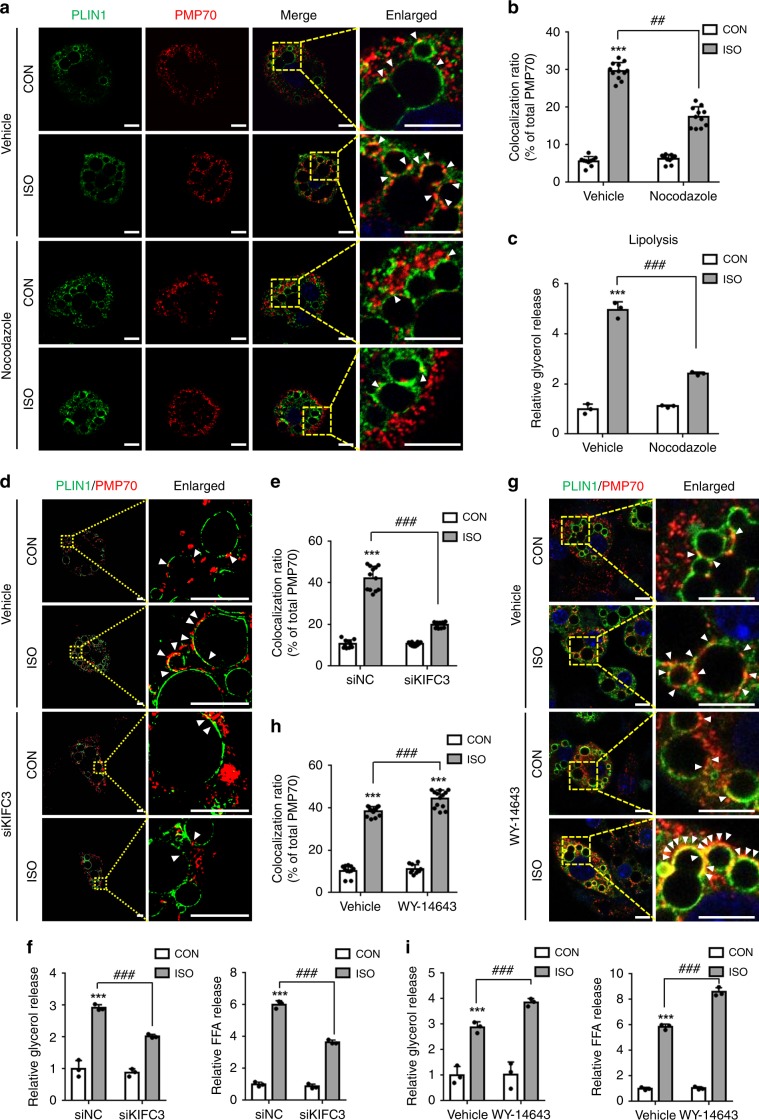
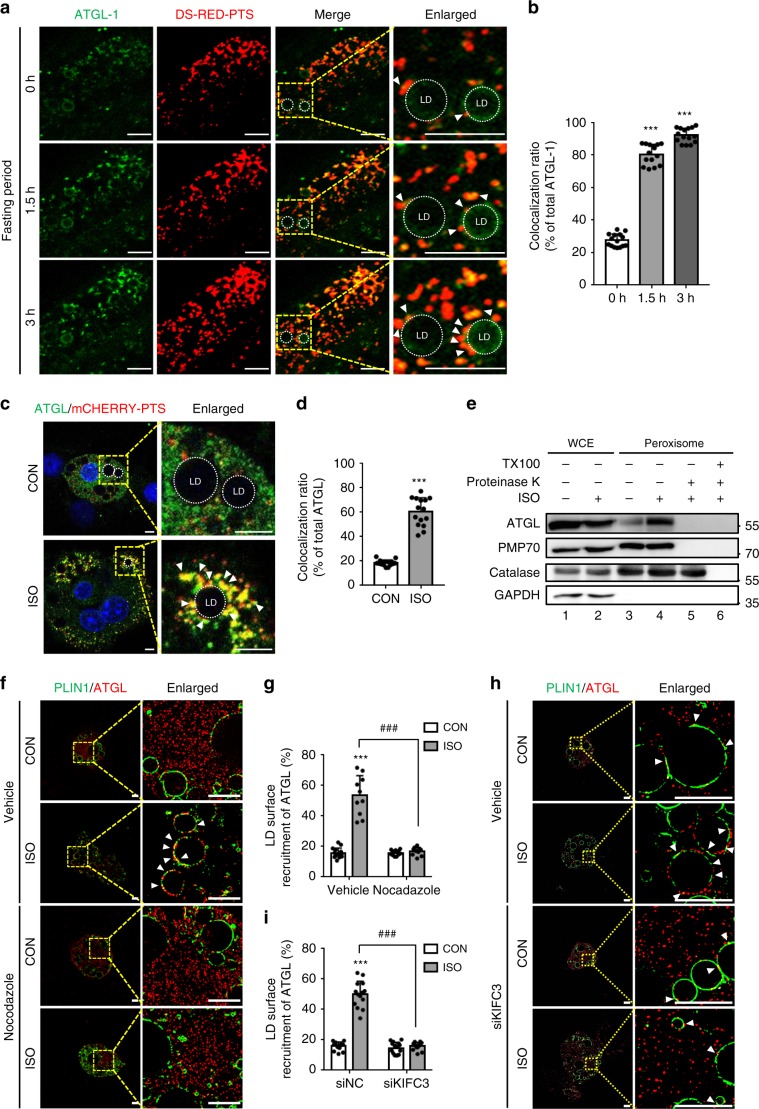
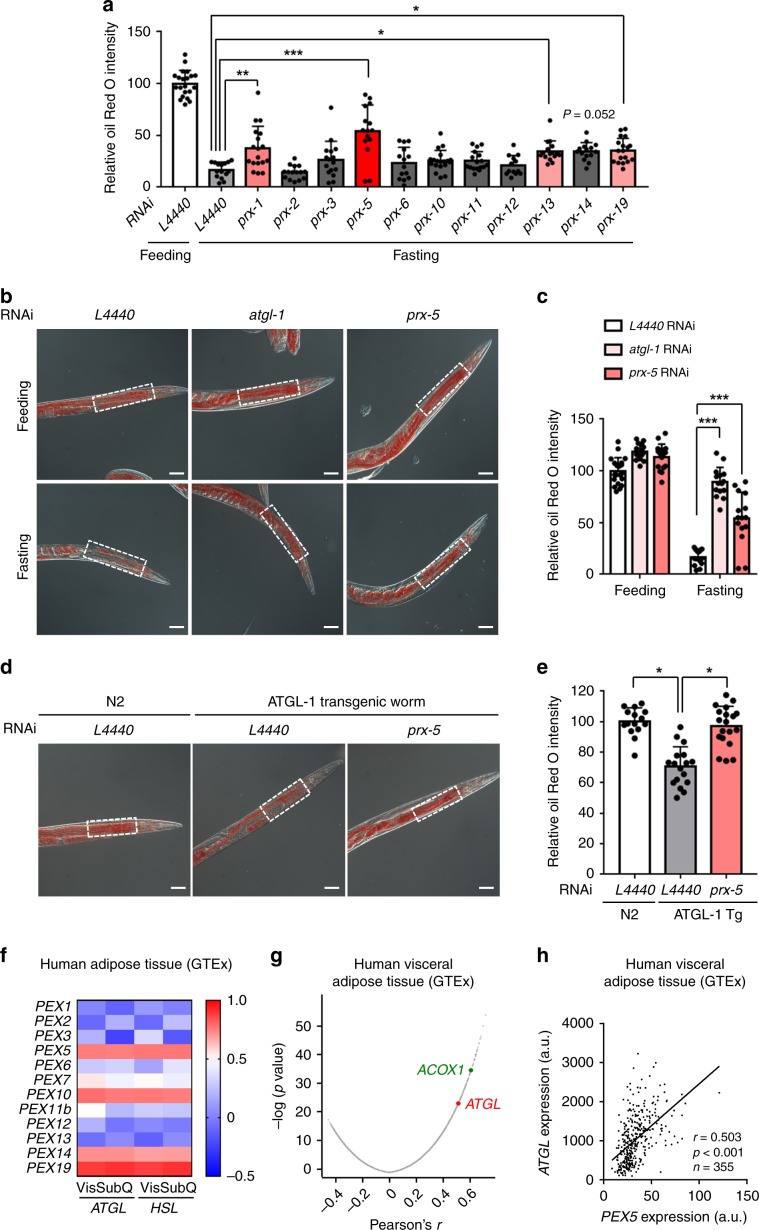
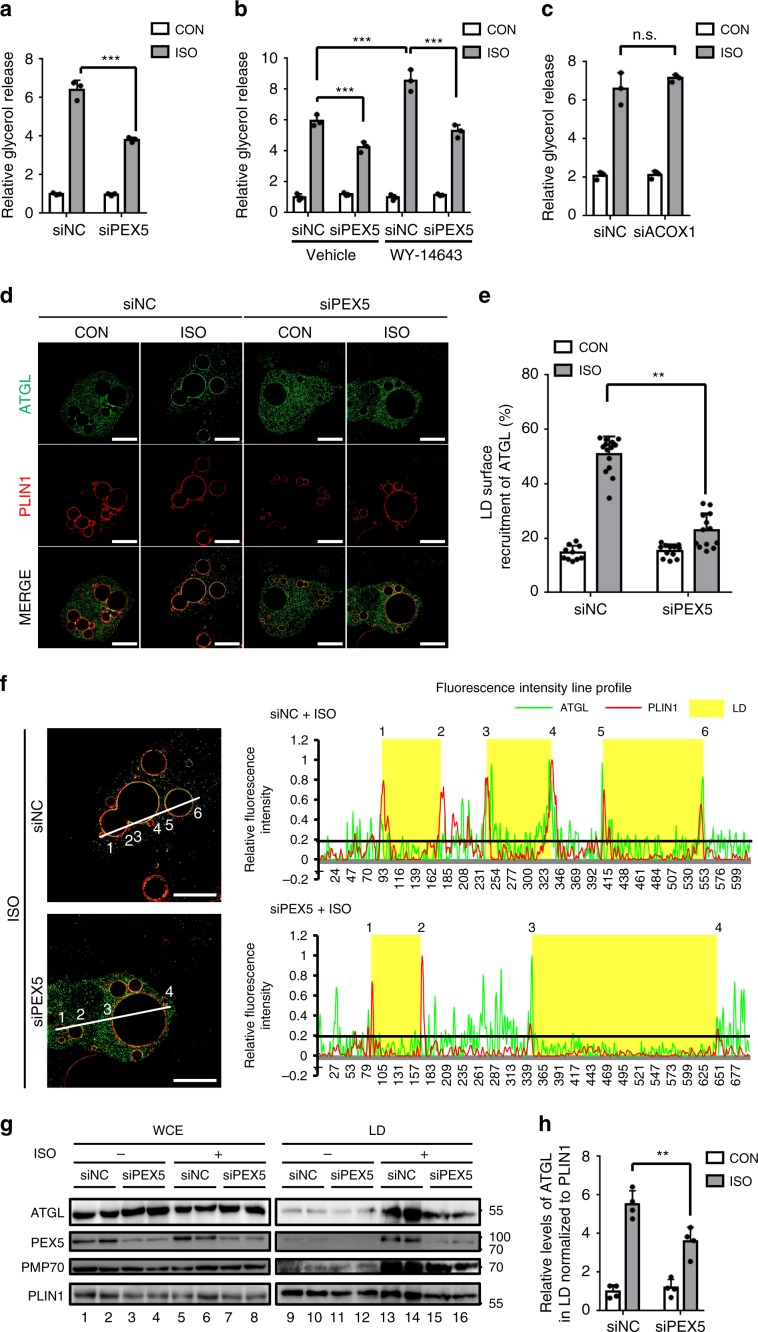
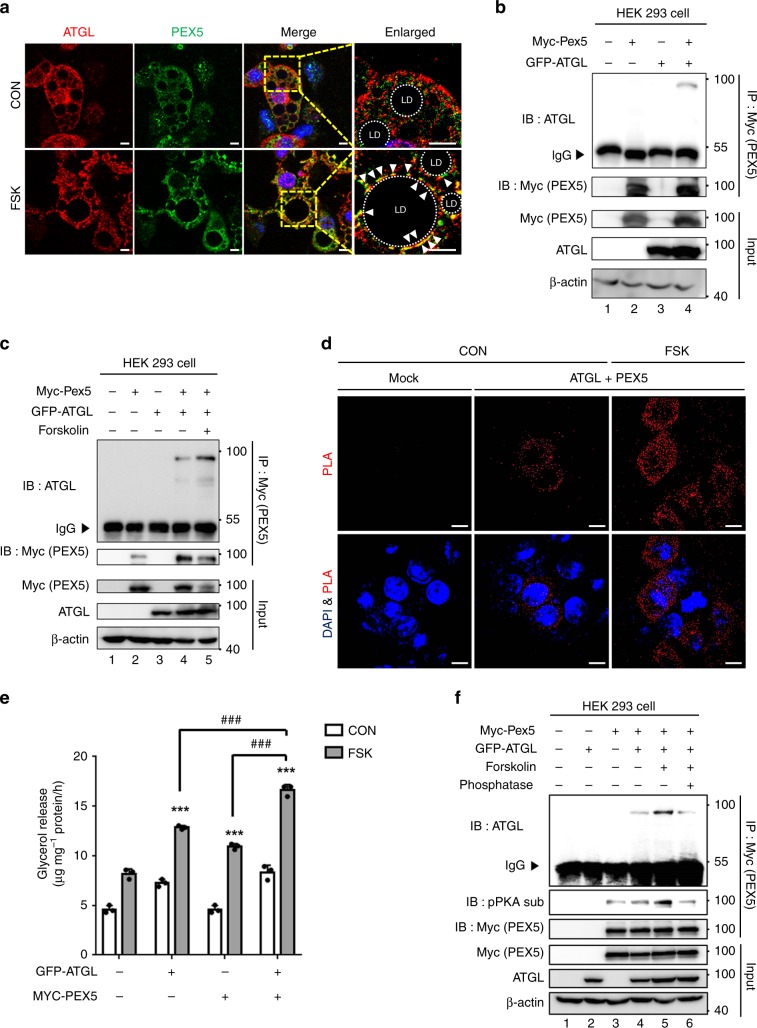
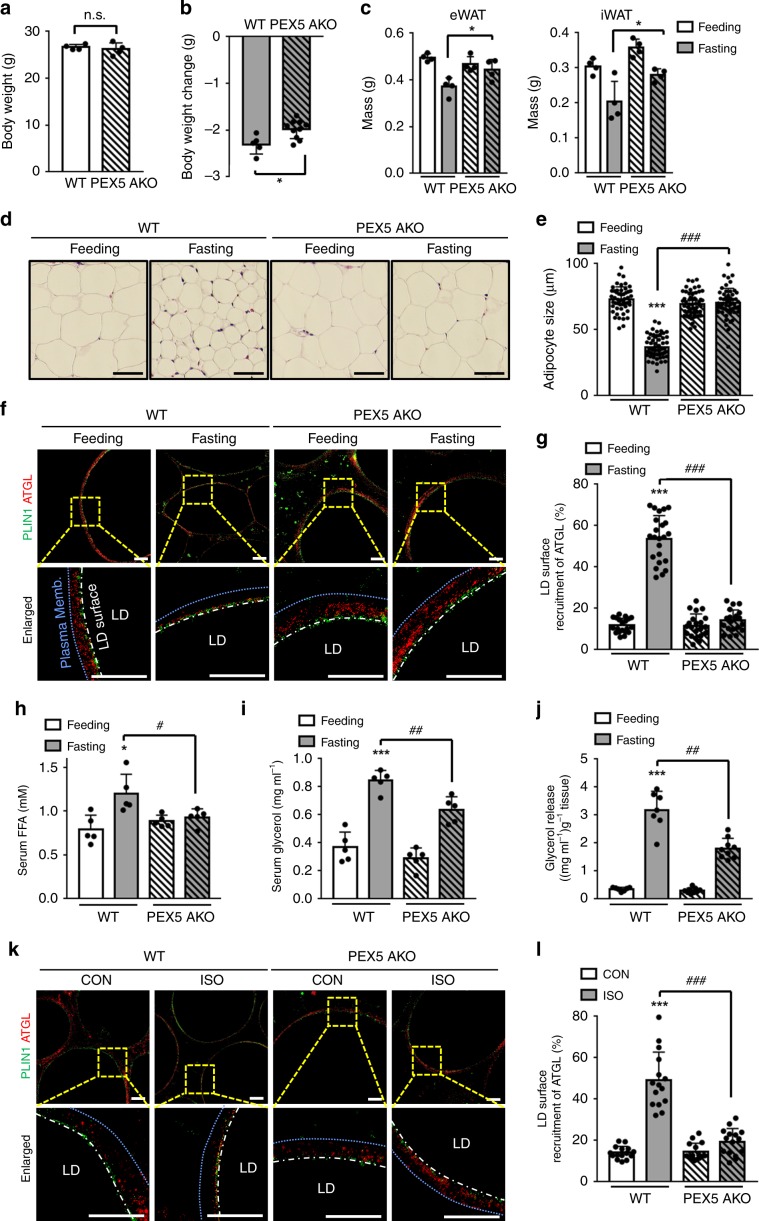
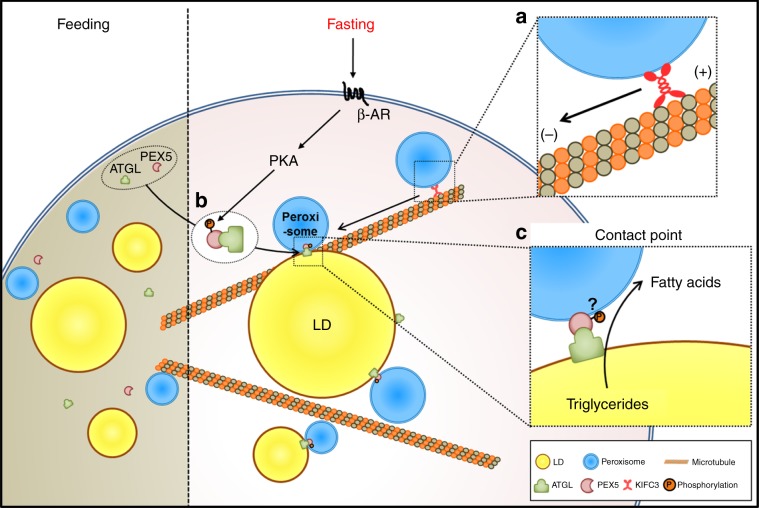
Lipid droplets (LDs) are key subcellular organelles for regulating lipid metabolism. Although several subcellular organelles participate in lipid metabolism, it remains elusive whether physical contacts between subcellular organelles and LDs might be involved in lipolysis upon nutritional deprivation. Here, we demonstrate that peroxisomes and peroxisomal protein PEX5 mediate fasting-induced lipolysis by stimulating adipose triglyceride lipase (ATGL) translocation onto LDs. During fasting, physical contacts between peroxisomes and LDs are increased by KIFC3-dependent movement of peroxisomes toward LDs, which facilitates spatial translocations of ATGL onto LDs. In addition, PEX5 could escort ATGL to contact points between peroxisomes and LDs in the presence of fasting cues. Moreover, in adipocyte-specific PEX5-knockout mice, the recruitment of ATGL onto LDs was defective and fasting-induced lipolysis is attenuated. Collectively, these data suggest that physical contacts between peroxisomes and LDs are required for spatiotemporal translocation of ATGL, which is escorted by PEX5 upon fasting, to maintain energy homeostasis.


Conflict of interest statement

The authors declare no competing interests.

Figures

Fig. 1
Fig. 1. Fasting stimuli promote the interaction between PER–LD.
a Representative CARS live images of peroxisome–LD contacts (arrowhead) during fasting (1 h) in young adult worms expressing RFP::PTS1 (peroxisome marker). b Quantification of peroxisome–LD colocalization calculated using Leica software (LAS X). n = 7 worms. c Representative 3D structural images of peroxisome–LD contact (arrowhead) during fasting in C. elegans. Scale bars, 5 μm. d 3D-SIM images of eWAT immunostained with PLIN1 (LD marker, green) and PMP70 (peroxisome marker, red) under feeding and fasting (12 h) conditions. e Representative optical section images of peroxisome–LD contacts (arrowhead) in differentiated 3T3-L1 adipocytes stained for endogenous PMP70 (red) and PLIN1 (green) and treated with ISO (1 μM) for 1 h. f 3D projection of SIM images in differentiated 3T3-L1 adipocytes immunostained for PMP70 (Red) and PLIN1 (green) and treated with ISO (1 μM) for 1 h. g Quantification of PMP70 staining intensity in adipocytes treated with or without ISO (1 μM) for 1 h. n = 12 cells for CON; n = 15 cells treated with ISO. h Quantification of peroxisome–LD colocalization calculated using imageJ software. n = 15 cells for each group. i Western blot of whole cell extracts (WCE) or LD fractionation for PMP70 (peroxisome) and LD-associated proteins. 30 μg of protein from WCE; 20 μg of protein from LD fraction. CON control; ISO isoproterenol. All scale bars, 10 μm except for c. Arrowhead: contact between PER–LD. Data are represented as the mean ± SD; *P < 0.05, ***P < 0.001 (unpaired two-tailed Student’s t-test). n.s., not statistically significant.
Fig. 2
Fig. 2. Peroxisome–LD contacts are crucial for fasting-induced lipolysis.
a, b Representative confocal images and quantification of peroxisome–LD contacts (arrowhead) immunostained with PLIN1 (green) and PMP70 (red) in differentiated adipocytes. Cells were treated with or without nocodazole (0.05 μg ml−1) under CON or ISO treatment. n = 10 cells for vehicle group; n = 12 cells treated with ISO; n = 10 cells treated with nocodazole; n = 11 cells treated with nocodazole and ISO for quantification of colocalization b using imageJ software. c Relative glycerol release from adipocytes in media. Adipocytes were treated with or without nocodazole (0.05 μg ml−1) under CON or ISO treatment. n = 3 for each group. d, e SIM images and quantitative data of peroxisome–LD contacts (arrowhead) stained with PLIN1 (green) and PMP70 (red) in adipocytes transfected with siNC or siKIFC3 for 48 h. Scale bars, 5 μm. n = 10 cells for siNC group; n = 12 cells treated with ISO; n = 10 cells for siKIFC3 group; n = 11 cells for siKIFC3 treated with ISO for quantification of colocalization e using imageJ. f Relative release of glycerol and FFA from adipocytes transfected with siNC or siKIFC3 for 48 h. n = 3 for each group. g, h Confocal images and quantitative data of peroxisome–LD contacts (arrowhead) immunostained with PLIN1 (green) and PMP70 (red) in adipocytes. Cells were treated with or without WY-14643 (10 μM) for 48 h. n = 11 cells for vehicle group; n = 15 cells treated with ISO; n = 10 cells treated with WY-14643; n = 13 cells treated with WY-14643 and ISO for quantification of colocalization h using imageJ. i Relative release of glycerol and FFA from adipocytes treated with or without WY-14643 (10 μM) for 48 h. n = 3 for each group. CON control, ISO isoproterenol. Cells were treated with ISO (1 μM) for 1 h. Arrowhead: contact between PER–LD. Data represent the mean ± SD; *P < 0.05, **P < 0.01, ***P < 0.001 vs. vehicle-CON or siNC-CON, ##P < 0.01, and ###P < 0.001 in two-way ANOVA followed by Turkey’s post-hoc test. All scale bars, 10 μm except for d.
Fig. 3
Fig. 3. ATGL translocates to contact sites between PER–LD upon fasting.
a Representative time-lapse confocal images for colocalization of ATGL and peroxisome at LD surfaces (arrowhead) during fasting (3 h) in young adult worms expressing DsRED::PTS1 and ATGL-1::GFP. n = 15 for each group. Scale bars, 10 μm. b Percentage of ATGL protein colocalizing with peroxisomes calculated using imageJ software. n = 15 for each group. c Confocal images using adipocytes transfected with mCHERRY::PTS and stained with endogenous ATGL (green), and treated with ISO (1 μM) for 1 h. Arrowhead: colocalzation of ATGL and peroxisome at LD surfaces. DAPI, blue. Scale bars, 10 μm. d Quantification analysis of ATGL colocalized to peroxisomes calculated using imageJ software. n = 15 for each group. e Protease protection assays performed in the absence or presence of Triton X-100. Proteinase K was treated for 30 min in ice. 30 μg of protein from WCE; 20 μg of protein from peroxisome fraction. f, g Representative SIM images and quantification analysis recruited ATGL onto LD surfaces in adipocytes immunostained with endogenous PLIN1 (green) and ATGL (red). Cells were treated with nocodazole (0.05 μg ml−1) under CON or ISO (1 μM) treatment. Scale bars, 5 μm. n = 15 cells for vehicle group; n = 10 cells treated with ISO; n = 11 cells treated with nocodazole; n = 10 cells treated with nocodazole and ISO. Arrowhead: ATGL recruited to LD surfaces in f. h, i SIM images and quantification analysis of recruited ATGL onto LD surfaces in adipocytes immunostained with endogenous PLIN1 (green) and ATGL (red). Cells were c or transfected with siNC or siKIFC3 for 48 h d under CON or ISO (1 μM) treatment. Arrowhead: ATGL recruited to LD surfaces in h. n = 13 cells for siNC group; n = 14 cells treated with ISO; n = 15 cells for siKIFC3 group; n = 14 cells for siKIFC3 treated with ISO. Scale bars, 5 μm. ATGL recruitment was quantified using imageJ. CON control; ISO isoproterenol. Data represent the mean ± SD; ***P < 0.001 vs. vehicle-CON or siNC-CON or fasting 0 h, and ###P < 0.001 group in two-way ANOVA followed by Turkey’s post-hoc test.
Fig. 4
Fig. 4. PRX-5 is required for fasting-induced lipolysis in C. elegans.
a RNAi screening of peroxisomal genes involved in fasting-induced lipolysis-based Oil Red O (ORO) staining in anterior intestine of C. elegans. ORO staining intensities in young adult RNAi-treated worms under feeding and 8-h fasting conditions were quantified and classified according to the relative fold increase compared to the L4440 control group. n = 21 for feeding L4440; n = 15 for fasting L4440; n = 18 for prx-1; n = 15 for prx-2; n = 16 for prx-3; n = 15 for prx-5; n = 14 for prx-6; n = 19 for prx-10; n = 17 for prx-11; n = 13 for prx-12; n = 16 for prx-13; n = 15 for prx-14; n = 18 for prx-19. b, c Representative images and quantification of ORO staining in anterior intestine of C. elegans with RNAi of atgl-1 and prx-5 in young adult worms under feeding and fasting (8 h). n = 15–20 for quantification. n = 21 for feeding L4440; n = 16 for feeding atgl-1; n = 16 for prx-5; n = 15 for fasting L4440; n = 15 for fasting atgl-1; n = 15 for fasting prx-5. d, e Representative images and quantification of ORO staining in anterior intestine from prx-5 RNAi-treated WT worms (N2) and atgl-1 transgenic worms (ATGL-1 Tg, hj67; Is[atgl-1p::atgl-1::GFP]). n = 15 for L4440 in N2 worms; n = 17 for L4440 in ATGL-1 Tg; n = 19 for prx-5 in ATGL-1 Tg. f Heatmap analysis of Pearson’s coefficients (r) between lipolytic genes (ATGL and HSL) and PEX genes in human adipose tissue based on data from GTEx. Vis visceral; SubQ subcutaneous. g Plots of correlation between PEX5 and all detectable genes in human visceral adipose tissue based on data from GTEx. ACOX1 (green), positive control for correlation of PEX5. h Correlations between expression of PEX5 and ATGL in human visceral adipose tissue based on data from GTEx. All scale bars, 50 μm. Data represent the mean ± SD; *P < 0.05, **P < 0.01, ***P < 0.001 in two-way ANOVA followed by Turkey’s post-hoc test c and unpaired two-tailed Student’s t-test e.
Fig. 5
Fig. 5. PEX5 escorts ATGL to LD to mediate fasting-induced lipolysis.
a Relative glycerol release from adipocytes transfected with negative control (NC) or PEX5 siRNA(siPEX5) for 48 h. n = 3 for each group. b Relative glycerol release from adipocytes transfected with siNC or siPEX5 for 48 h together in the absence or presence of WY-14643 (10 μM) treatment. n = 3 for each group. c Relative glycerol release from adipocytes transfected with siNC or siACOX1 for 48 h. n = 3 for each group. d, e Representative SIM images and quantification analysis of recruited ATGL to LDs in adipocytes immunostained with endogenous PLIN1 (red) and ATGL (green). Cells were transfected with siNC or siPEX5. n = 10 cells for siNC group; n = 15 cells treated with ISO; n = 12 cells for siPEX5 group; n = 13 cells for siPEX5 treated with ISO. Quantification of ATGL recruitment to LDs was measured using imageJ software. f Representative SIM z-section images (left) and fluorescence intensity profiles from the indicated line scans (right). Below 0.2 fluorescence intensity indicates background fluorescence signal. LD areas are highlighted in yellow. g Western blot of whole cell extracts (WCE) or LD fractionation from adipocytes transfected with siNC or siPEX5. 30 μg of protein from WCE; 20 μg of protein from LD fraction. h Quantification of ATGL in LDs normalized to PLIN1 from g. n = 4 independent experiments. CON control, ISO isoproterenol. Cells were treated with ISO (1 μM) for 1 h. All scale bars, 10 μm. Data represent the mean ± SD; *P < 0.05, ***P < 0.01 in two-way ANOVA followed by Turkey’s post-hoc test. n.s., not statistically significant.
Fig. 6
Fig. 6. PEX5 mediates stimulated lipolysis through interaction with ATGL.
a Representative images of differentiated adipocytes immunostained for endogenous ATGL (red), PEX5 (green), and DAPI (blue). Adipocytes were treated with or without FSK (10 μM) for 1 h. CON control; FSK forskolin. Scale bars, 10 μm. b, c Co-immunoprecipitation with an anti-MYC antibody and western blotting were conducted with the indicated antibodies. HEK293 cells were transfected with MYC-PEX5 and GFP-ATGL expression vectors. FSK forskolin. d In HEK293 cells, in situ proximity ligation (PLA) assay transfected with MYC-PEX5 and GFP-ATGL expression vectors without lipid challenge. FSK forskolin. Scale bars, 10 μm. e Concentrations of released glycerol from cultured COS-7 cells transfected with or without PEX5-WT and ATGL-WT expression vectors. COS-7 cells were pretreated with oleic acid (500 μM) for 48 h and FSK (25 μM) for 3 h. n = 3 for each group. CON control; FSK forskolin. Data represent the mean ± SD; ***P < 0.001 vs. Mock-CON and ###P < 0.001 group by two-way ANOVA followed by Turkey’s post-hoc test. f HEK293 cells were transfected with MYC-PEX5 and GFP-ATGL expression vectors and treated with or without FSK and phosphatase (CIAP). Co-immunoprecipitation with an anti-MYC antibody and western blotting were conducted with the indicated antibodies. IP immunoprecipitation; IB immunoblotting; IgG immunoglobulin G.
Fig. 7
Fig. 7. Fasting-induced lipolysis is attenuated in PEX5 AKO mice.
a Body weight of WT and PEX5 AKO mice (12 weeks). n = 4 per genotype. b Body weight changes of WT and PEX5 AKO mice under fasting (12 h) conditions. n = 5 for WT; n = 10 for PEX5 AKO. c Masses of eWAT and iWAT from WT and PEX5 AKO under feeding and fasting (12 h) conditions. n = 4 for each group. d Adipocyte morphology of eWAT from WT and PEX5 AKO mice stained by hematoxylin and eosin (H&E). Scale bars, 50 μm. e Adipocyte size in eWAT of WT and PEX5 AKO mice under feeding and fasting (12 h) conditions. n = 52 for feeding WT; n = 61 for fasting WT; n = 54 for feeding PEX5 AKO; n = 53 for fasting PEX5 AKO. f Representative SIM images showing the subcellular localization of ATGL in eWAT immunostained with PLIN1 (green) and ATGL (red) under feeding and 12 h of fasting. Blue dashed line, plasma membrane; white dashed line, LD surface. The boundaries of adipocytes membrane was distinguished by DIC images. Scale bars, 10 μm. g Quantification of ATGL recruitment to LDs in eWAT of f. n = 20–23. h, i Serum levels of FFAs h and glycerol i in fed and fasted (12 h) mice. n = 5 per genotype. j Ex vivo lipolysis measured by glycerol release from eWAT treated with or without ISO (5 μM) for 1 h. n = 7 for WT; n = 9 for PEX5 AKO. k Representative SIM images of ATGL recruitment in eWAT immunostained with PLIN1 and ATGL treated with or without for ISO (5 μM) for 1 h. Scale bars, 10 μm. l Quantification of ATGL recruitment to LDs in eWAT of k. n = 15 per genotype. Data represent the mean ± SD; *P < 0.05, ***P < 0.001, vs. WT-Feeding or WT-CON, #P < 0.05, ##P < 0.01, and ###P < 0.001 group in two-way ANOVA followed by Turkey’s post-hoc test.
Fig. 8
Fig. 8. Working model.
During fasting, peroxisomes move to LDs via microtubule and this movement is mediated by KIFC3 (a). PKA activation increases PEX5 phosphorylation and PEX5 interacts with ATGL independent of canonical PTS1 (b). Then, PEX5–ATGL complex translocates to the contact points between PER–LD even though it needs to be further elucidated whether PEX5 phosphorylation is important for PEX5–ATGL translocation to the contact points between PER–LD. Finally, fasting-induced lipolysis is elevated (c).

References

    1. Walther TC, Farese RV., Jr. Lipid droplets and cellular lipid metabolism. Annu. Rev. Biochem. 2012;81:687–714. doi: 10.1146/annurev-biochem-061009-102430. - DOI - PMC - PubMed
    1. Rosen ED, Spiegelman BM. Adipocytes as regulators of energy balance and glucose homeostasis. Nature. 2006;444:847–853. doi: 10.1038/nature05483. - DOI - PMC - PubMed
    1. Welte MA. Expanding roles for lipid droplets. Curr. Biol. 2015;25:R470–R481. doi: 10.1016/j.cub.2015.04.004. - DOI - PMC - PubMed
    1. Zimmermann R, et al. Fat mobilization in adipose tissue is promoted by adipose triglyceride lipase. Science. 2004;306:1383–1386. doi: 10.1126/science.1100747. - DOI - PubMed
    1. Villena JA, Roy S, Sarkadi-Nagy E, Kim KH, Sul HS. Desnutrin, an adipocyte gene encoding a novel patatin domain-containing protein, is induced by fasting and glucocorticoids: ectopic expression of desnutrin increases triglyceride hydrolysis. J. Biol. Chem. 2004;279:47066–47075. doi: 10.1074/jbc.M403855200. - DOI - PubMed

MeSH terms

LinkOut - more resources