. 2020 Jan 29;11(1):585.
doi: 10.1038/s41467-020-14474-y.

Ocean circulation causes the largest freshening event for 120 years in eastern subpolar North Atlantic

Affiliations

Ocean circulation causes the largest freshening event for 120 years in eastern subpolar North Atlantic

N Penny Holliday et al. Nat Commun. .

Abstract

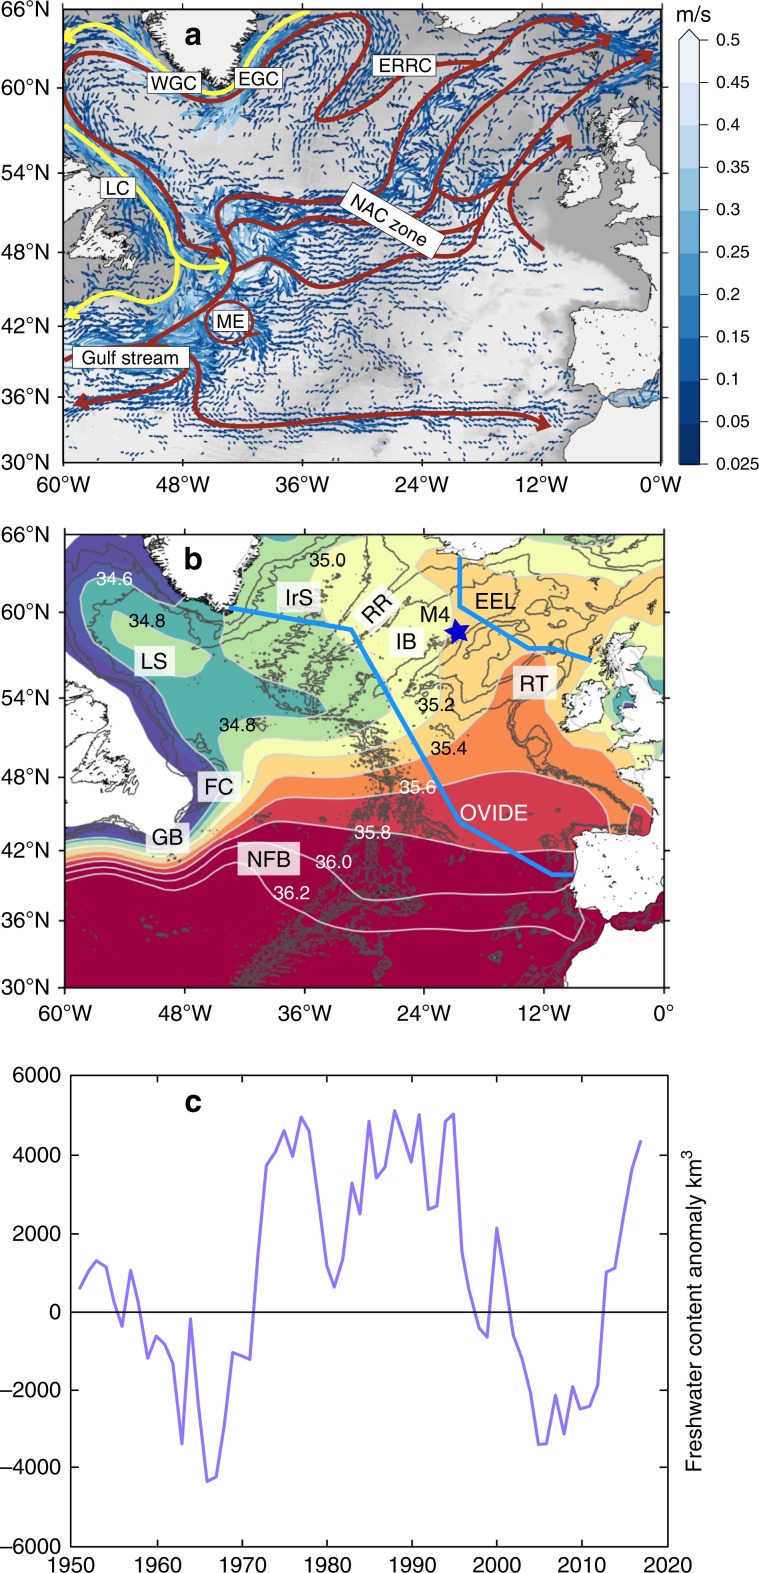
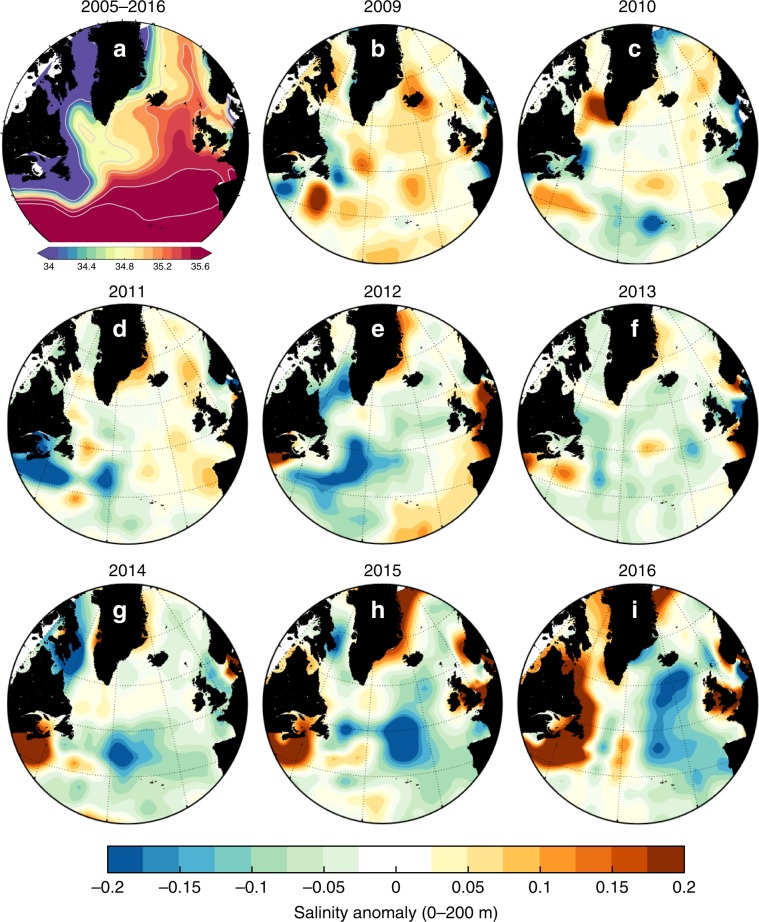
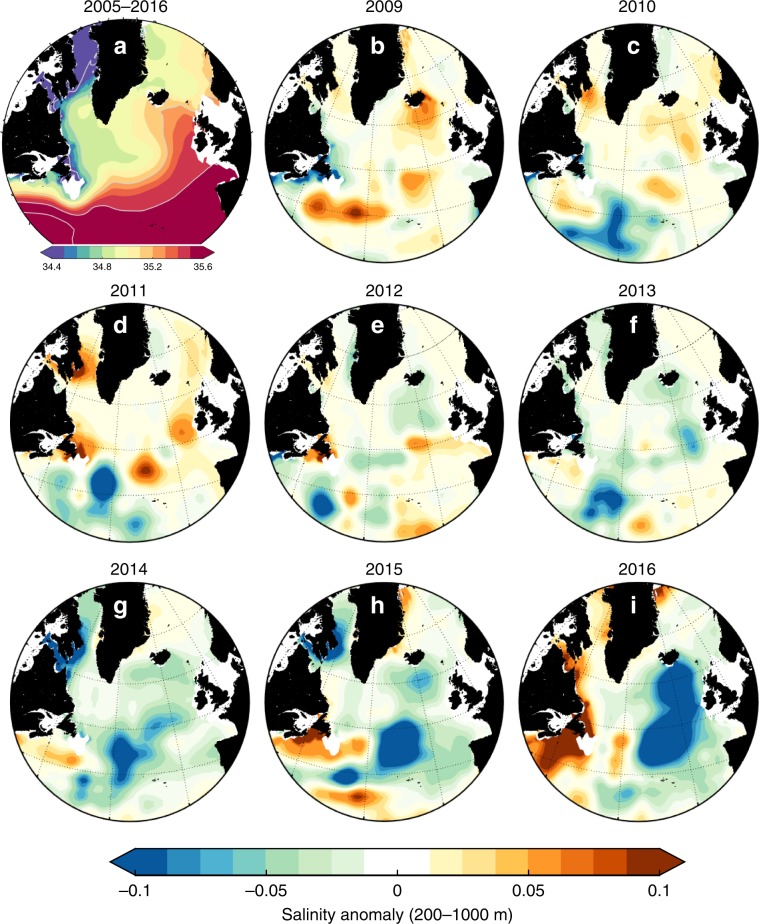
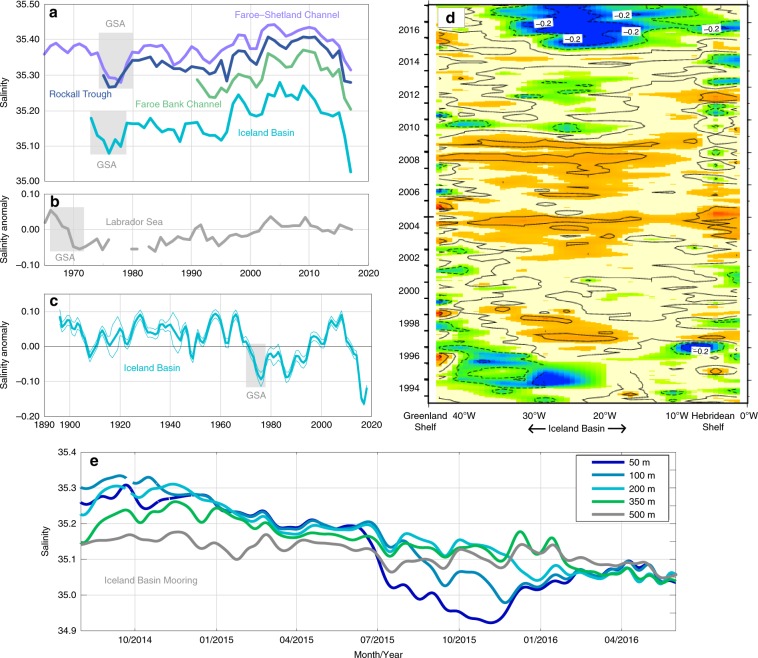
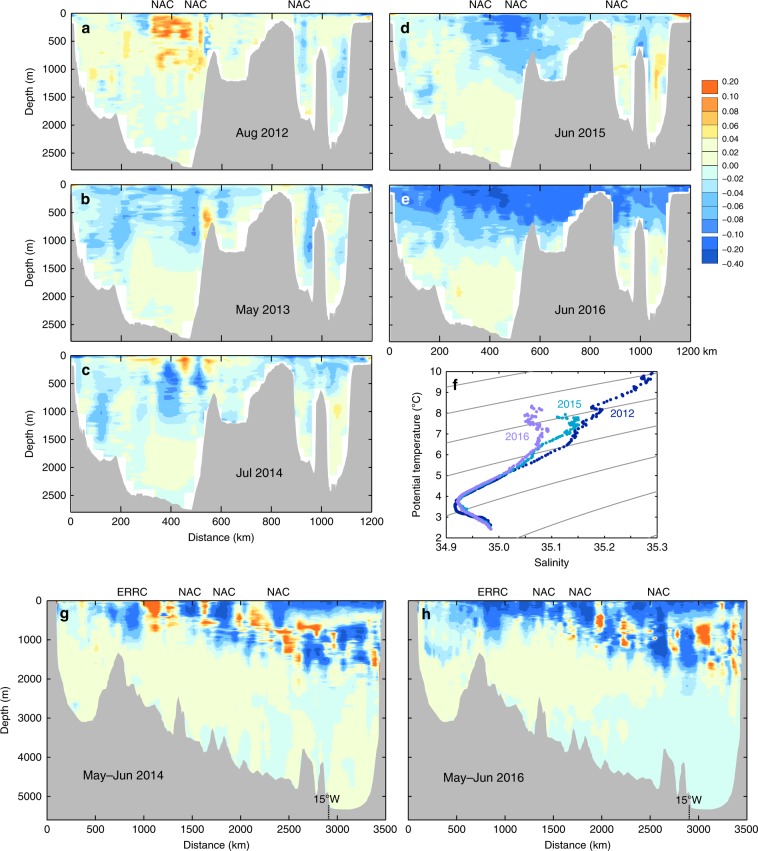
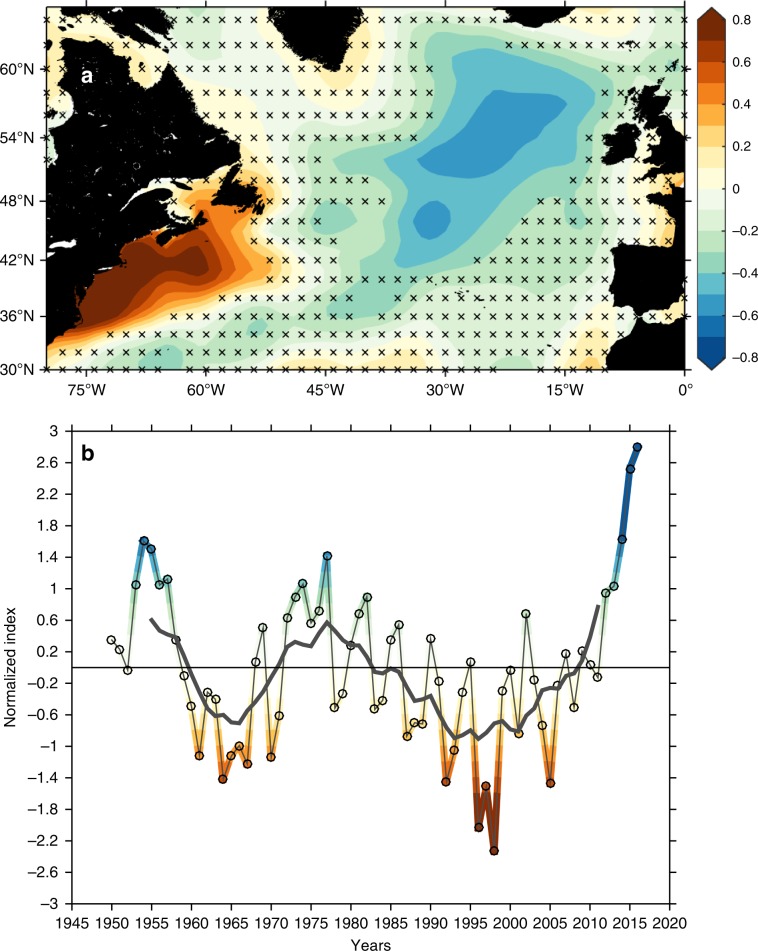
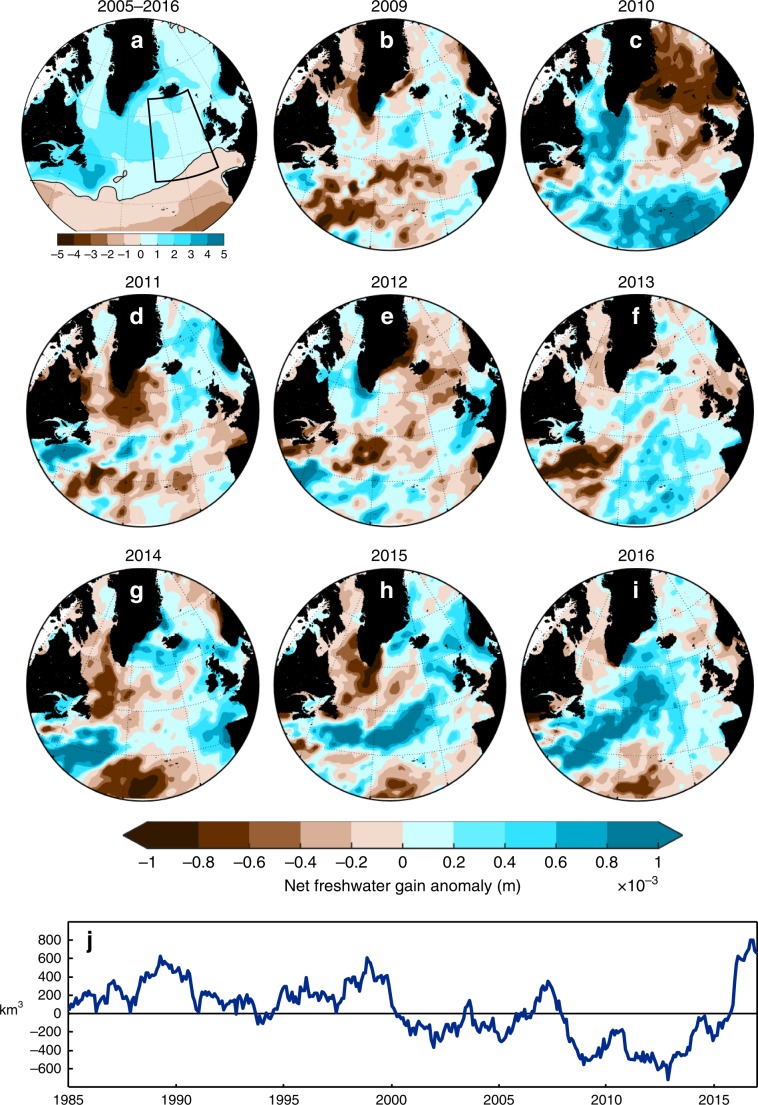
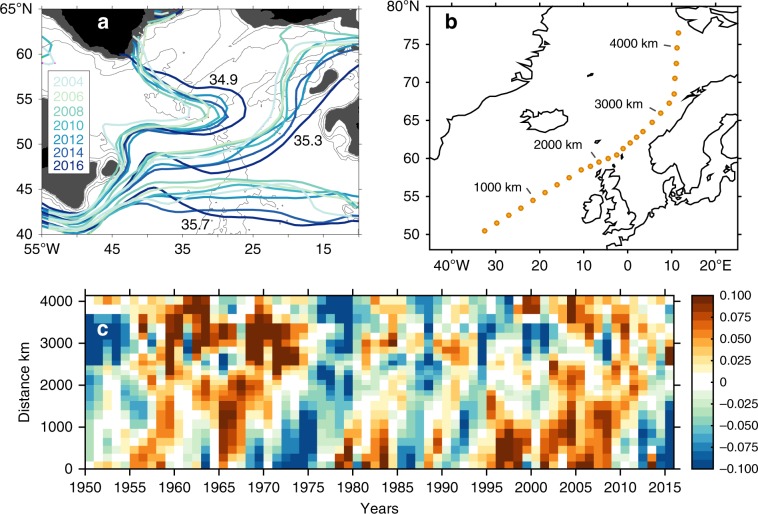
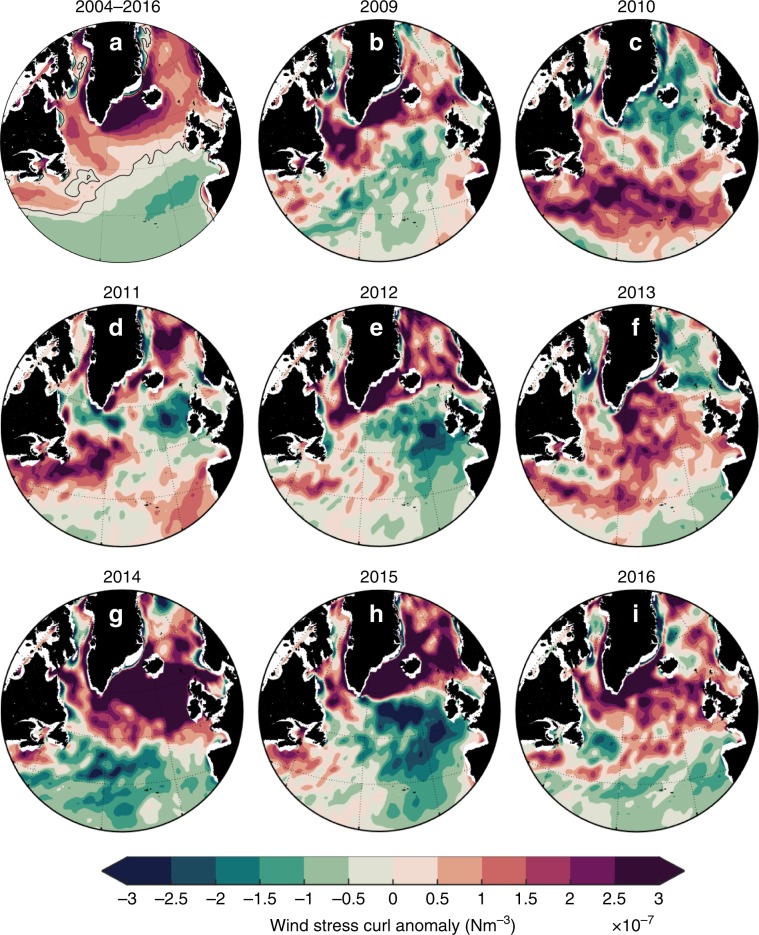
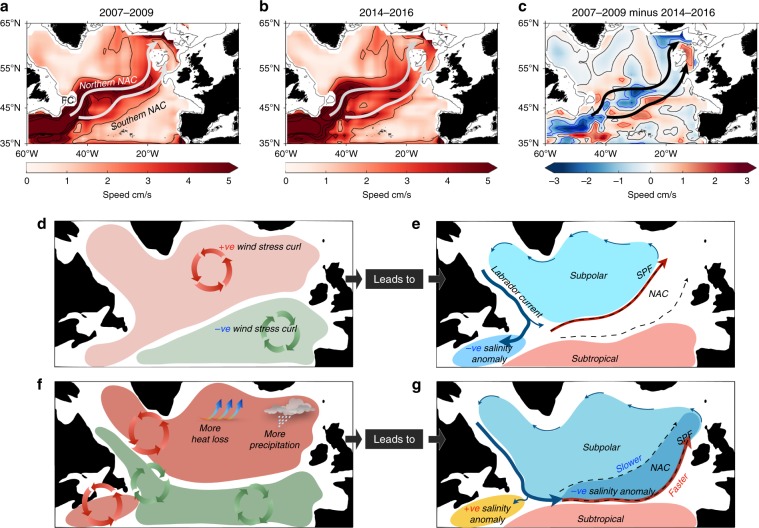
The Atlantic Ocean overturning circulation is important to the climate system because it carries heat and carbon northward, and from the surface to the deep ocean. The high salinity of the subpolar North Atlantic is a prerequisite for overturning circulation, and strong freshening could herald a slowdown. We show that the eastern subpolar North Atlantic underwent extreme freshening during 2012 to 2016, with a magnitude never seen before in 120 years of measurements. The cause was unusual winter wind patterns driving major changes in ocean circulation, including slowing of the North Atlantic Current and diversion of Arctic freshwater from the western boundary into the eastern basins. We find that wind-driven routing of Arctic-origin freshwater intimately links conditions on the North West Atlantic shelf and slope region with the eastern subpolar basins. This reveals the importance of atmospheric forcing of intra-basin circulation in determining the salinity of the subpolar North Atlantic.


Conflict of interest statement

The authors declare no competing interests.

Figures

Fig. 1
Fig. 1. North Atlantic circulation, surface salinity and changing freshwater content.
a mean circulation of the North Atlantic Ocean illustrated with mean surface current vectors overlain by schematic representation of major currents including the North Atlantic Current (NAC), East Reykjanes Ridge Current (ERRC) East Greenland Current (EGC), West Greenland Current (WGC), Labrador Current (LC) and Mann Eddy (ME); b mean surface salinity field from the EN4 dataset (2004–2016) with major bathymetric features labelled, including Labrador Sea (LS), Irminger Sea (IrS), Reykjanes Ridge (RR), Iceland Basin (IB), Rockall Trough (RT), Flemish Cap (FC), Grand Banks (GB) and Newfoundland Basin (NFB), the Extended Ellett Line (EEL) and OVIDE sections (blue lines), and the M4 mooring (blue star); c annual time series of subpolar North Atlantic freshwater content of the upper 1000 m, derived from the EN4 dataset and integrated over the region 47–65°N, 0–60°W (see Methods). Figure 2, annual salinity anomalies in the 0–200 m layer. Data from the EN4 dataset, mean period (shown top left) is 2005–2016.
Fig. 2
Fig. 2. The mean salinity of the shallow upper ocean in the subpolar North Atlantic, and the evolution of anomalies between 2009 and 2016.
a mean salinity in the 0–200 m depth zone for the period of 2005–2016, computed from the EN4 dataset. bi salinity anomalies of the 0–200 m layer in each year from 2009 to 2016, referenced to the 2005–2016 mean; warm colours represent higher salinity and cool colours are lower salinity. In 2012 a strong negative salinity anomaly developed in the Newfoundland Basin, and by 2016 it had propagated to the Iceland Basin and Rockall Trough. A strong positive anomaly developed in the North West Atlantic continental shelf and slope region during 2014–2016.
Fig. 3
Fig. 3. The mean salinity of the 200–1000 m depth zone of the subpolar North Atlantic, and the evolution of anomalies between 2009 and 2016.
a mean salinity in the 200–1000 m zone for the period of 2005 to 2016, computed from the EN4 dataset. bi salinity anomalies of the 200–1000 m zone in each year from 2009 to 2016, referenced to the 2005–2016 mean; warm colours represent higher salinity and cool colours are lower salinity. Note that the colour scale here is different to that shown in Fig. 2. A strong negative salinity anomaly developed in the Newfoundland Basin in 2014 (2 years later than the 0–200 m negative anomaly), and by 2016 it had propagated to the Iceland Basin and Rockall Trough. A positive anomaly developed in the North West Atlantic continental shelf and slope region during 2014–2016.
Fig. 4
Fig. 4. Time series records of North Atlantic salinity.
a annual mean upper ocean salinity from repeat hydrography sections in the Faroe Shetland Channel (North Atlantic Water salinity core, 0–200 m at 61°N 3°W), Rockall Trough (30–800 m at 57.5°N 11.0°W), Faroe Bank Channel (North Atlantic Water salinity core at 61.4°N 8.3°W) and Iceland Basin (Station Selvogsbanki 5, 63.0°N 21.5°W, 0–200 m), grey boxes indicate the Great Salinity Anomaly; b annual upper ocean (0-500 m) salinity anomaly (from seasonal means) from the interior Labrador Sea; c annual sea surface salinity records from the Iceland Basin (irregular polygon approximately 52-64°N, 10–20°W, thin lines indicate measurement error estimate); d Time-longitude plot of sea surface salinity anomaly at 60°N between Greenland and the Hebridean Shelf (mean is computed over 1993-2017, contour interval 0.1 psu, solid black line is zero). e A 2-year continuous record (2014–2016) of salinity observations at depths between 50 and 500 m at the M4 OSNAP mooring in the Iceland Basin (58.0°N, 21.1°W).
Fig. 5
Fig. 5. Detailed spatial structure of the salinity anomalies.
ae salinity anomalies at the Extended Ellett Line (EEL) annually repeated hydrography section (mean period is 2004–2017); (f) Potential temperature vs. salinity for EEL sections in 2012, 2015 and 2016 in the east Iceland Basin (located at 400–550 km, excluding seasonally-warmed upper 50 m); gh salinity anomalies at the OVIDE section in May–June 2014 and May–June 2016 (mean period is 2002–2012, colour scale is same as ae). Location of North Atlantic Current (NAC) and East Reykjanes Ridge Current (ERRC) branches closely tied to topography are indicated. Locations of the sections are shown in Fig. 1b.
Fig. 6
Fig. 6. The leading empirical orthogonal function mode based on EN4 0-200 m annual mean salinity in the North Atlantic since 1950.
This leading mode explains 31.7% of the variance. a Correlation analysis between the first principal component and the 0–200 m salinity field. Crosses indicate insignificance. b Salinity first principal component (coloured) overlaid by the 11-year running mean (thick grey). Positive phases (blue colours) project onto a dipole pattern with fresher eastern subpolar North Atlantic basins and more saline North West Atlantic Continental Shelf and Slope region, and vice versa.
Fig. 7
Fig. 7. Freshwater input from the atmosphere.
a 2005–2016 mean net freshwater gain by the ocean (precipitation minus evaporation) from ERA-Interim dataset. bi 2009–2016 annual anomalies referenced to the mean j a 5-year moving sum of monthly net precipitation anomalies (from 1981-2010 mean) integrated over the region 45–65°N, 30–10°W (box outlined in a).
Fig. 8
Fig. 8. Changing distribution of surface salinity.
a Annual mean locations of the 34.9, 35.3 and 35.7 isohalines in the upper 500 m layer, from 2004 to 2016 (from EN4, see colour key inset); b Station locations for salinity anomalies shown in lower panel; c Time-distance plot of 0–200 m annual salinity anomalies (mean period 1950–2016) along the approximate advection pathway of the North Atlantic Current, illustrating the 4–6 year propagation time for positive and negative anomalies from the subpolar North Atlantic and through the Nordic Seas (EN4).
Fig. 9
Fig. 9. Changes in winter wind stress curl.
a 2005–2016 mean winter (DJFM) wind stress curl computed from the ERA-Interim reanalysis. bi Annual anomalies of winter wind stress curl reference to the 2009–2016 mean. The same colour scale is used for all panels.
Fig. 10
Fig. 10. Changed ocean circulation in response to atmospheric forcing.
ac Geostrophic current speed at 200 m during a mean of 2007–2009; b mean of 2014–2016; c difference between the two periods [(2014–2016)–(2007–2009)]. Speed calculated from geostrophic velocity at 200 m computed from EN4 data, with zero reference velocity at 1200 m. dg schematic summary of atmospheric and oceanic processes that impact the salinity and freshwater content of the subpolar region; d the mean pattern of windstress curl in 2005–2009 with positive curl over the subpolar region and negative to the southeast; e the resulting mean ocean circulation with a cyclonic subpolar gyre, the North Atlantic Current (NAC) zone following the zone of zero and low windstress curl, the Subpolar Front (SPF) located in the northern NAC zone, and the Labrador Current follow a primary pathway along the edge of the continental shelf; f wind stress curl pattern in 2014–2016, with stronger positive curl over the subpolar North Atlantic associated with increased heat loss and increased net precipitation, and a zone of negative curl over the Labrador and Newfoundland shelf and Newfoundland Basin; g the resulting ocean circulation in 2014–2016 with the Labrador Current following a new primary pathway into the NAC zone, the SPF shifted to the south, a slower northern NAC zone and faster southern NAC zone, and the resulting positive salinity anomaly in the North West Atlantic Continental Shelf and Slope region and negative salinity anomaly in the eastern Subpolar region.

References

    1. Buckley MW, Marshall J. Observations, inferences, and mechanisms of the Atlantic Meridional Overturning Circulation: a review. Rev. Geophysics. 2016;54:5–63. doi: 10.1002/2015RG000493. - DOI
    1. Ferreira D, et al. Atlantic-Pacific asymmetry in deep water formation. Annu. Rev. Earth Planet. Sci., Vol. 46. 2018;46:327–352. doi: 10.1146/annurev-earth-082517-010045. - DOI
    1. Gelderloos R, Straneo F, Katsman CA. Mechanisms behind the temporary shutdown of deep convection in the Labrador Sea: lessons from the Great Salinity Anomaly Years 1968-71. J. Clim. 2012;25:6743–6755. doi: 10.1175/JCLI-D-11-00549.1. - DOI
    1. Böning CW, Behrens E, Biastoch A, Getzlaff K, Bamber JL. Emerging impact of Greenland meltwater on deepwater formation in the North Atlantic Ocean. Nat. Geosci. 2016;9:523–52. doi: 10.1038/ngeo2740. - DOI
    1. Yang, Q. et al. Recent increases in Arctic freshwater flux affects Labrador Sea convection and Atlantic overturning circulation. Nat. Commun.7, 10.1038/ncomms10525 (2016). - PMC - PubMed