. 2020 Jan 29;10(1):1438.
doi: 10.1038/s41598-020-57657-9.

Activation of pH-Sensing Receptor OGR1 (GPR68) Induces ER Stress Via the IRE1α/JNK Pathway in an Intestinal Epithelial Cell Model

Affiliations

Activation of pH-Sensing Receptor OGR1 (GPR68) Induces ER Stress Via the IRE1α/JNK Pathway in an Intestinal Epithelial Cell Model

Chiaki Maeyashiki et al. Sci Rep. .

Abstract

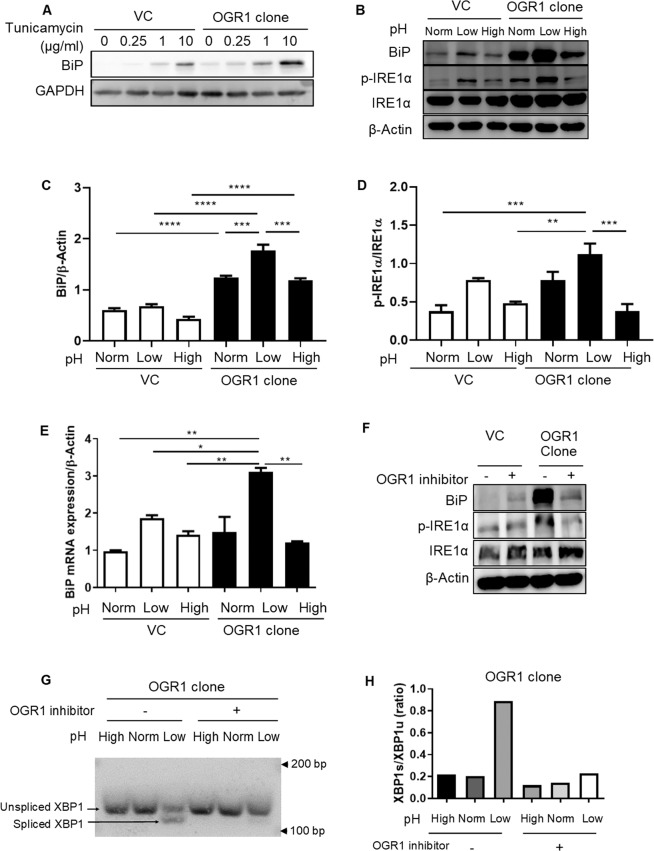
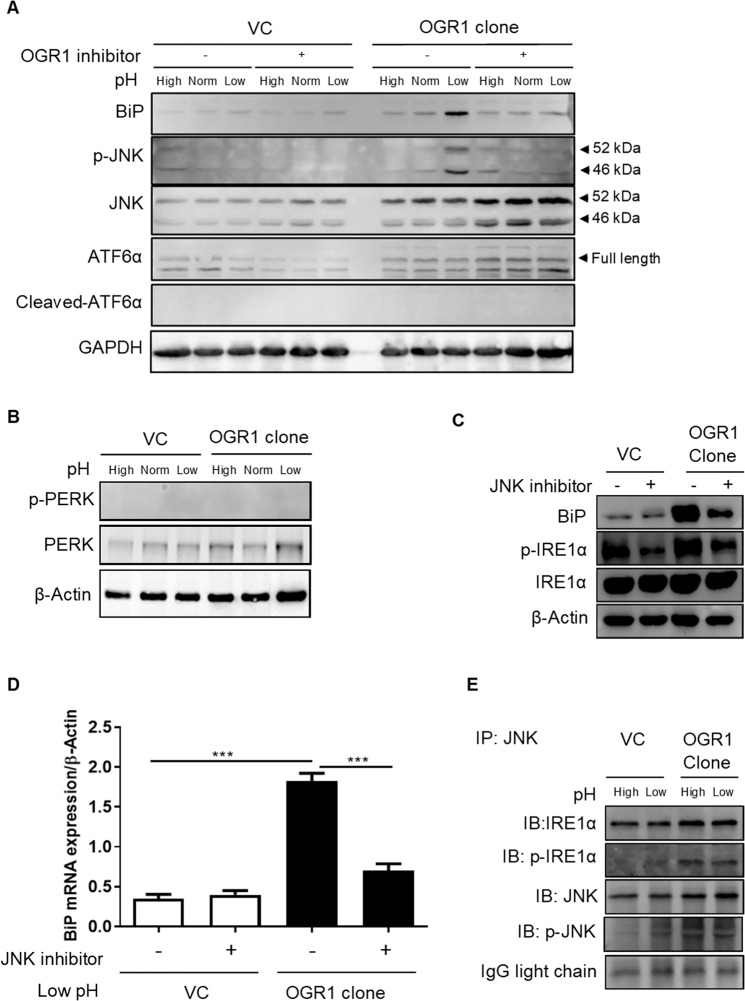
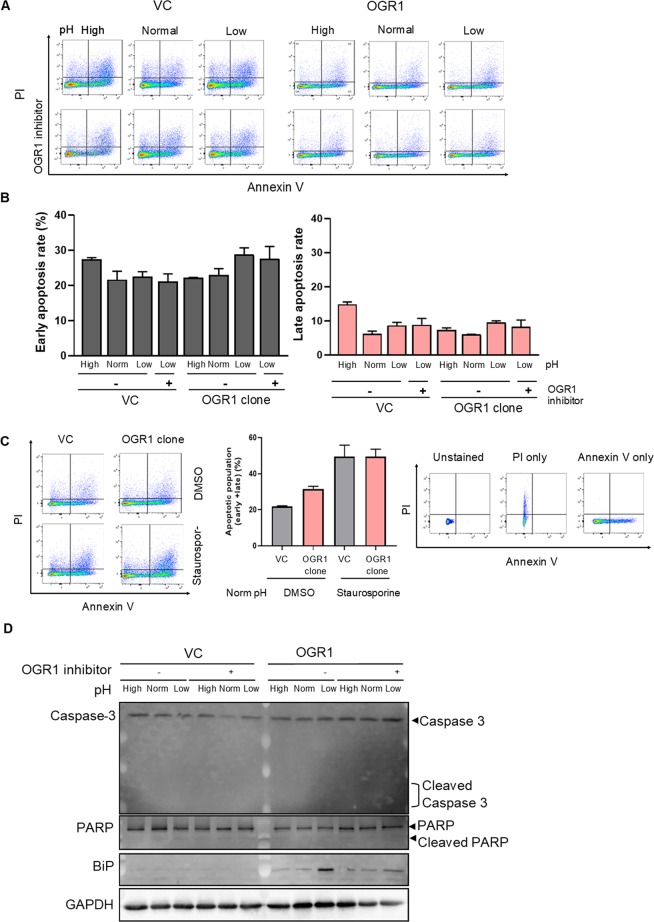
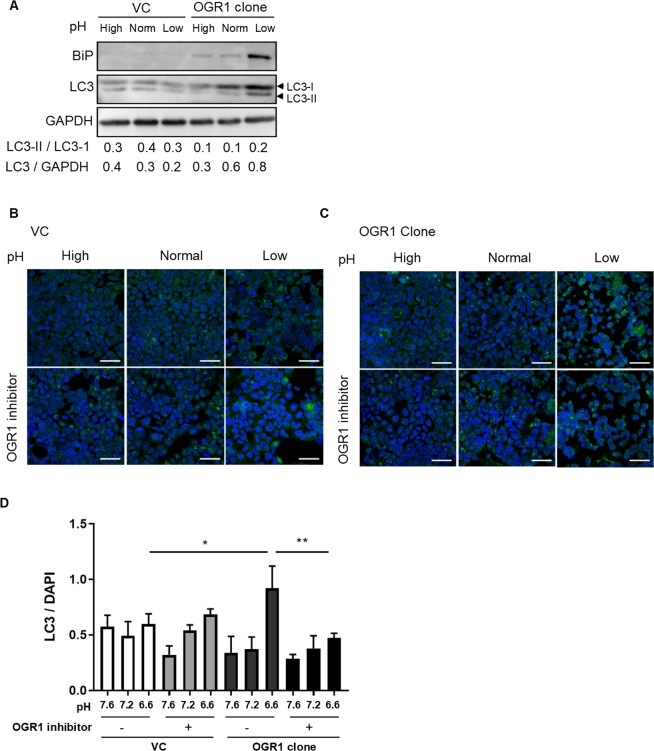
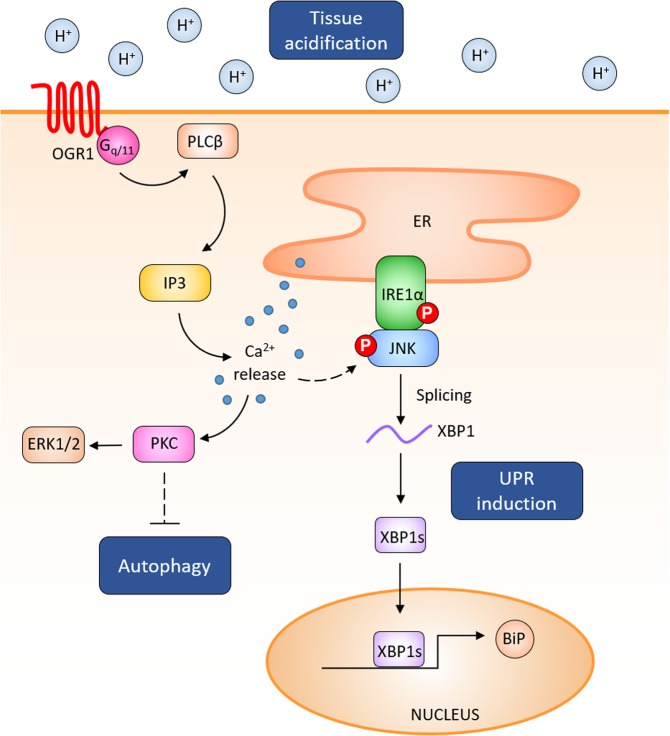
Proton-sensing ovarian cancer G-protein coupled receptor (OGR1) plays an important role in pH homeostasis. Acidosis occurs at sites of intestinal inflammation and can induce endoplasmic reticulum (ER) stress and the unfolded protein response (UPR), an evolutionary mechanism that enables cells to cope with stressful conditions. ER stress activates autophagy, and both play important roles in gut homeostasis and contribute to the pathogenesis of inflammatory bowel disease (IBD). Using a human intestinal epithelial cell model, we investigated whether our previously observed protective effects of OGR1 deficiency in experimental colitis are associated with a differential regulation of ER stress, the UPR and autophagy. Caco-2 cells stably overexpressing OGR1 were subjected to an acidic pH shift. pH-dependent OGR1-mediated signalling led to a significant upregulation in the ER stress markers, binding immunoglobulin protein (BiP) and phospho-inositol required 1α (IRE1α), which was reversed by a novel OGR1 inhibitor and a c-Jun N-terminal kinase (JNK) inhibitor. Proton-activated OGR1-mediated signalling failed to induce apoptosis, but triggered accumulation of total microtubule-associated protein 1 A/1B-light chain 3, suggesting blockage of late stage autophagy. Our results show novel functions for OGR1 in the regulation of ER stress through the IRE1α-JNK signalling pathway, as well as blockage of autophagosomal degradation. OGR1 inhibition might represent a novel therapeutic approach in IBD.


Conflict of interest statement

The authors declare no competing interests.

Figures

Figure 1
Figure 1
ER stress is induced by acidosis activated OGR1-mediated signalling. Caco-2 cells were subjected to different pH medium, following 4–6 h incubation in pH 7.6 serum free medium. (A) Vector control Caco-2 (VC) and OGR1 overexpressing Caco-2 cells where treated with tunicamycin at the indicated concentrations for 24 h. Total protein was isolated and Western blotting was performed. The results are representative of two independent experiments. (B) After 24 h pH shift, total protein was isolated and Western blotting was performed. The results are representative of three independent experiments. (C) Densitometry after normalization of BiP to β-actin and (D) p-IRE1α to total IRE1α. Statistical analysis was performed using one-way ANOVA followed by Tukey’s post-test. Data are presented as means ± SE of three independent experiments (*p < 0.05; **p < 0.01; ***p < 0.001; ****p < 0.0001). (E) After 24 h pH shift, total RNA was isolated and mRNA expression was investigated by qPCR. Statistical analysis was performed using one-way ANOVA followed by Tukey’s post-test. Data are presented as means ± SE of three independent experiments (*p < 0.05; **p < 0.01). (F) A specific small molecule OGR1 inhibitor (10 µM) was tested and the cells were subjected to low pH for 24 h, following 4–6 h incubation in pH 7.6 serum free medium. After 24 h pH shift, total protein was isolated and Western blot performed. Results are representative of two independent experiments. (G) Cells were treated as described in (F), then total RNA was extracted and analysed for expression of XBP1 (XBP1u) and spliced XBP1 (XBP1s) by conventional PCR. Results are representative of three independent experiments. (H) Quantification of the ratio of XBP1s/XBP1u was performed using ImageJ. Results are representative of two independent experiments. Statistical analysis was performed using one-way ANOVA followed by Tukey’s post-test. Data are presented as means ± SE of three independent experiments (*p < 0.05; **p < 0.01; ***p < 0.001; ****p < 0.0001). For all the panels, the experiments were repeated two to three times. pH conditions: High pH 7.5–7.8; Normal pH 7.2–7.4; Low pH 6.6–6.8.
Figure 2
Figure 2
ER stress is induced by OGR1 via IRE1α/JNK signalling. (A) Caco-2 cells were subjected to different pH medium, with or without an OGR1 inhibitor (10 µM), following 4–6 h in pH 7.6 serum free medium. After 24 h pH shift, total protein was isolated and Western blot performed. Results are representative of two independent experiments. (B) Caco-2 cells were subjected to different pH medium After 24 h pH shift, total protein was isolated and Western blot performed. Results are representative of two independent experiments. (C) Caco-2 cells were subjected to different pH medium with or without a JNK inhibitor (10 µM) following 4–6 h in pH 7.6 serum free medium. After 24 h pH shift, total protein was isolated and Western blot performed. Results are representative of two independent experiments. (D) Caco-2 cells were starved and subjected to an acidic pH with or without a JNK inhibitor as described in (C). After 24 h pH shift, total RNA was isolated and mRNA expression was investigated by qPCR. Statistical analysis was performed using one-way ANOVA followed by Tukey’s post-test. Data are presented as means ± SE of three independent experiments (***p < 0.001). (E) Caco-2 cells were starved and subjected to different pH medium following 4–6 h in pH 7.6 serum free medium. After 24 h pH shift, total protein was isolated and co-IP using IRE1α antibody and JNK antibody was performed, followed by immunoblotting. Results are representative of two independent experiments. pH conditions: High pH 7.5–7.8; Normal pH 7.2–7.4; Low pH 6.6–6.8.
Figure 3
Figure 3
Apoptosis is not induced by acidosis activated OGR1-mediated signalling. (A,B) Caco-2 cells were subjected to different pH medium for 24 h, with or without an OGR1 inhibitor (10 µM), following 4–6 h in pH 7.6 serum free medium. Flow cytometric analysis of the percentage of annexin V-FITC and propidium iodide positive cells was performed. pH conditions: High pH 7.6–7.7; Normal pH 7.2–7.3; Low pH 6.6–6.7. Annexin V + PI- are early apoptotic cells and annexin V + PI + are late apoptotic cells. (C) Caco-2 cells were subjected to normal pH medium for 24 h, following 4–6 h in pH 7.6 serum free medium, with negative control (DMSO) or positive control staurosporine (1 µM) and flow cytometric analysis was performed. Staining controls; unstained or stained with either annexin V-FITC or propidium iodide. After 10 min incubation, flow cytometric analysis. Quantification was performed using FlowJo software. For all the panels, the experiments were repeated two to three times. (D) Caco-2 cells were treated as described for (A). After 24 h pH shift, total protein was isolated and Western blotting was performed. pH conditions: High pH 7.5–7.8; Normal pH 7.2–7.4; Low pH 6.6–6.8.
Figure 4
Figure 4
Autophagy is blocked by acidosis activated OGR1. (A) Caco-2 cells were subjected to different pH medium, following 4–6 h incubation in pH 7.6 serum free medium. After 24 h pH shift, total protein was isolated and Western blotting was performed. Autophagy was measured by variations in the ratio of LC3-II/LC3-I and the total amount of LC3 (LC3-I plus LC3-II) relative to GAPDH. Results are representative of two independent experiments. (B,C) Caco-2 cells were subjected to different pH medium, with or without OGR1 inhibitor (10 µM, following 4–6 h incubation in pH 7.6 serum free medium.) After 24 h pH shift, cells were fixed in 4% paraformaldehyde and stained with an anti-LC3 antibody. Cells were analysed by immunofluorescence microscopy and images were acquired under a confocal laser microscope. Results are representative of three independent experiments. Scale bars indicate 50 µm. (D) Quantification of the ratio of LC3/DAPI is presented. Changes in LC3 accumulation were calculated relative to DAPI staining from at least 4 areas. Statistical analysis was performed using one-way ANOVA followed by Tukey’s post-test. Data are presented as means ± SE of three independent experiments (*p < 0.05; **p < 0.01). pH conditions: High pH 7.5–7.8; Normal pH 7.2–7.4; Low pH 6.6–6.8.
Figure 5
Figure 5
OGR1 activation triggers the expression of the ER stress marker BiP through the JNK/IRE1α signalling pathway. Following acidic activation of OGR1, JNK and the UPR molecule IRE1α are phosphorylated and induce downstream XBP1 splicing, which in turn leads to the expression of the ER stress marker BiP in IECs. Acidic activation of OGR1 leads to the blockage of late stage autophagy.

Similar articles

Cited by

References

    1. Gatenby RA, Gillies RJ. Why do cancers have high aerobic glycolysis? Nat Rev Cancer. 2004;4:891–899. doi: 10.1038/nrc1478. - DOI - PubMed
    1. Huang WC, Swietach P, Vaughan-Jones RD, Ansorge O, Glitsch MD. Extracellular acidification elicits spatially and temporally distinct Ca2+ signals. Curr Biol. 2008;18:781–785. doi: 10.1016/j.cub.2008.04.049. - DOI - PubMed
    1. Hunt JF, et al. Endogenous airway acidification. Implications for asthma pathophysiology. Am J Respir Crit Care Med. 2000;161:694–699. doi: 10.1164/ajrccm.161.3.9911005. - DOI - PubMed
    1. Kellum JA. Determinants of blood pH in health and disease. Critical care. 2000;4:6–14. doi: 10.1186/cc644. - DOI - PMC - PubMed
    1. Lardner A. The effects of extracellular pH on immune function. J Leukoc Biol. 2001;69:522–530. - PubMed

MeSH terms