. 2020 Feb;578(7794):266-272.
doi: 10.1038/s41586-020-1961-1. Epub 2020 Jan 29.

Tobacco smoking and somatic mutations in human bronchial epithelium

Affiliations

Tobacco smoking and somatic mutations in human bronchial epithelium

Kenichi Yoshida et al. Nature. 2020 Feb.

Abstract

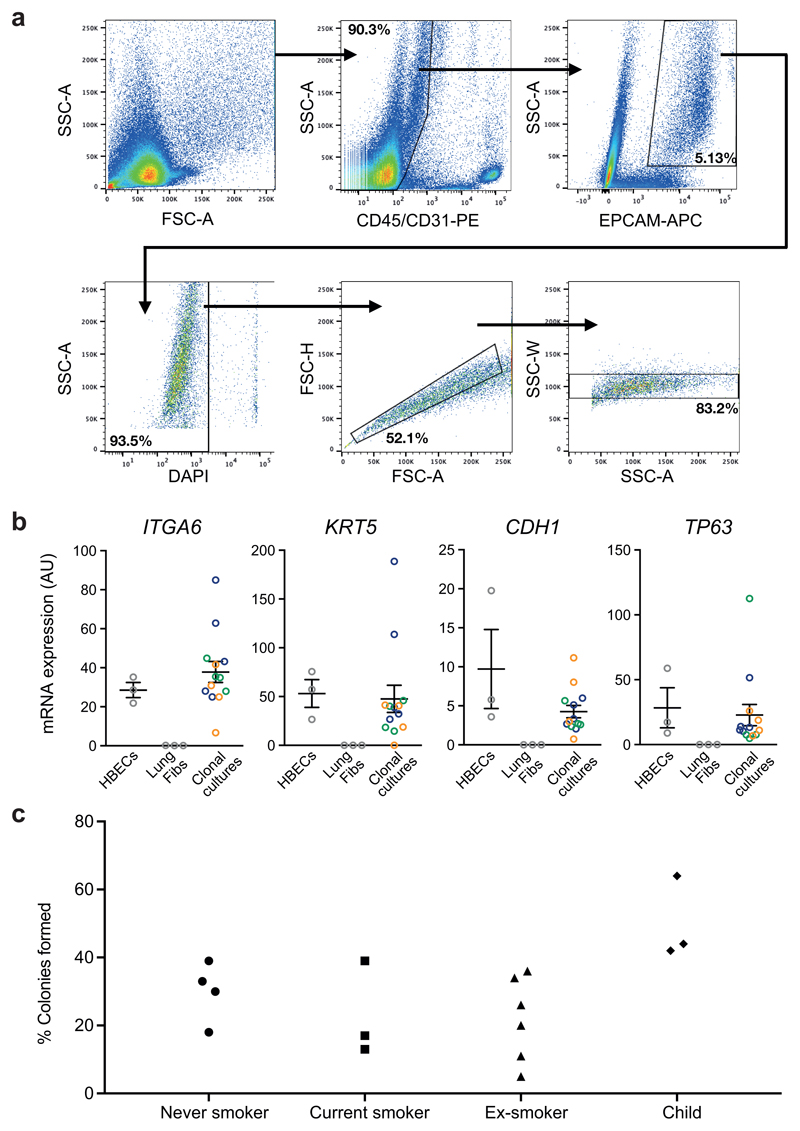
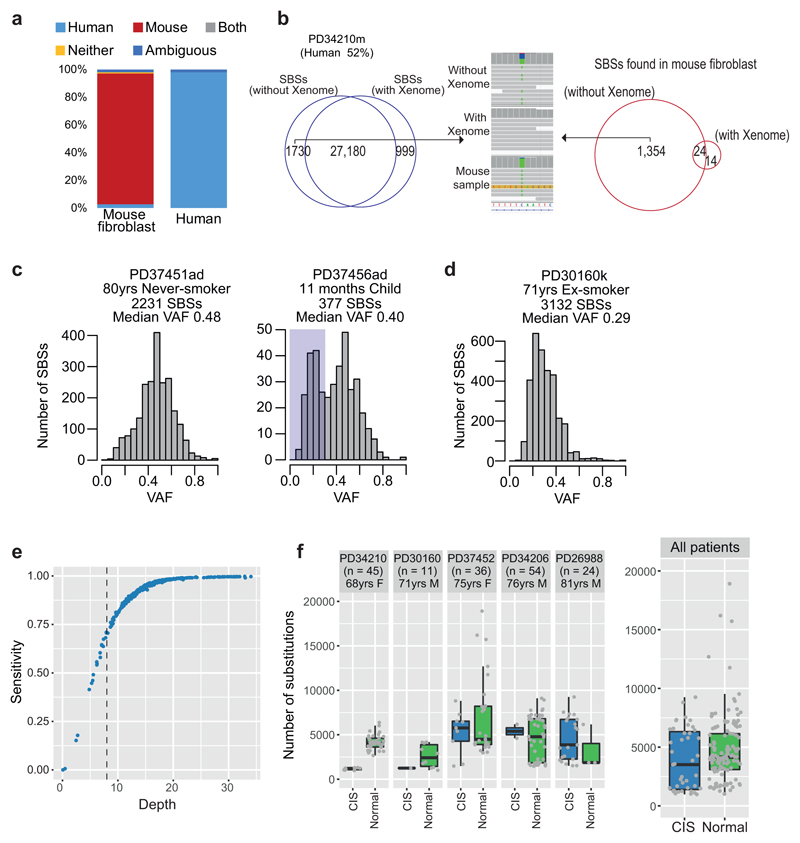
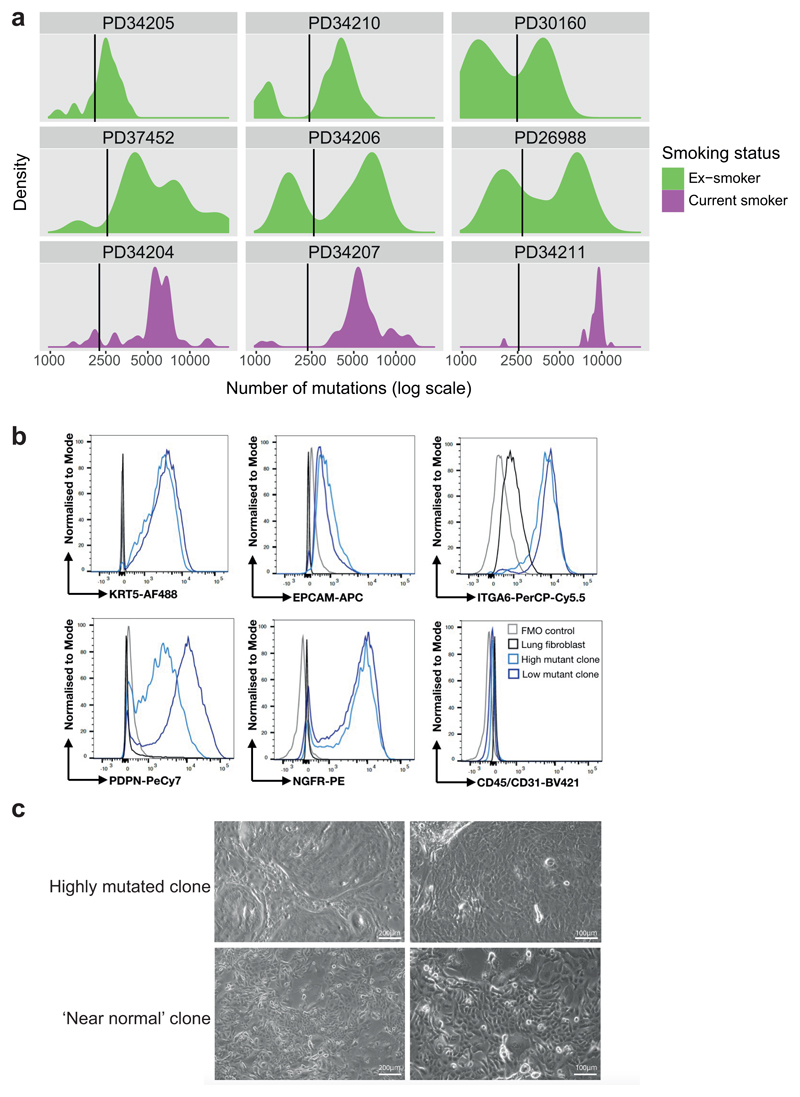
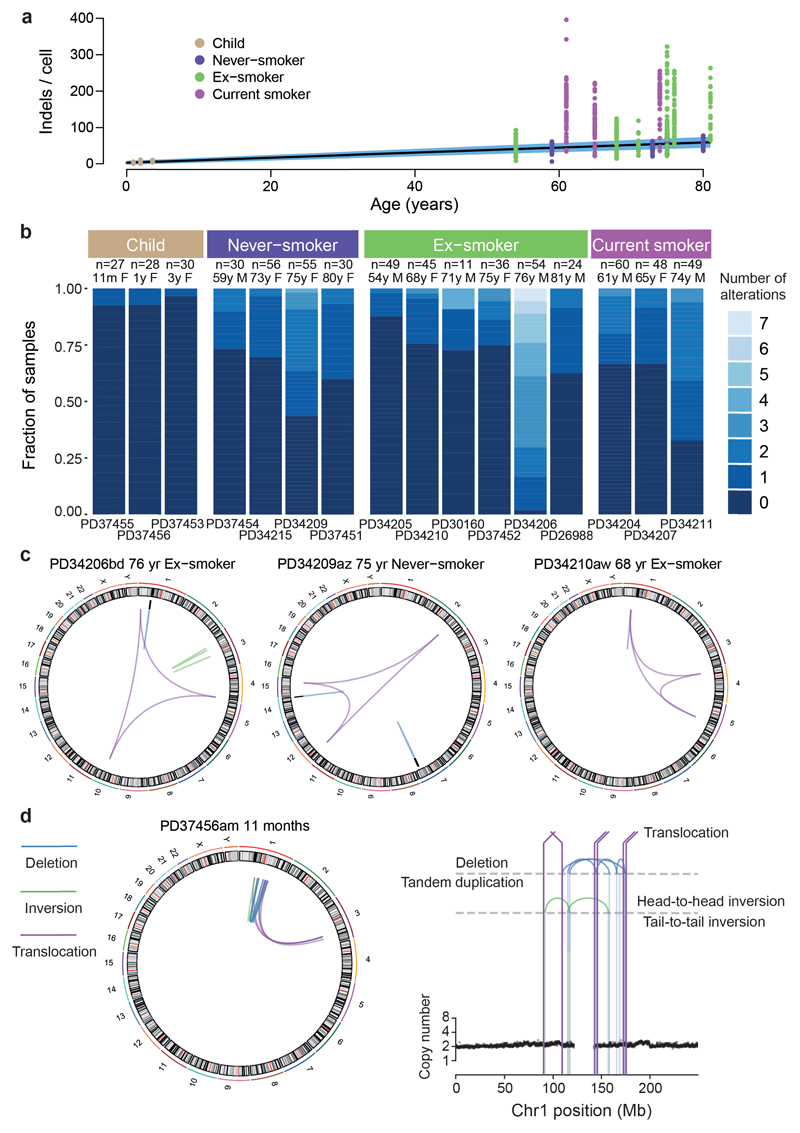
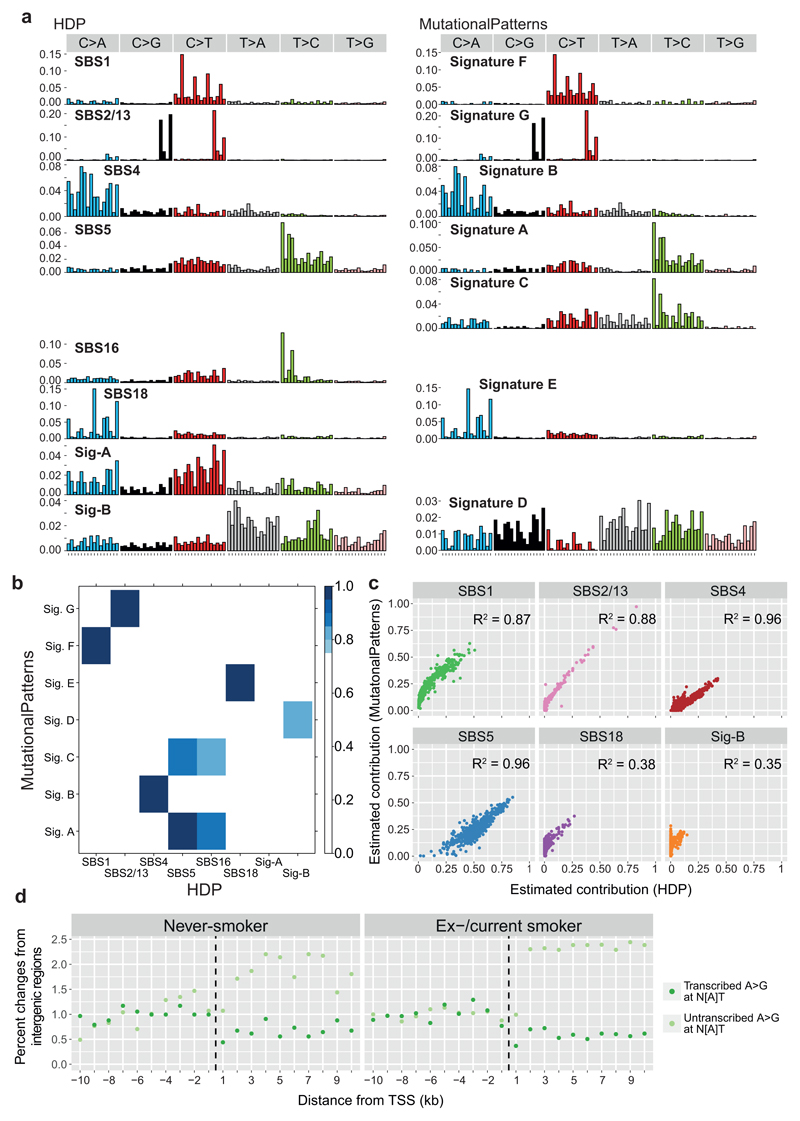
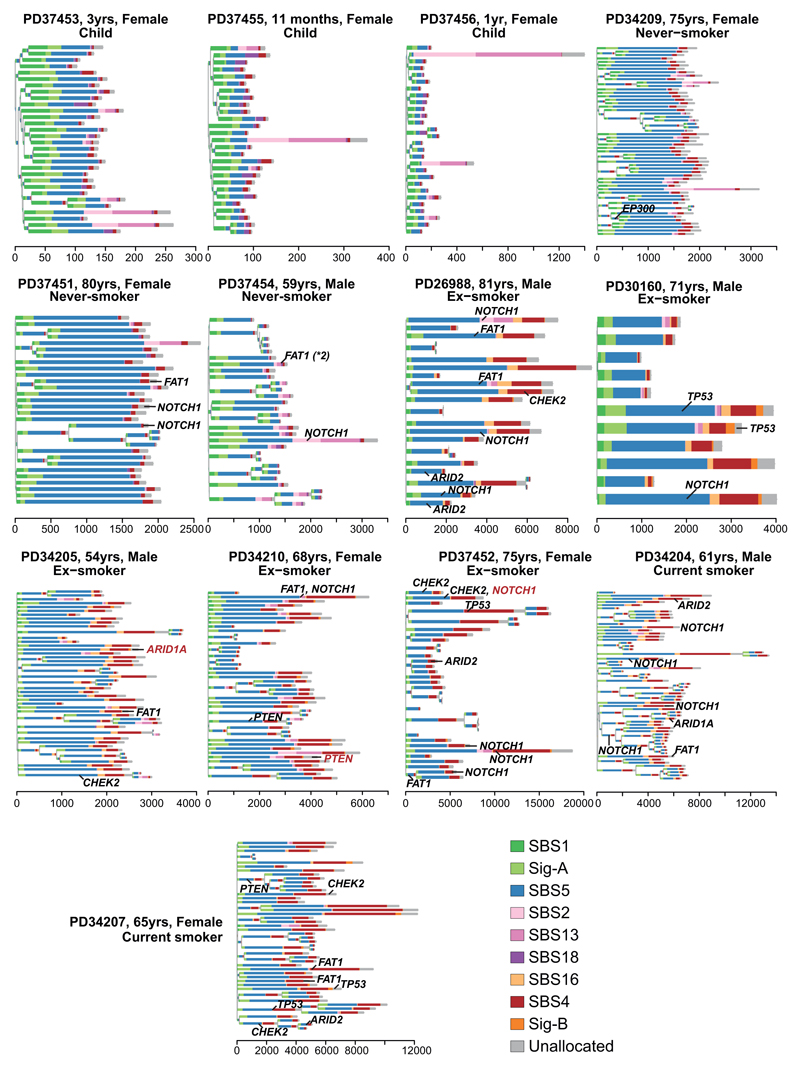
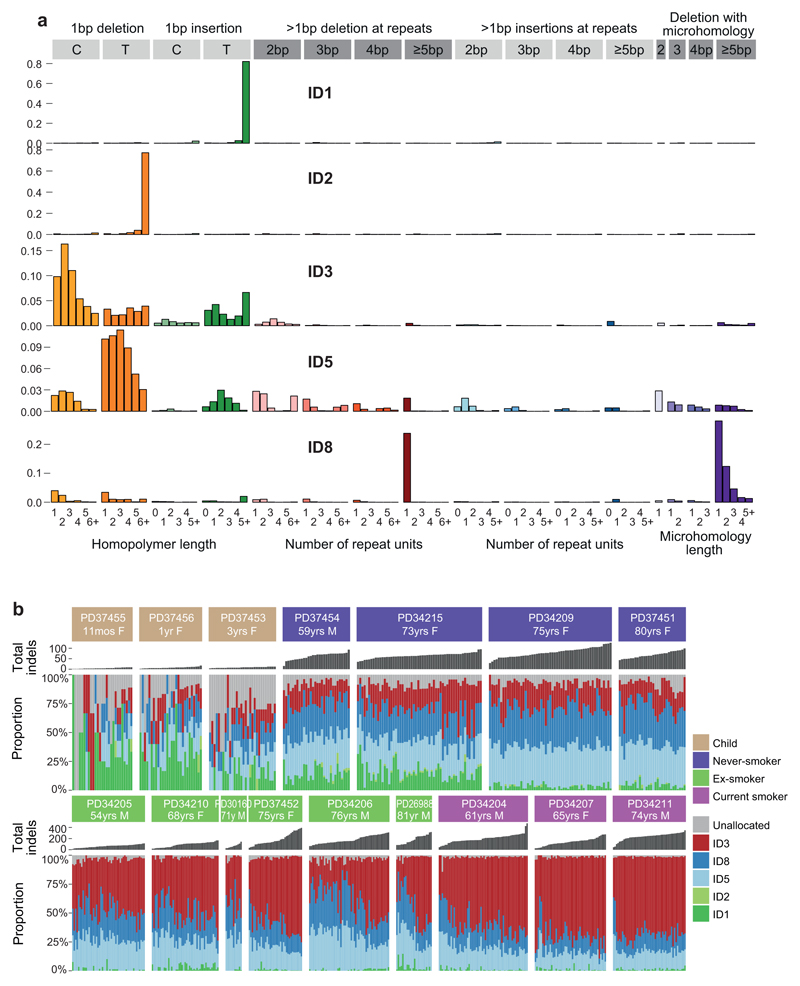
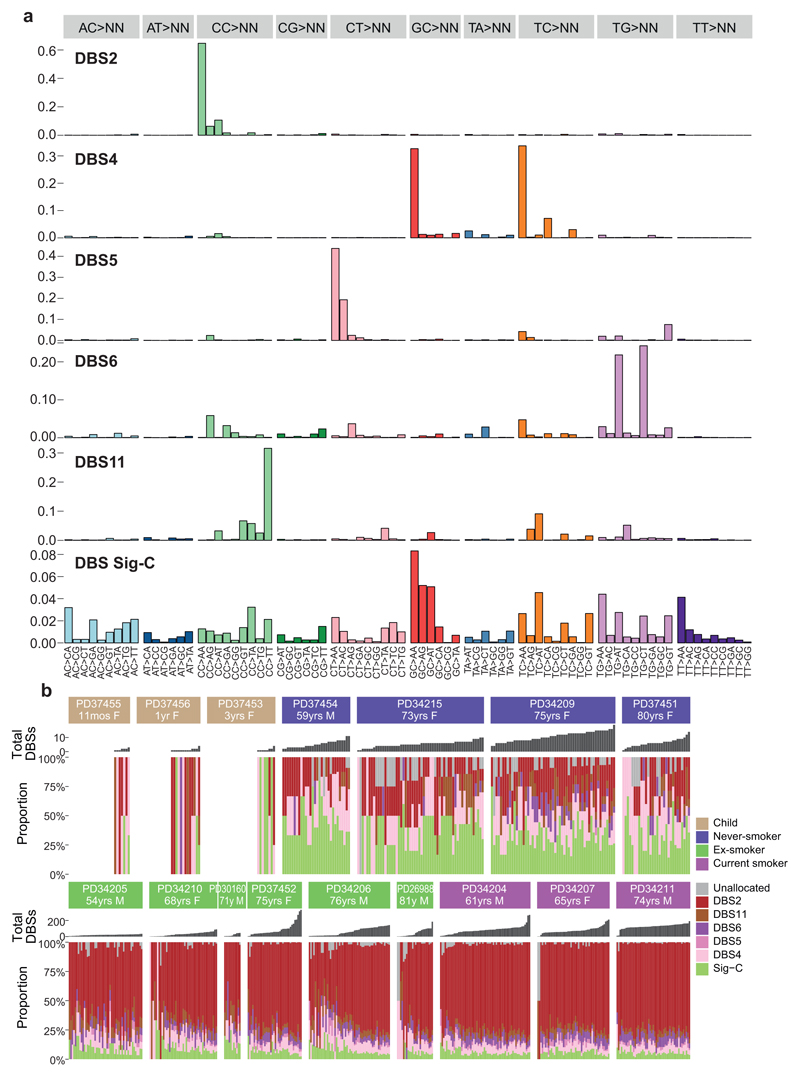
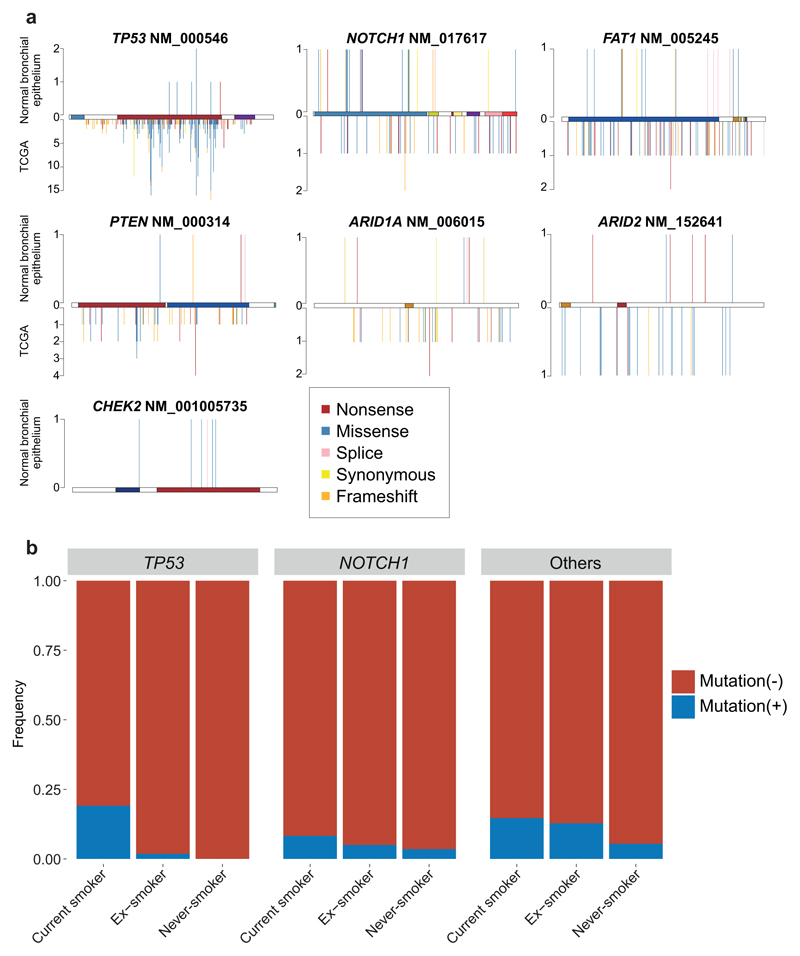
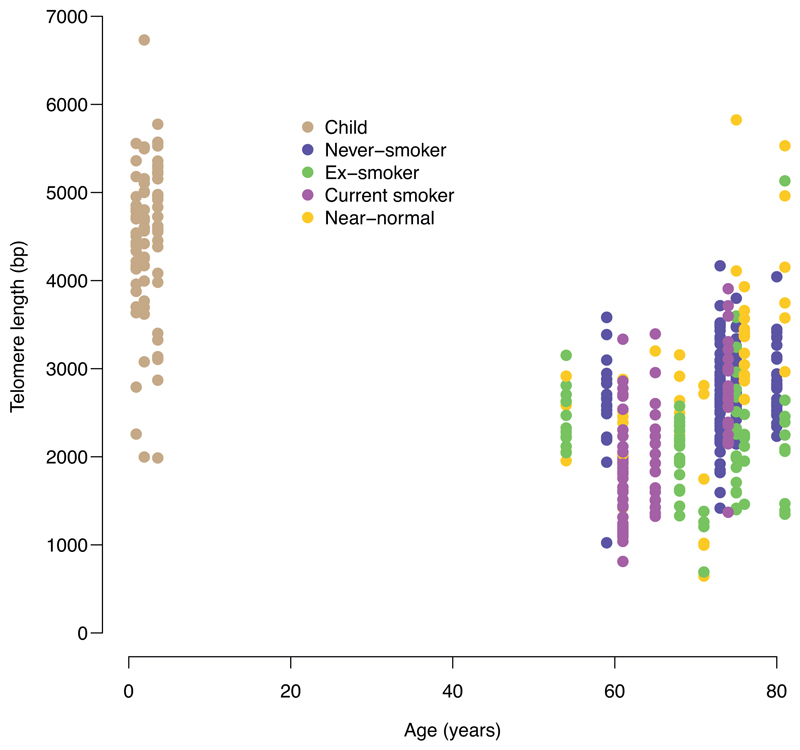
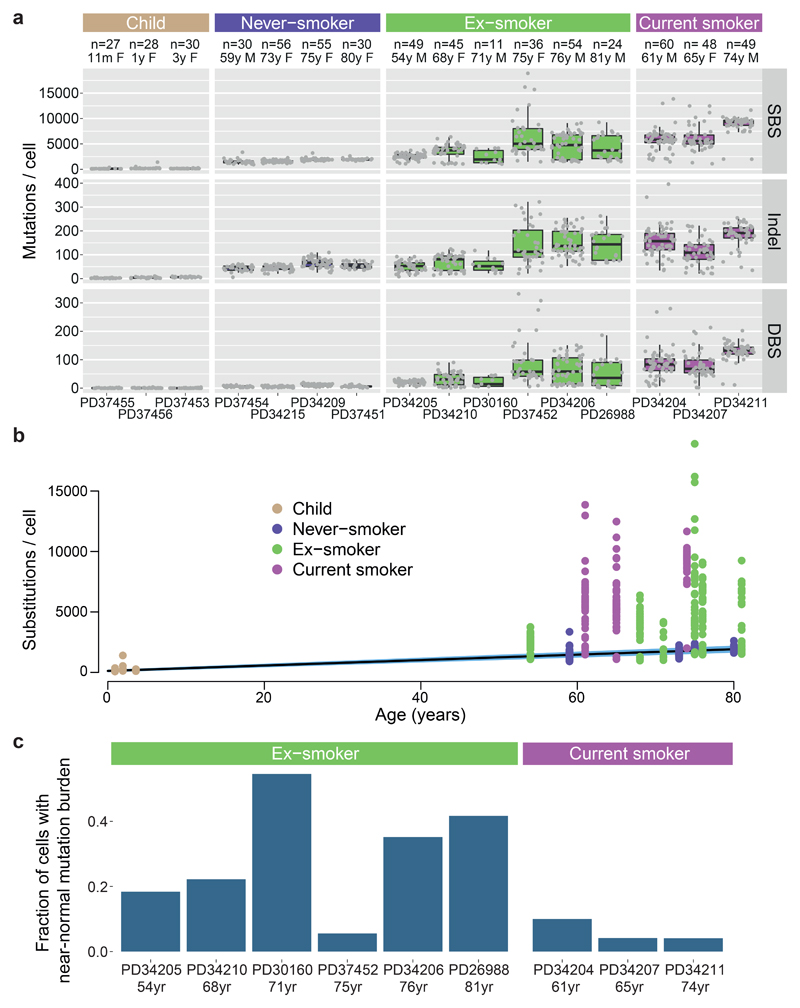
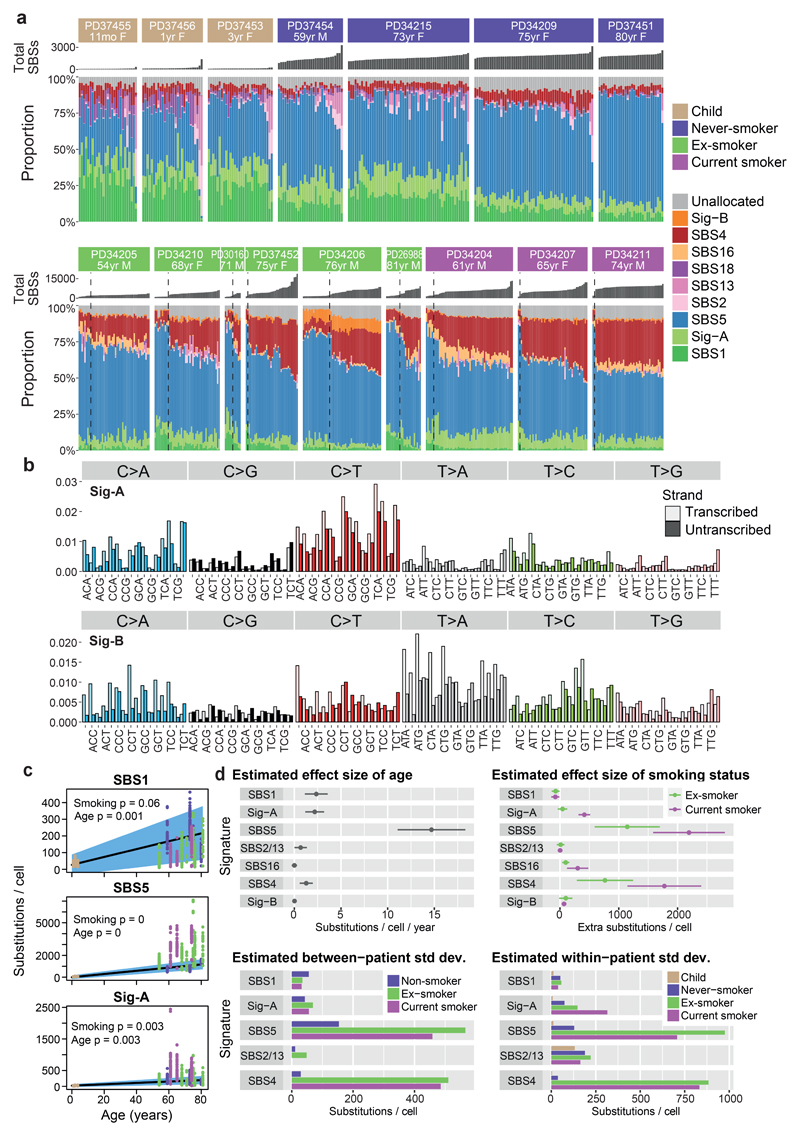
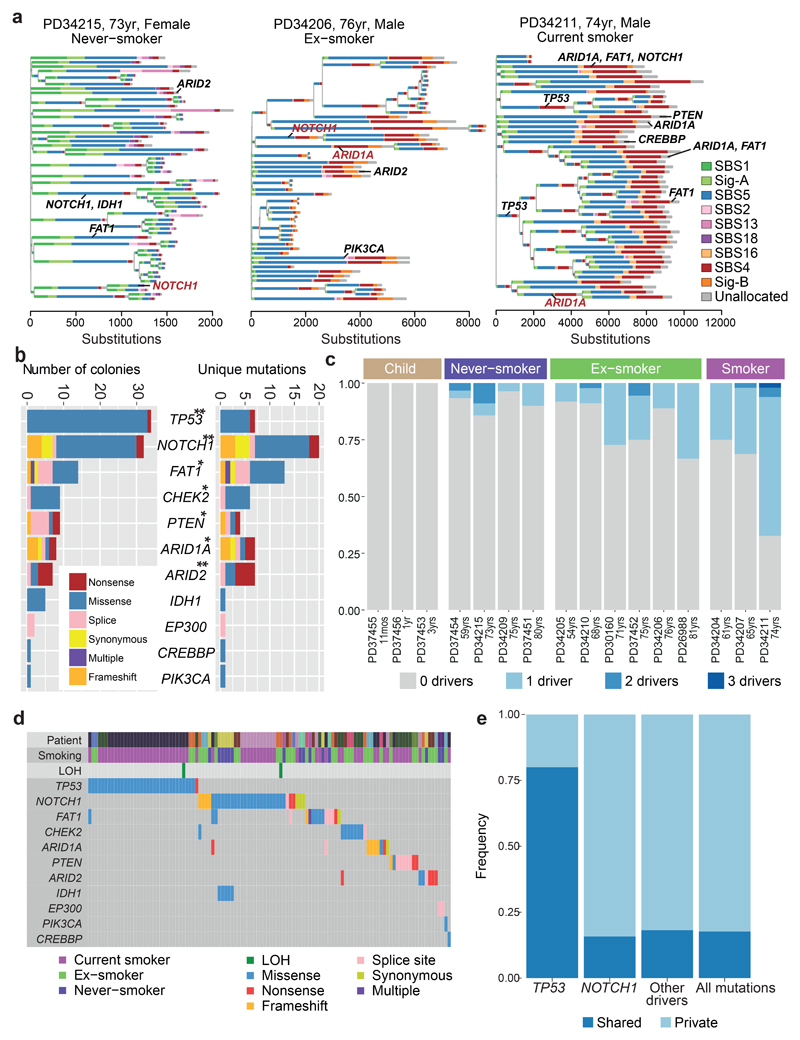
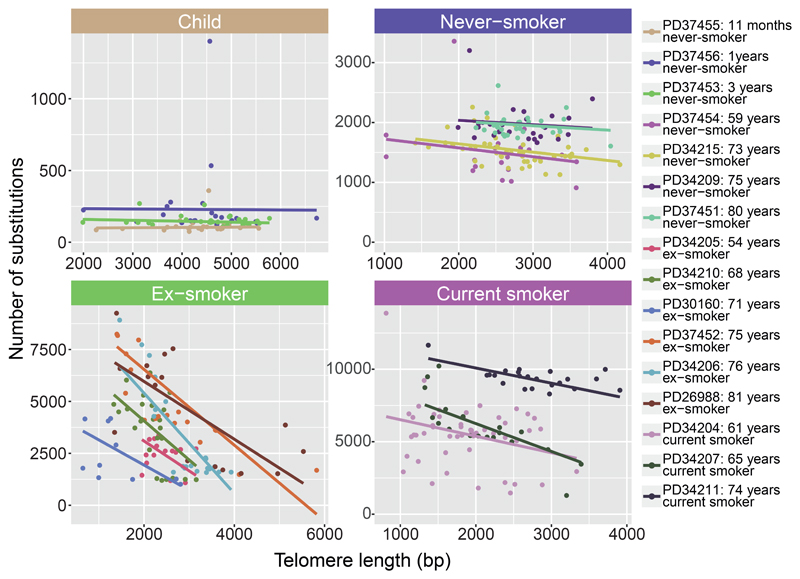
Tobacco smoking causes lung cancer1-3, a process that is driven by more than 60 carcinogens in cigarette smoke that directly damage and mutate DNA4,5. The profound effects of tobacco on the genome of lung cancer cells are well-documented6-10, but equivalent data for normal bronchial cells are lacking. Here we sequenced whole genomes of 632 colonies derived from single bronchial epithelial cells across 16 subjects. Tobacco smoking was the major influence on mutational burden, typically adding from 1,000 to 10,000 mutations per cell; massively increasing the variance both within and between subjects; and generating several distinct mutational signatures of substitutions and of insertions and deletions. A population of cells in individuals with a history of smoking had mutational burdens that were equivalent to those expected for people who had never smoked: these cells had less damage from tobacco-specific mutational processes, were fourfold more frequent in ex-smokers than current smokers and had considerably longer telomeres than their more-mutated counterparts. Driver mutations increased in frequency with age, affecting 4-14% of cells in middle-aged subjects who had never smoked. In current smokers, at least 25% of cells carried driver mutations and 0-6% of cells had two or even three drivers. Thus, tobacco smoking increases mutational burden, cell-to-cell heterogeneity and driver mutations, but quitting promotes replenishment of the bronchial epithelium from mitotically quiescent cells that have avoided tobacco mutagenesis.


Conflict of interest statement

Competing Interests

The authors declare no competing interests.

Figures

Extended Data Figure 1
Extended Data Figure 1. Flow-sorting strategy of single basal bronchial epithelial cells.
(A) Sorting of EpCam+ epithelial cells from human airway biopsies. Human hematopoietic and endothelial cells were stained with antibodies against CD45 and CD31, respectively. Within the population of cells negative for those markers, EpCam-expressing cells were gated. Single, live (DAPI-negative) cells were flow sorted from this population into individual wells of 96-well plates. (B) qPCR analysis of clonally derived airway epithelial cell cultures. Airway basal cells express integrin alpha 6 (ITGA6), keratin 5 (KRT5), e-cadherin (CDH1) and TP63. Expression is shown in clonally derived cell cultures (n = 13 from 3 donors, coloured blue, green and orange) compared to a control bulk human bronchial epithelial cell culture expanded in the same culture conditions and a lung fibroblast cell culture that served as a negative control. Centre values and error bars indicate mean and standard error of the mean, respectively. Conditions in which no expression was detected are shown as 0. (C) Colony-forming efficiency of CD45-/CD31-/EPCAM+ cells after single cell sorting from endobronchial biopsy samples (n = 16). For one ex-smoker, EPCAM was not used to select cells: only CD45-/CD31- cells were sorted – as expected, this is the patient with the lowest colony-forming efficiency.
Extended Data Figure 2
Extended Data Figure 2. Quality assurance of mutation calls.
(A) Stacked bar chart showing the proportion of reads attributed to the human genome, mouse genome, both, neither or with ambiguous mapping for the pure mouse fibroblast feeder line (left) or a pure human sample (right), assessed with the Xenome pipeline. (B) Clean-up of mutation calls using the xenome pipeline for one of the samples more heavily contaminated by the mouse feeder layer. The Venn diagram on the left shows the overlap in mutation calls before and after removing non-human reads by xenome. (C) Histograms of variant allele fraction (VAF) for two representative colonies in the sample set. The plot on the left shows a tight distribution around 50%, as expected for a colony derived from a single cell without contamination. The plot on the right shows a bimodal distribution with one peak at 50% (mutations present in the original basal cell) and a second peak at ~25%, likely representing mutations acquired in vitro during colony expansion. These second peaks at <50% are more evident in colonies from the children, due to the low number of mutations in the original basal cell. (D) Histogram of variant allele fraction (VAF) for a colony seeded by more than one basal cell, leading to a peak <<50%. (E) Estimated sensitivity of mutation calling according to sequencing depth. Heterozygous germline polymorphisms were identified in each subject – for each colony sequenced, we calculated the fraction of these polymorphisms recalled by our algorithms. (F) Comparison of mutation burden in normal bronchial epithelial cells that neighbour a carcinoma in situ (CIS) versus distant from it in 5 patients. Box-and-whisker plots show distribution of mutation burden per colony within each subject, with the boxes indicating median and interquartile range, and the whiskers denoting the range. The overlaid points are the observed mutation burden of individual colonies.
Extended Data Figure 3
Extended Data Figure 3. Colonies with near-normal mutation burden.
(A) Density distribution of mutation burden in cells from ex-smokers (green) and current smokers (purple). The black vertical line shows the threshold for near-normal mutation burden derived for each patient. The x axis is on a log scale. Note the frequently bimodal distribution of mutation burden, especially in the ex-smokers, with the modes separated at the threshold for near-normal mutation burden. (B) Flow cytometric analysis of clones for expression of keratin 5 (KRT5), EPCAM, integrin α6 (ITGA6), podoplanin (PDPN), NGFR and CD45/CD31. Lung fibroblasts are included as a comparison. Fluorescence minus one (FMO) shown. Plots for one clone with near-normal mutation burden and one with increased burden are shown, representative of 5 clones from 1 patient. (C) Brightfield image of expanded clones at passage 3, showing cobblestone epithelial morphology, representative of 5 clones from 1 patient. A clone with elevated mutation burden is shown in the top panels; a clone from an ex-smoker with near-normal mutation burden is shown in the bottom panels. Left image x10 magnification, scale bar = 200 μm and right image x20 magnification, scale bar = 100 μm.
Extended Data Figure 4
Extended Data Figure 4. Indels, copy number changes and structural variants in normal bronchial epithelial cells.
(A) Relationship of burden of indels per cell with age, with points representing individual colonies (n = 632), coloured by smoking status. The black line represents the fitted effect of age on indel burden, estimated from linear mixed effects models after correction for smoking status and within-patient correlation structure. The blue shaded area represents the 95% confidence interval for the fitted line. (B) Stacked bar plot showing the distribution of colonies with 0-7 copy number changes and structural variants across the 16 subjects. (C) Three examples of chromoplexy in normal bronchial cells. Structural variants are shown as coloured arcs joining two positions in the genome around the circumference. The chromoplexy instances all consist of 3 translocations, in purple. (D) An example of chromothripsis in a cell from an 11-month old infant. The plot on the right shows copy number of genomic windows in the relevant region of chromosome 1 (black points), with the lines and arcs denoting positions of observed structural variants.
Extended Data Figure 5
Extended Data Figure 5. Comparison of mutational signatures extracted using two algorithms.
(A) Trinucleotide contexts for the signatures extracted by the hierarchical Dirichlet process (HDP) on the left and MutationalPatterns non-negative matrix factorisation on the right. The six substitution types are shown in the panels across the top of each signature. Within each panel, the trinucleotide context is shown as four sets of four bars, grouped by whether an A, C, G or T respectively is 5’ to the mutated base, and within each group of four by whether A, C, G or T is 3’ to the mutated base. Where signatures show high cosine similarity scores between algorithms, they are lined up horizontally. We note that MutationalPatterns’ Signature C does not have a match in the signatures extracted by the hierarchical Dirichlet process algorithm, but appears very similar to Signature A in MutationalPatterns (or SBS-5 from the hierarchical Dirichlet process). This means it likely represents over-splitting of the signatures. (B) The heatmap shows the cosine similarities of signatures extracted by MutationalPatterns with those extracted by the hierarchical Dirichlet process (HDP). Only cosine similarity scores >0.75 are coloured. (C) Scatterplots showing the fraction of mutations in each colony (n = 632) assigned to each signature by the hierarchical Dirichlet process (HDP; x axis) versus the MutationalPatterns algorithm (y axis). Correlation values quoted are Pearson’s correlation coefficients, R2. (D) Transcription strand bias of A>G mutations in N[A]T context before and after transcription start sites. Note the absence of transcriptional strand bias in intergenic regions, but evidence for both transcription-coupled damage and repair after the transcription start site, applying similarly in both never smokers and ex-/current smokers.
Extended Data Figure 6
Extended Data Figure 6. Phylogenetic trees of 13 subjects.
Phylogenetic trees showing clonal relationships among normal bronchial cells in the 13 subjects not shown in Figure 3A. Branch lengths are proportional to the number of mutations (x axis) specific to that clone/subclone. Each branch is coloured by the proportion of mutations on that branch attributed to the various single base substitution signatures.
Extended Data Figure 7
Extended Data Figure 7. Indel signatures in the sample set.
(A) Five indel signatures were extracted by the hierarchical Dirichlet process. Contribution of different types of indels to each signature are shown, grouped by whether variants are deletions or insertions; size of event; whether they occur at repeat units; and the sequence content of the indel. (B) Stacked bar-plot showing the proportional contribution of mutational signatures to indels across the 632 colonies derived from normal bronchial cells, extracted using a hierarchical Dirichlet process. Within each patient, colonies are sorted from left to right by increasing indel burden (bar chart in dark grey above coloured signature attribution stacks).
Extended Data Figure 8
Extended Data Figure 8. Double base substitution signatures in the sample set.
(A) Six double base substitution (DBS) signatures were extracted by the hierarchical Dirichlet process. Contribution of different types of DBS to each signature are shown, grouped by the sequence that is mutated, and what it is mutated to. Five of the signatures have been observed in cancer genomes, with one (DBS Sig-C) a novel signature extracted here. (B) Stacked bar-plot showing the proportional contribution of mutational signatures to double base substitutions across the 632 normal bronchial cells, extracted using a hierarchical Dirichlet process. Note that some of the colonies in children have no double base substitutions. Within each patient, colonies are sorted from left to right by increasing DBS burden (bar chart in dark grey above coloured signature attribution stacks).
Extended Data Figure 9
Extended Data Figure 9. Driver mutations in normal bronchial epithelium.
(A) Stick plots showing distribution of mutations in TP53, NOTCH1 and other genes that were significantly mutated in our sample set – mutations are coloured by type. The gene structure is shown horizontally in the centre of each plot with domains as coloured bars. Above the gene are mutations in this sample set; below the gene are the mutations found in squamous cell carcinomas from the TCGA sample set. (B) Fraction of cells with driver mutations in TP53 (left), NOTCH1 (middle) or all other significant cancer genes (right), split by smoking status.
Extended Data Figure 10
Extended Data Figure 10. Relationship of telomere lengths with age.
Scatter-plot of estimated telomere lengths (y axis) against age of subject (x axis). Individual points represent colonies (n = 398 colonies with <10% DNA deriving from the mouse feeder layer). Cells with near-normal mutation burden are identified in a gold colour.
Figure 1
Figure 1. Mutation burden in normal bronchial epithelium.
(A) Burden of single base substitutions (SBS), small insertion-deletions (indels) and double base substitutions (DBS) across patients in the cohort. Box-and-whisker plots show each subject, with the boxes indicating median and interquartile range, and the whiskers denoting the range. The overlaid points are the observed mutation burden of individual colonies. (B) Relationship of burden of substitutions per cell with age, with points representing individual colonies (n = 632), coloured by smoking status. The black line represents the fitted effect of age on substitution burden, estimated from linear mixed effects models after correction for smoking status and within-patient correlation structure. The blue shaded area represents the 95% confidence interval for the fitted line. (C) Fraction of cells with near-normal mutation burden in current and ex-smokers.
Figure 2
Figure 2. Mutation signatures in normal bronchial epithelium.
(A) Stacked bar-plot showing the proportional contribution of mutational signatures to single base substitutions across the n=632 colonies from normal bronchial cells, extracted using a hierarchical Dirichlet process. Within each patient, colonies are sorted from left to right by increasing mutation burden (bar chart in dark grey above coloured signature attribution stacks). Dashed black vertical lines in current and ex-smokers denote the cut-off between cells with near-normal and elevated mutation burden. (B) Trinucleotide context spectrum on transcribed and untranscribed strands of two new single base substitution (SBS) signatures. The six substitution types are shown in the panel across the top. Within each panel, the trinucleotide context is shown as four sets of eight bars, grouped by whether an A, C, G or T respectively is 5’ to the mutated base, and within each group of eight by whether A, C, G or T is 3’ to the mutated base. Activity of the mutational signature on the untranscribed strand is shown in pale colour; on the transcribed strand in darker colour. (C) Numbers of base substitutions attributed to the 3 endogenous signatures (y axis) across the cohort (n = 632 colonies) shown according to age of subject (x axis). Black line represents the fitted effect of age, estimated from linear mixed effects models after correction for smoking status and within-patient correlation structure. The blue shaded area represents the 95% confidence interval for the fitted line. The quoted p values for the fixed effects of age and smoking derive from the full linear mixed effects models. (D) Estimated effect size of age, smoking status, between-patient and within-patient standard deviation of 7 signatures (points) with 95% confidence intervals (horizontal lines). Estimates are derived from linear mixed effects models (n = 632).
Figure 3
Figure 3. Driver mutations in normal bronchial epithelial cells.
(A) Phylogenetic trees showing clonal relationships among normal bronchial cells in 3 representative subjects. Branch lengths are proportional to the number of mutations (x axis) specific to that clone/subclone. Each branch is coloured by the proportion of mutations on that branch attributed to the various single base substitution signatures. Driver mutations identified in each branch (black: SBS, red: indel) are also shown. (B) Total number of colonies with mutations (left panel) and number of unique mutations (right panel) in key cancer genes across the sample set (n = 632). ** represents genes significant (q<0.05 by dNdScv) when correction for multiple hypothesis testing is applied across all coding genes; * represents genes significant (q<0.05 by dSNdScv) when correction for multiple hypothesis testing is applied across known driver genes in lung cancers and normal squamous tissues (exact q values in Supplementary Table 4). (C) Fraction of colonies with 0, 1, 2 or 3 driver mutations across the 16 subjects. (D) Distribution of driver mutations across colonies in the cohort, coloured by type of mutation. Loss of heterozygosity (LOH) affecting driver mutations are also shown. (D) The frequency of driver mutations shared by more than 1 colony in a patient (dark blue) versus found in a single colony (light blue) across different cancer genes.
Figure 4
Figure 4. Relationship of telomere lengths with mutation burden.
Split by smoking status, panels show the relationship between telomere lengths (x axis) and mutation burden (y axis) for colonies with <10% contamination from the mouse feeder cells (n = 398 colonies). Individual cells are shown as points and fitted lines for each patient as coloured lines (slopes estimated using linear mixed effects models). The difference in slopes according to smoking status is highly significant (p=0.0009 for interaction term; LME models). One outlying cell in an ex-smoker with >10,000 mutations is excluded from the plot to improve visualisation.

Comment in

References

    1. Alberg AJ, Brock MV, Ford JG, Samet JM, Spivack SD. Epidemiology of lung cancer: Diagnosis and management of lung cancer, 3rd ed: American College of Chest Physicians evidence-based clinical practice guidelines. Chest. 2013;143:e1S–e29S. - PMC - PubMed
    1. Peto R, et al. Smoking, smoking cessation, and lung cancer in the UK since 1950: combination of national statistics with two case-control studies. BMJ. 2000;321:323–9. - PMC - PubMed
    1. International Agency for Research on Cancer. Tobacco Smoke and Involuntary Smoking. 2004;83
    1. Hecht SS. Progress and challenges in selected areas of tobacco carcinogenesis. Chem Res Toxicol. 2008;21:160–171. - PMC - PubMed
    1. Pfeifer GP, et al. Tobacco smoke carcinogens, DNA damage and p53 mutations in smoking-associated cancers. Oncogene. 2002;21:7435–7451. - PubMed

MeSH terms