. 2020 Feb;578(7793):142-148.
doi: 10.1038/s41586-020-1962-0. Epub 2020 Jan 29.

Cell stress in cortical organoids impairs molecular subtype specification

Affiliations

Cell stress in cortical organoids impairs molecular subtype specification

Aparna Bhaduri et al. Nature. 2020 Feb.

Abstract

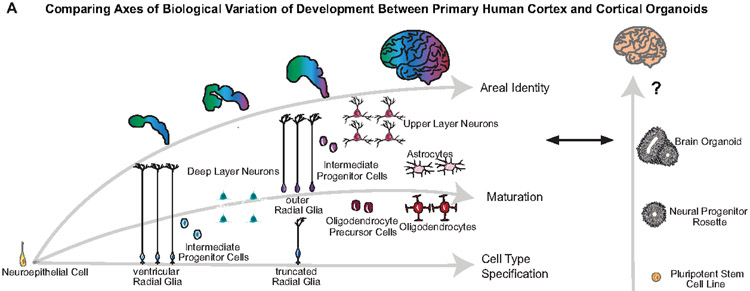
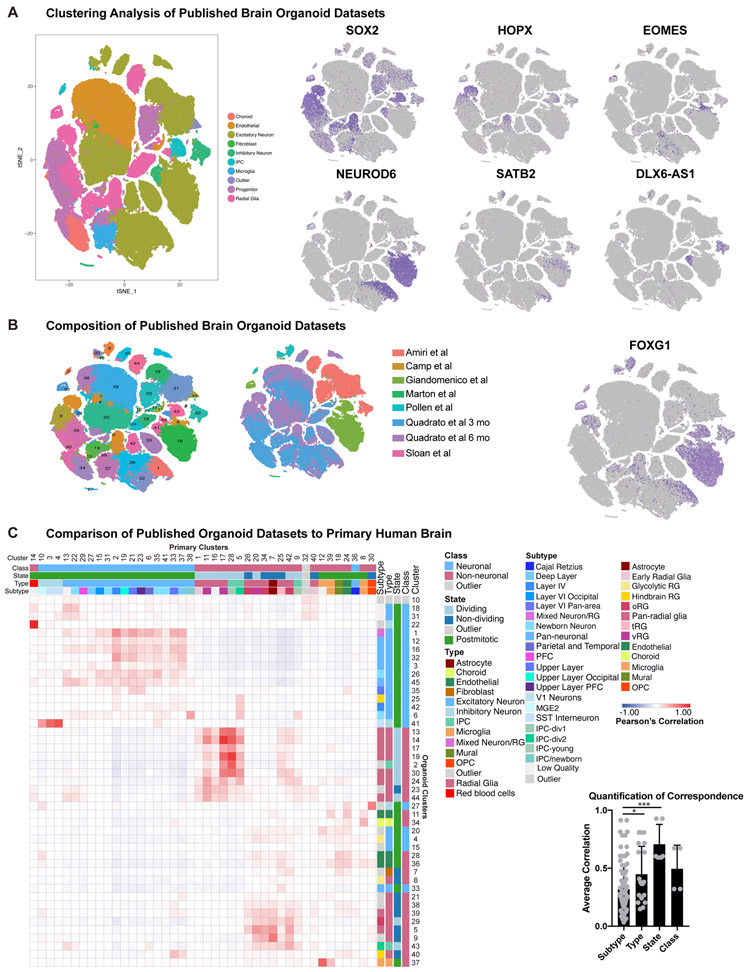
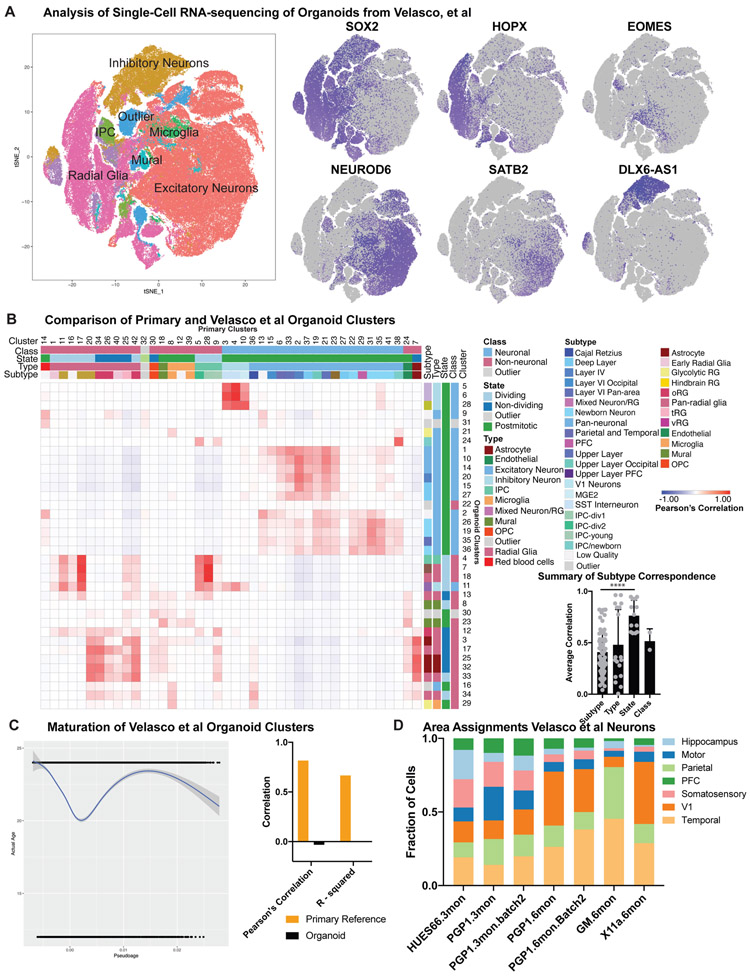
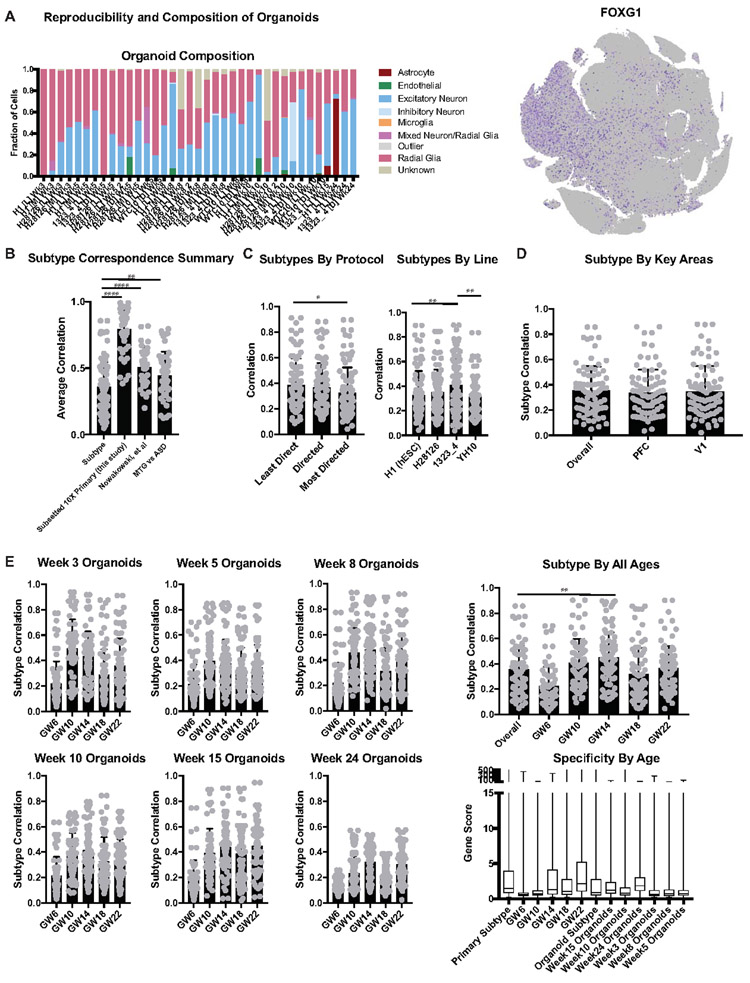
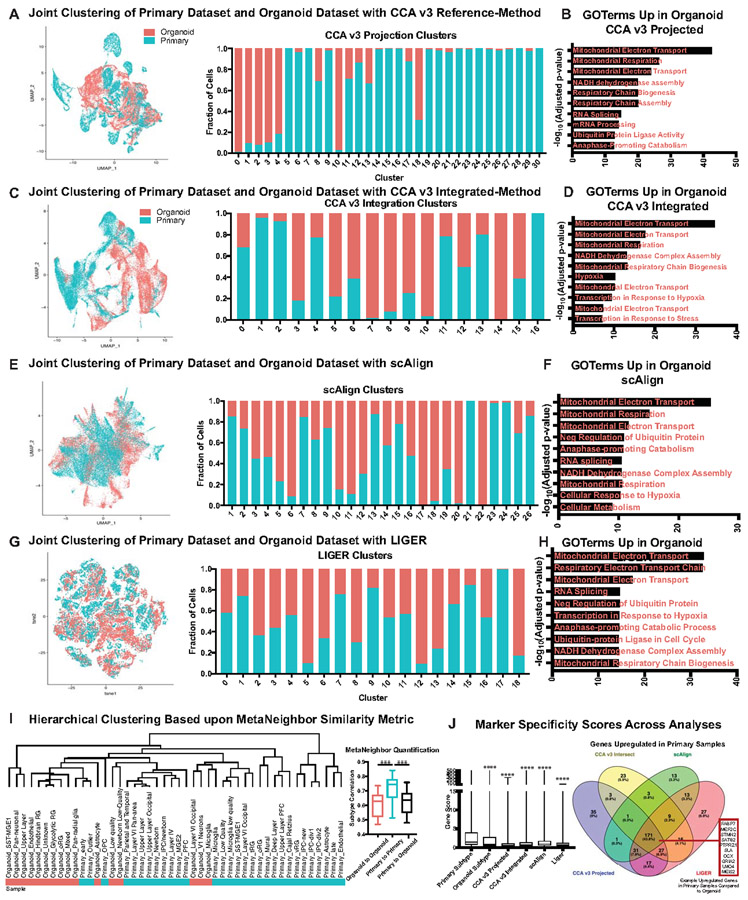
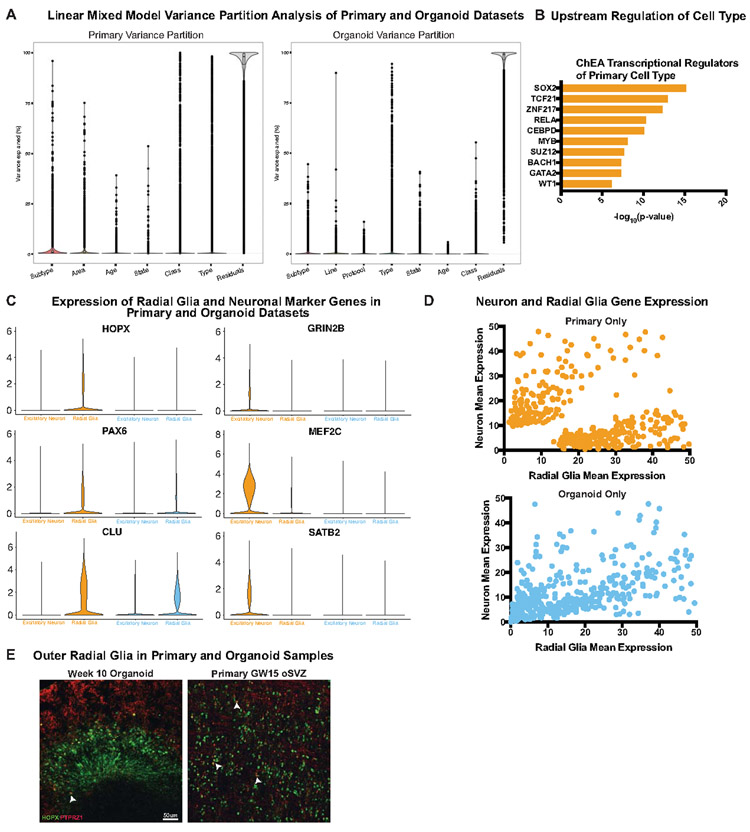
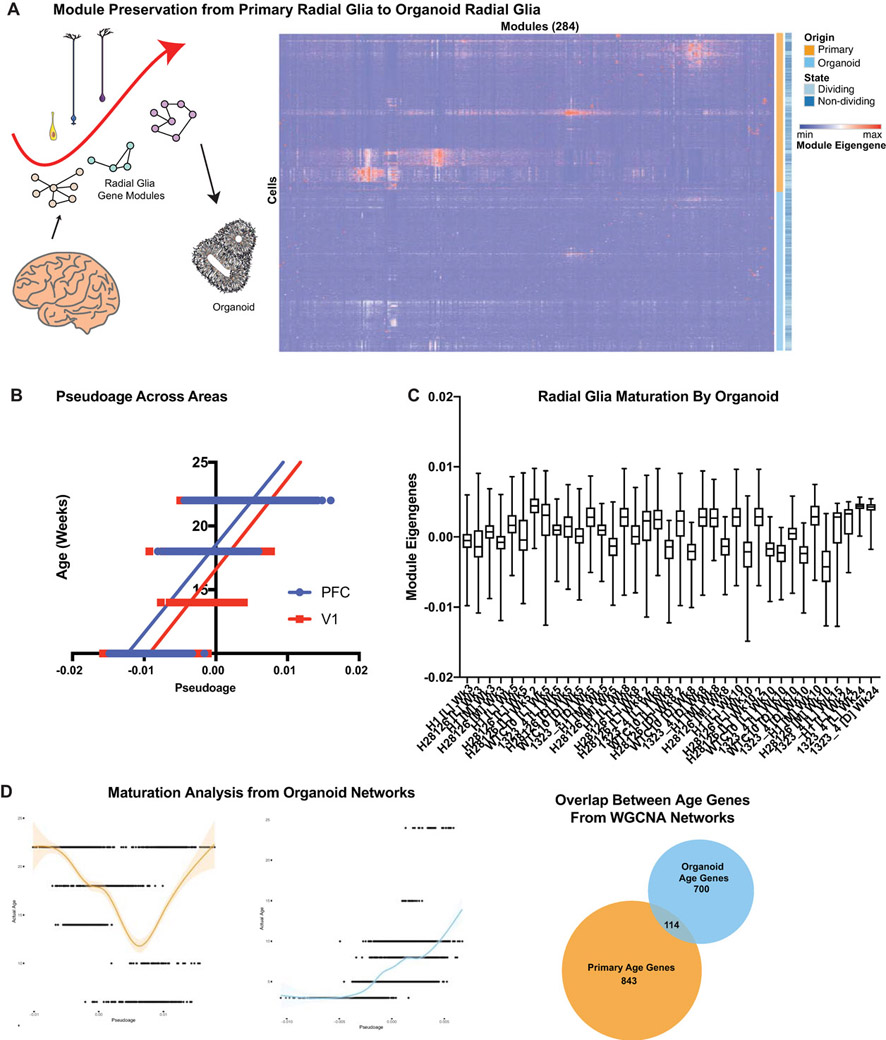
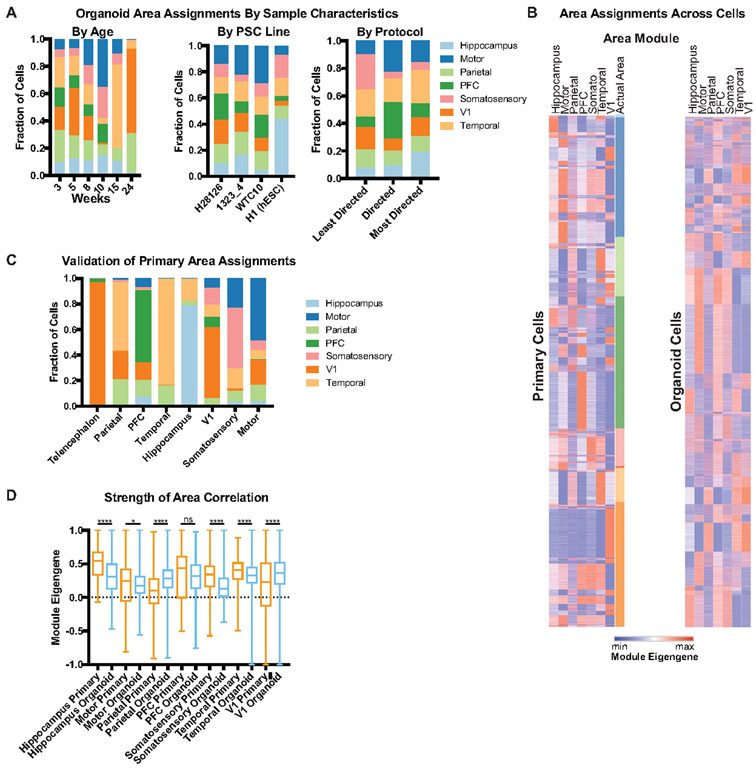
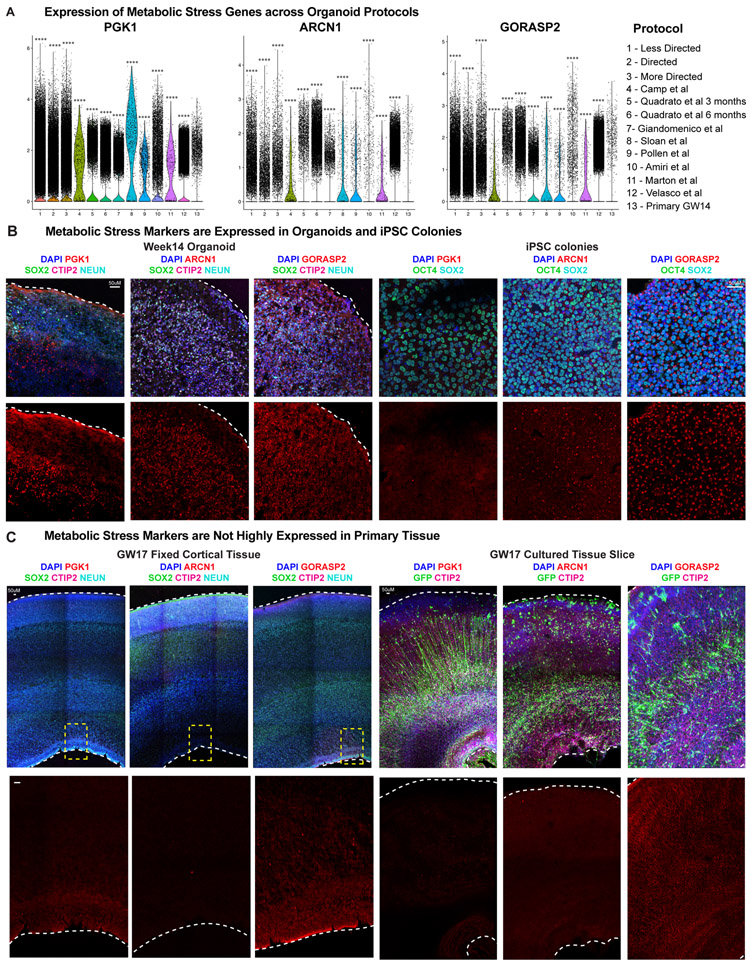
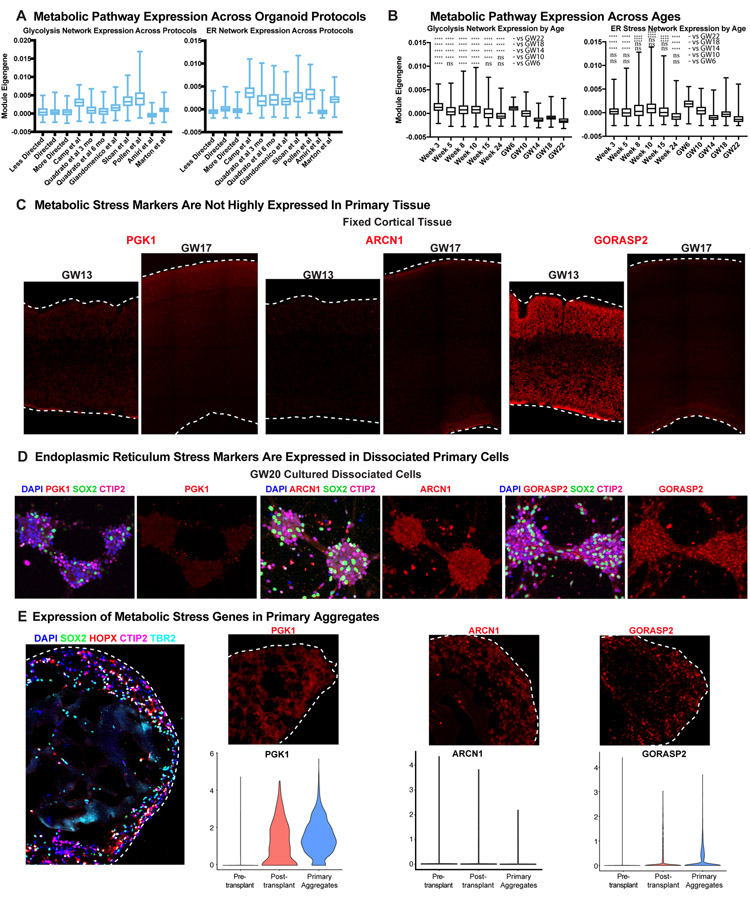
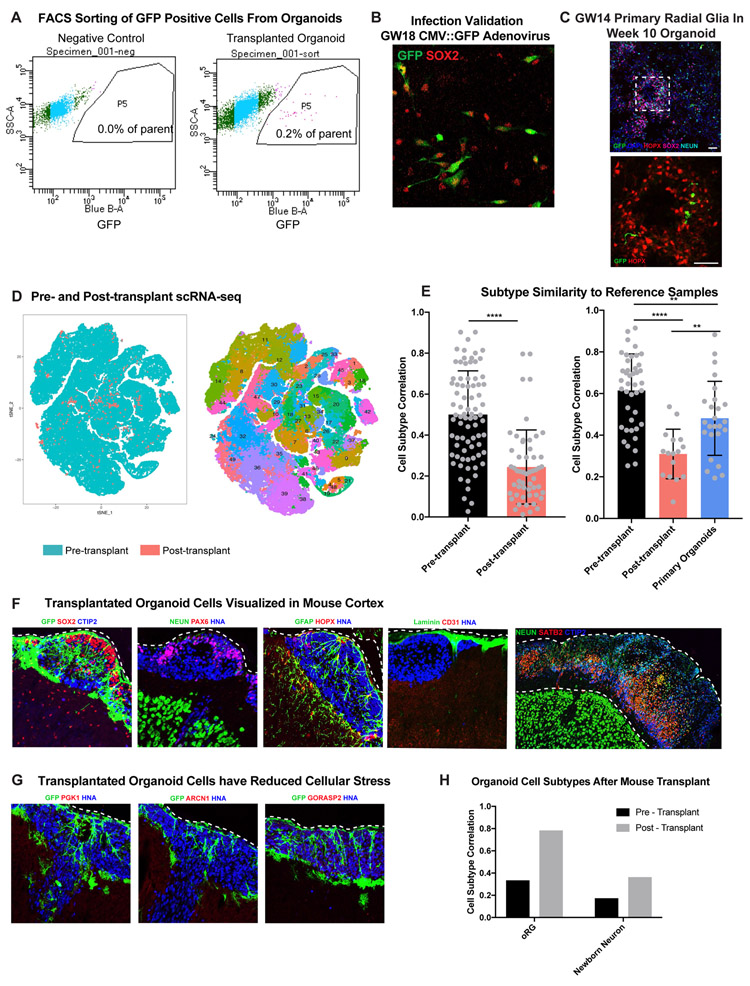
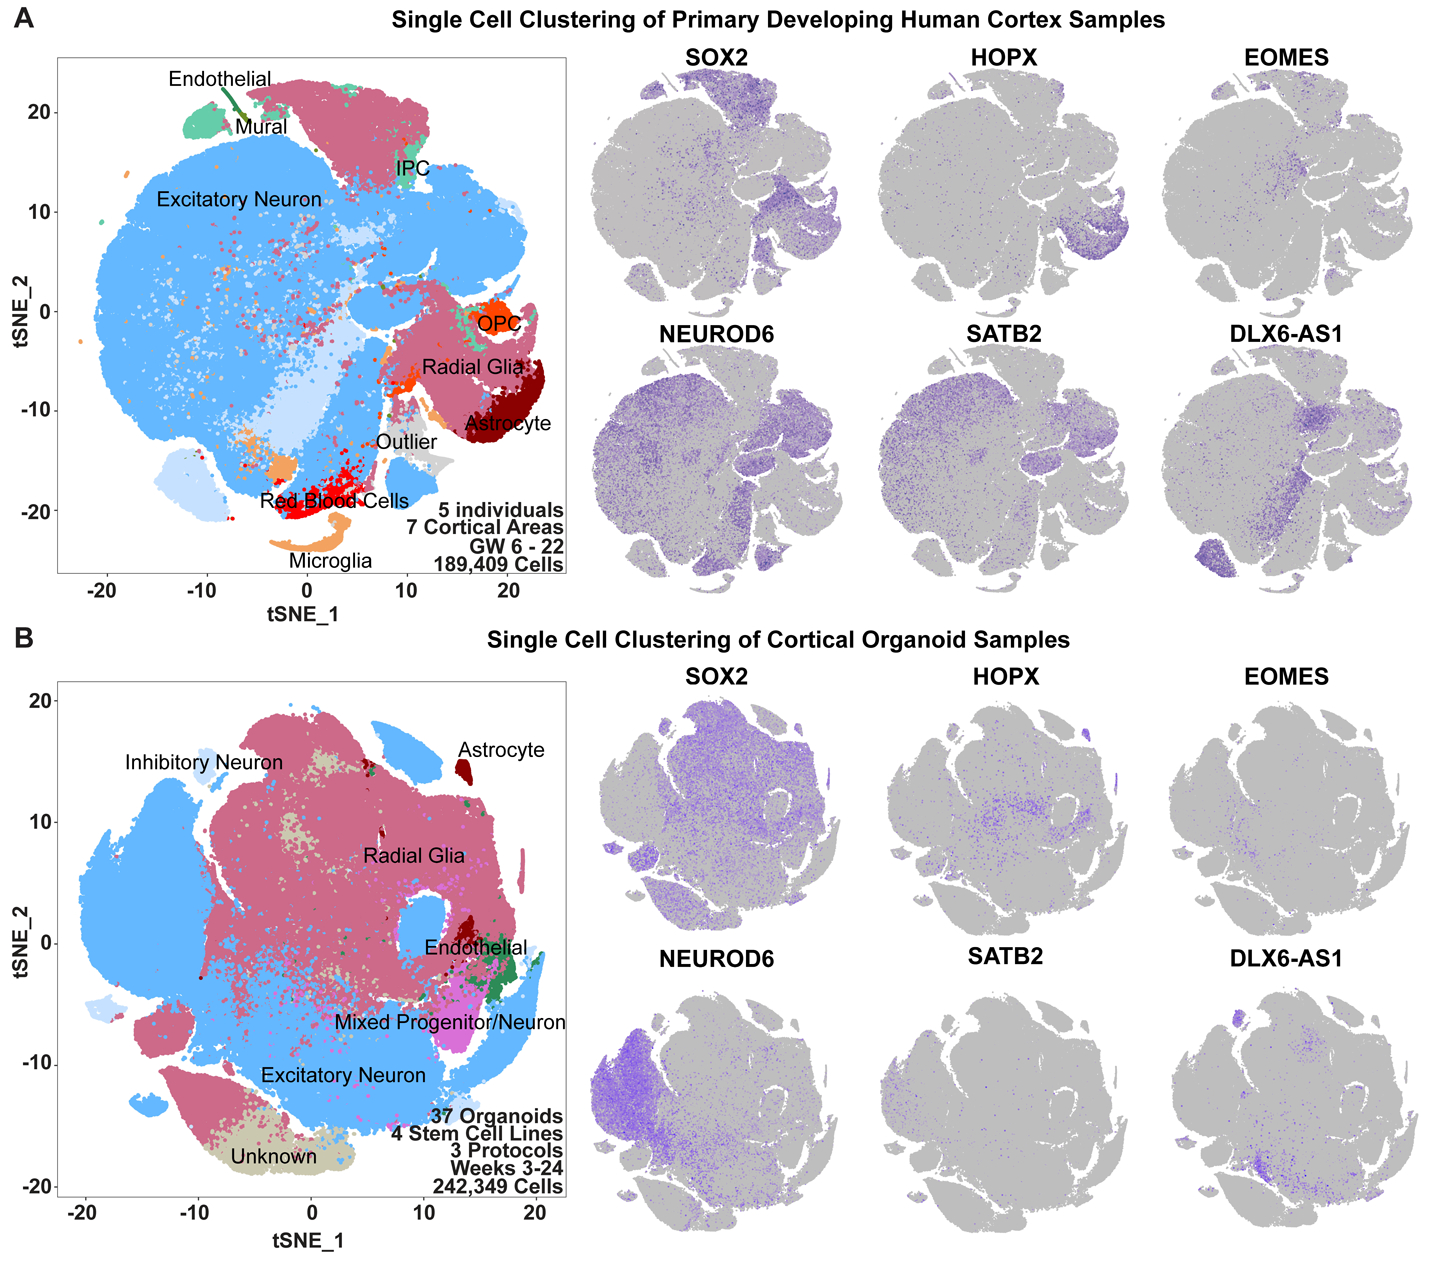
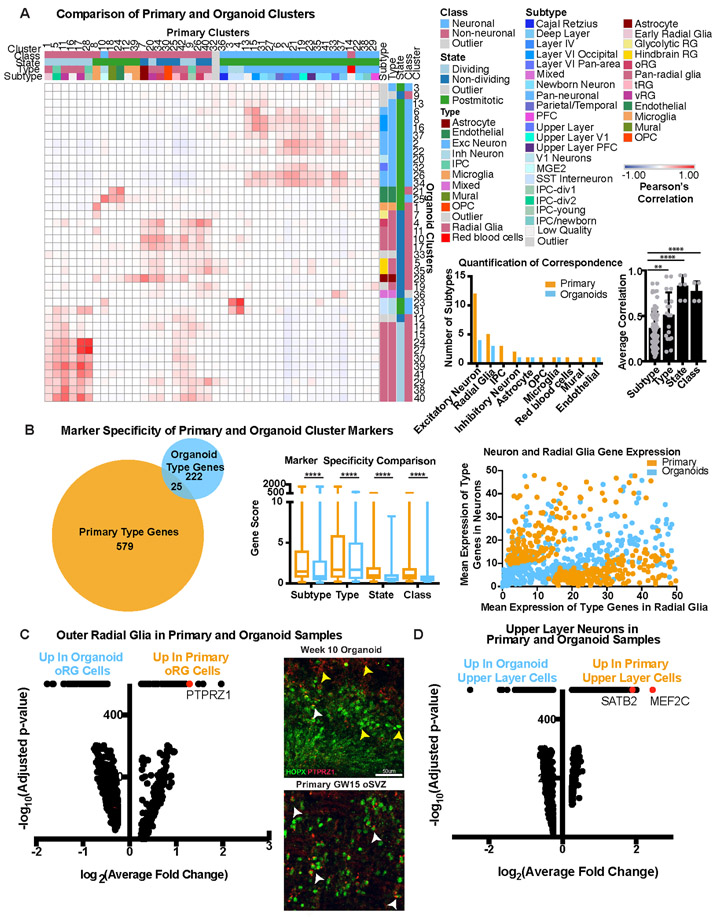
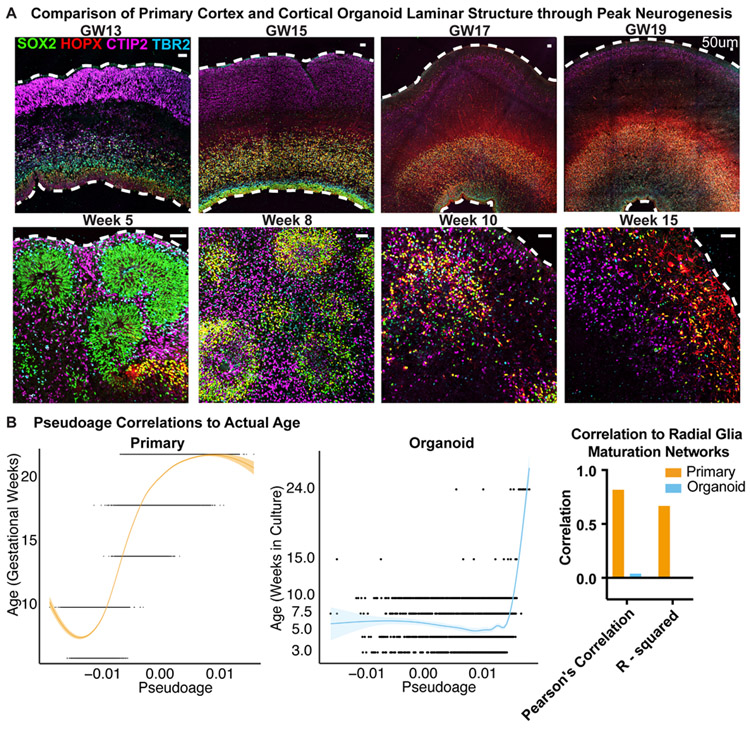
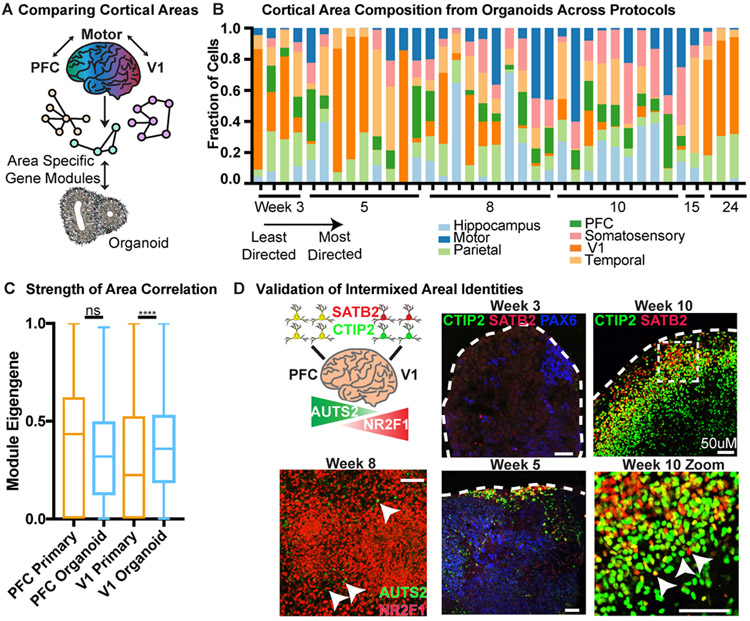
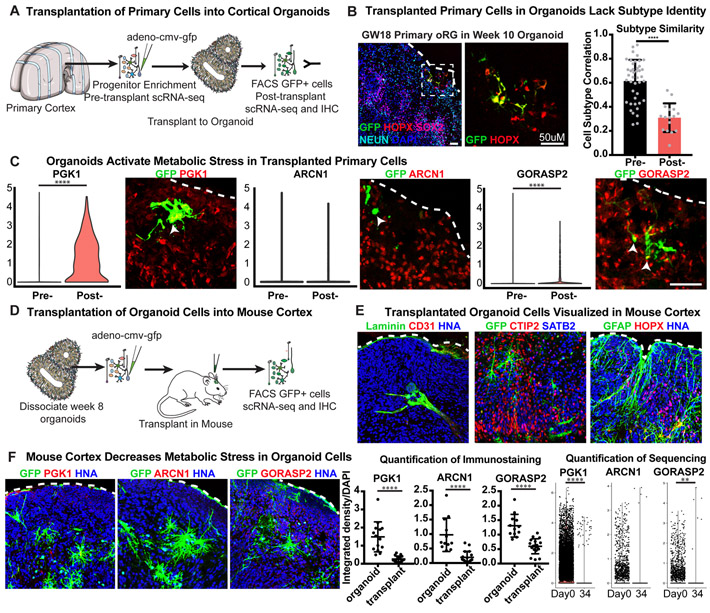
Cortical organoids are self-organizing three-dimensional cultures that model features of the developing human cerebral cortex1,2. However, the fidelity of organoid models remains unclear3-5. Here we analyse the transcriptomes of individual primary human cortical cells from different developmental periods and cortical areas. We find that cortical development is characterized by progenitor maturation trajectories, the emergence of diverse cell subtypes and areal specification of newborn neurons. By contrast, organoids contain broad cell classes, but do not recapitulate distinct cellular subtype identities and appropriate progenitor maturation. Although the molecular signatures of cortical areas emerge in organoid neurons, they are not spatially segregated. Organoids also ectopically activate cellular stress pathways, which impairs cell-type specification. However, organoid stress and subtype defects are alleviated by transplantation into the mouse cortex. Together, these datasets and analytical tools provide a framework for evaluating and improving the accuracy of cortical organoids as models of human brain development.


Conflict of interest statement

Competing Interests

The authors declare no competing interests.

Figures

Extended Data Figure 1.
Extended Data Figure 1.. Schematic of Human Cortex and Human Organoid Development
a) Schematic of normal brain developmental trajectories queried in this study and their comparison to organoid models. Normal cortical development requires the emergence of a diversity of progenitor cell types from a seemingly uniform neuroepithelium. Through a sequence of cell type specification and maturation, progenitor cells undergo neurogenesis and gliogenesis to generate the cellular diversity of the cortex. Areal identities are specified during this process and comprise a core property of developing neurons.
Extended Data Figure 2.
Extended Data Figure 2.. Brain and Cortical Organoid Generation Protocols
a) Cortical organoid protocols utilizing different levels of directed differentiation were evaluated using scRNA-seq and immunohistochemistry. Stem cells were expanded on matrigel, dissociated to single cells, and re-aggregated in v-bottom low adhesion plates. Small molecules were used to promote forebrain induction and after 18 days moved to 6 well plates onto an orbital shaker. Organoids were maintained in culture and collected from weeks 3-24. b) Protocol schematics for other methods used to differentiate whole brain and cortical organoids, which have published single cell data. Publicly available data was utilized for comparative analyses with our collected data.
Extended Data Figure 3.
Extended Data Figure 3.. Comparison of Broad Cell Types Across Differentiation Protocols
a) Organoids derived from the 13234 iPSC line underwent the least and directed differentiation protocols, were collected at weeks 5 and 10, and processed for immunohistochemistry. Organoids from both protocols were stained with SOX2 to mark progenitors, HOPX to identify outer radial glia, and TBR2 to label intermediate progenitor cells. Cultures were also stained with CTIP2+ to mark deep layer neurons and SATB2+ to identify upper layer neurons. At week 5 all progenitor subtypes were present and by week 10 both deep and upper layer neurons were detected. b) Organoids from the H28126 iPSC line were differentiated using the least, directed and most directed protocols. All progenitor types marked by SOX2, HOPX and TBR2 and CTIP2+ and SATB2+ neuronal populations were present by week 5. Expression of all markers decreased by week 10. Organoid staining validation of broad cell types was repeated independently three times.
Extended Data Figure 4.
Extended Data Figure 4.. Single-cell Comparison of Cell Types Across Samples
a) tSNE plots depicting the single-cell analysis of primary cortical cells as colored by cluster, age of sample, and cortical area. Stacked histograms showing composition of each cluster for these metadata properties are also included. b) tSNE plots depicting the single-cell analysis of cortical organoid cells as colored by cluster, protocol, pluripotent stem cell line (iPSC or hESC), and age of sample. Stacked histograms showing composition of each cluster for these metadata properties are also included.
Extended Data Figure 5.
Extended Data Figure 5.. Single-cell Comparison of Cell Types Across Published Datasets
a) Re-analysis of published single-cell sequencing in organoid samples. tSNE plot is colored by cell type designation, while the feature plots depict the same cell populations as presented in Figure 1. b) tSNE plots depicting the single-cell analysis of published organoid cells as colored by cluster, protocol (including paper of origin) and FOXG1 expression. c) Recapitulation of the heatmap in Figure 2, using published organoid clusters from above and comparing to primary reference dataset from this paper. Quantification of correspondence shows the quantitative correlation from the best match in the heatmap for each category of class, state, type and subtype, averaged across all clusters (primary: n=189,409 cells from five individuals collected independently; published organoid data: n=_109,813__cells from 7 data sets collected independently by different scientific groups; two-sided Welch’s t-test evaluating mean plus standard deviation; subtype vs type: * p= 0.0193, subtype vs. state: ***p=0.00017).
Extended Data Figure 6.
Extended Data Figure 6.. Single-cell Comparison of Cell Types Across Published Datasets
a) Re-analysis of published single-cell sequencing from Velasco et al, where a reproducible cortical organoid protocol was presented. tSNE plot is colored by cell type designation, while the feature plots depict the same cell populations as presented in Figure 1. b) Recapitulation of the heatmap in Figure 2, using published organoid clusters from Velasco et al and comparing to primary reference dataset from this paper. Quantification of correspondence shows the quantitative correlation from the best match in the heatmap for each category of class, state, type and subtype, averaged across all clusters (primary: n= 189,409 cells from five individuals collected independently; Velasco 2019 organoid data: n= 166,241 cells from an independently collected data set; two-sided Welch’s test was used to evaluate mean plus standard deviation; subtype vs state ****p= 1.8e−7). c) Pseudoage analysis of Velasco et al organoids mirrors the organoids in this study with low correspondence between pseudoage and actual age. Pseudoage calculation is indicated by the graph line and shading represents the geometric density standard error of the regression. d) Area identity was assigned for all excitatory neurons from Velasco, et al and each organoid consisted of heterogeneous areal identities, consistent with the observations in the organoids from this study.
Extended Data Figure 7.
Extended Data Figure 7.. Analysis of Subtype Correlation Across Metadata Properties
a) Composition of each organoid by cell type designation. FOXG1 expression across all organoid samples shown by feature plot on the right. b) Comparison of organoid subtype as determined by this study versus three control analyses. Graphically, the column indicates subtype correspondence and the error bar is standard deviation. The first was performed by halving the primary dataset randomly and without overlap and then comparing the subclusters from the two datasets. This age and method matched analysis shows that primary variation is significantly lower than the variation between organoids and primary cells, as indicated by the significantly higher subtype correlation between primary datasets (organoids: n=242,349 cells collected from 37 organoids from 4 biologically independent samples from 4 independent experiments; primary data: 189,409 cells from 5 biologically independent samples from 5 experiments,****p= 2.0e−24, two-sided Welch’s t-test). A similar analysis was performed comparing the primary data from this study to the data collected by microfluidic approaches from Nowakowski et al. Although the ages, capture method, and number of cells varied greatly, subtype correlation between the published primary data and the data in this study is significantly higher than the subtype similarity between organoids and primary samples (Nowakowski data: n= 4,261 cells from 48 biologically independent samples across more than 35 independent experiments, ****p=2.0e−5). We additionally performed this analysis between two published datasets in the adult human, comparing middle temporal gyrus (MTG, Hodge et al 2019, n= 15,928 cells) from an older adult with distinct brain regions from young adults in the control samples of an autism spectrum disorder study (ASD, Velmeshev et al 2019, n= 104, 559). Despite differences across ages and individuals, who could be expected to have unique cortical gene expression profiles based upon sensory experience, the distinct cortical regions isolated and the different capture methods, the subtype correlation between these two primary datasets is significantly higher than the correlation between organoid cells and primary cells (**p=0.0076). c) Subtype correlation as calculated and shown in Figure 2 which is broken down by protocol and pluripotent line where the graph bars indicate subtype correlation and error bars are standard deviation. The least directed protocol was significantly better at recapitulating cell subtype than the most directed protocol (*p= 0.0483, two-sided Welch’s t-test) which is consistent with the recent findings from Velasco et al. We also observed that the iPSC line 1323_4 generated significantly more similar subtypes to primary samples than WTC10 or H1 (**p=0.0013, 0.0089 respectively). d) Clustering and subtype analysis was performed between all organoids and primary PFC samples and primary V1 individually. Subtype correlation did not change regardless of which area the organoids were compared to. “Overall” refers to the subtype correlation observed when comparing all organoids cells to all primary cells and is shown for comparison. Histogram bars show subtype correlation and error bars are standard deviation (n=242,349 cells from 37 organoids across 4 independent experiments). e) Subtype correlation analysis was performed across all organoid stages (n=week 3: 38,417 cells, week 5: 26,787 cells, week 8: 11,023 cells, week 10: 50,550 cells, week 15: 2,722 cells, week 24: 4,506 cells from 4 independent experiments) and all primary ages (n= GW6: 5,970 cells, GW10: 7,194 cells, GW14: 14,435 cells, GW18: 78,157 cells, GW22: 83,653 cells from 5 independent experiments). Histogram bars show subtype correlation and error bars are standard deviation. Week 3 organoids are more similar to younger primary stages, while week 15 organoids are most similar to older primary ages. Other ages correspond similarly well to the primary stages of peak neurogenesis (GW10-24), while all together, the organoids are most significantly similar to GW14 (**p= 0.0015, two-sided Welch’s t-test). “Overall” refers to the subtype correlation observed when comparing all organoids cells to all primary cells and is shown for comparison. The last histogram shows the average gene score of each sample and error bars are standard deviation. Younger primary samples and organoids have a relatively lower gene score related to their marker specificity; this specificity increases substantially over time in primary cells but less so in organoid cells.
Extended Data Figure 8.
Extended Data Figure 8.. Co-clustering of Primary and Organoid Single-cell Datasets with CCA, scAlign, LIGER and MetaNeighbor.
a) Canonical correlation analysis from Seurat v3 was performed using the reference-based integration. For this analysis, 20,000 cells were randomly subsetted from both the primary and organoid datasets and their counts matrices were merged. The primary samples were designated as the reference, and using CCA the organoid cells were projected into that reference space. A UMAP plot of the intersection is shown. The stacked histogram shows the relative contributions of each sample to each cluster. Most clusters were primarily one dataset or the other, validating the observations of limited primary subtype recapitulation in organoids. b) For the clusters with at least 20% contribution from both primary and organoid cells, differential expression was performed across all of these clusters jointly using a two-sided Wilcoxon rank sum test. The full differential expression is presented in STable 5, but genes upregulated in organoid cells were examined with Enrichr pathway analysis, and a summary of the top Gene Ontology terms are presented (organoid: n=20,000 cells from 37 organoids across 4 independent experiments; primary: n=20,000 cells from 5 individuals across 5 independent experiments). c) Canonical correlation analysis from Seurat v3 was performed using the integration based method. For this analysis, 20,000 cells were randomly subsetted from both the primary and organoid datasets and their counts matrices were merged. A UMAP plot of the intersection is shown. The stacked histogram shows the relative contributions of each sample to each cluster. Most clusters were primarily one dataset or the other, validating the observations of limited primary subtype recapitulation in organoids. d) For the clusters with at least 20% contribution from both primary and organoid cells, differential expression was performed across all of these clusters jointly using a two-sided Wilcoxon rank sum test. The full differential expression is presented in STable 5, but genes upregulated in organoid cells were examined with Enrichr pathway analysis, and a summary of the top Gene Ontology terms are presented (organoid: n=20,000 cells from 37 organoids across 4 independent experiments; primary: n=20,000 cells from 5 individuals across 5 independent experiments). e) scAlign was performed for integration of datasets. For this analysis, 20,000 cells were randomly subsetted from both the primary and organoid datasets and their counts matrices were merged. A UMAP plot of the intersection is shown. The stacked histogram shows the relative contributions of each sample to each cluster. Many clusters were primarily one dataset or the other, validating the observations of limited primary subtype recapitulation in organoids. f) For the clusters with at least 20% contribution from both primary and organoid cells, differential expression was performed across all of these clusters jointly using a two-sided Wilcoxon rank sum test. The full differential expression is presented in STable 5, but genes upregulated in organoid cells were examined with Enrichr pathway analysis, and a summary of the top Gene Ontology terms are presented (organoid: n=20,000 cells from 37 organoids across 4 independent experiments; primary: n=20,000 cells from 5 individuals across 5 independent experiments). g) LIGER was performed for integration of datasets. For this analysis, 20,000 cells were randomly subsetted from both the primary and organoid datasets and their counts matrices were merged. A UMAP plot of the intersection is shown. The stacked histogram shows the relative contributions of each sample to each cluster. Although the clusters were well mixed, they had very diffuse marker gene expression suggesting key biological drivers of variation were obscured by the analysis. h) For the clusters with at least 20% contribution from both primary and organoid cells, differential expression was performed across all of these clusters jointly using a two-sided Wilcoxon rank sum test. The full differential expression is presented in STable 5, but genes upregulated in organoid cells were examined with Enrichr pathway analysis, and a summary of the top Gene Ontology terms are presented (organoid: n=20,000 cells from 37 organoids across 4 independent experiments; primary: n=20,000 cells from 5 individuals across 5 independent experiments). i) MetaNeighbor was performed using unsupervised analysis to compare the clusters from primary and organoid samples. MetaNeighbor uses cell-cell similarity scores based upon neighbor voting and AUROC calculations to quantify the similarities between cells. These pairwise values were used as an input to hierarchical clustering, and almost entirely segregated primary clusters from organoid clusters. Box and whiskers plot shows quantification of the similarities within organoid and primary datasets versus the comparison of the two showed the primary alone comparisons were significantly higher (organoid to organoid: ***p= 0.00078; primary to organoid: ***p= 0.00036, two-sided Welch’s t-test) (organoid: n=20,000 cells from 37 organoids across 4 independent experiments; primary: n=20,000 cells from 5 individuals across 5 independent experiments). The bars show range of subtype correlation with middle line indicating the mean and error bars the maximum and minimum. These results further validate our observations that there are important distinctions between the organoid and primary subtypes j) The gene score for each of the 4 integration methods is presented, and all are significantly lower than primary clustering alone (organoid subtype: ****p=5.3e−38; CCA v3 Projected: ****p5.5e−94; CCA v3 Integrated: ****p=2.8e−24; scAlign: ****p=2.1e−23; LIGER: ****p=2.9e−94, two-sided Welch’s t-test). The one method that substantially integrated the samples (LIGER) had the lowest gene score. Box and whisker plot shows average mean score and error bars are max and minimum (n=242,349 cells from 37 organoids across 4 independent experiments). The differentially expressed genes that were upregulated in primary samples from all 4 analyses were intersected. A significant number of these genes were found in all 4 datasets, and these genes included examples that we identified from other methods in this study, including PTPRZ1, MEF2C and SATB2, validating the accuracy of our analytical methods and our main findings.
Extended Data Figure 9.
Extended Data Figure 9.. Comparing Cell Type Specification in Primary and Organoid Samples
a) Variance Partition was run on both primary and organoid datasets across the metadata properties shown. Each dot represents a gene and the amount of variance of that gene explained by the relevant metadata property. b) ChEA analysis of type genes identified in primary cortical samples. X-axis shows the −log10(adjusted p-value) of the transcription factors indicated; results obtained from Enrichr, datasets included a variety of experimental systems but have been shortened for ease of reading to the relevant transcription factor (n=189,409 cells from 5 biologically independent samples; two-sided Wilcoxin rank sum test). Type genes in organoid samples were not unified for significant transcription factor regulation. c) Violin plots of radial glia and neuron markers in primary (orange) and organoid (blue) radial glia and neurons where width of colored section indicates distribution of expression of each data point within a sample. In some cases, organoids have expression of multiple markers, lower expression of key markers, or similar expression as seen in primary samples (organoids: n=242,349 cells from 37 organoids across 4 independent experiments; primary: n=189,409 cells from 5 biologically independent samples from 5 independent experiments). d) Dotplots from Figure 2 shown with one color only in order to avoid dot overlap. e) Lower magnification images of PTPRZ1 and HOPX overlap as shown in Figure 2C shows domains of overlapping expression in the primary oSVZ and distinct domains of expression in the organoid ventricular zone. Validation stains were repeated independently three times.
Extended Data Figure 10.
Extended Data Figure 10.. Molecular Maturation Analysis
a) WGCNA networks generated from annotated primary radial glia, as described in methods, were applied to both primary and organoid radial glia cells. Module eigengenes shown in the heatmap indicate overall higher expression in primary compared to organoid radial glia. b) Pseudoage (x-axis) versus actual age (y-axis) in PFC and V1 radial glia showing PFC are more mature than V1 radial glia. c) Box and whisker plot (min to max, bar at mean) across all cells within a single organoid from all organoids within this study show heterogeneity of maturation is within a single organoid and not between individuals (n=242,349 cells from 37 organoids across 4 independent experiments). d) The parallel pseudoage analysis to the analysis in Fig 3C is shown, but starting with organoid networks for the pseudoage calculation. Graph line shows mean pseduoage score against actual age, shading represents the geometric density standard error of the regression. The same pattern is observable, with organoids failing to recapitulate the molecular maturation of primary radial glia, though genes related to the switch from neurogenesis to gliogenesis are preserved and may account for some of the limited correlation.
Extended Data Figure 11.
Extended Data Figure 11.. Areal Identification
a) Organoid areal assignments by age, line, and protocol indicates heterogeneous areal identity. b) Heatmaps showing normalized module eigengene signature of each area in primary samples (with known area on the right) and in organoid samples. c) Summary of assigned area in primary samples compared to actual area. In many cases, they correspond strongly, while in others there is evidence of lack of distinction. For example, parietal cells still strongly express temporal signatures suggesting they have not yet been distinctly specified in primary samples though this specification does exist in organoids. d) Box and whisker plot (min to max, bar at mean, error bars of standard deviation) is the same comparison as shown in Figure 4C, but across all areas (Primary: n = 122958 excitatory neurons from 5 individuals from 5 independent experiments; Organoids: n = 97531 excitatory neurons from 37 organoids from 4 biologically independent stem cell lines. In some cases there is no significant difference between strength of area signal in primary cells and organoid cells (PFC, n.s. p= 0.5373), in other cases either the primary or organoid sample is significantly stronger (Motor: *p = 0.0148 all other areas: ****p<0.0001, Welch’s two-sided t-test).
Extended Data Figure 12.
Extended Data Figure 12.. Glycolysis and ER stress Across Culture Systems
a) Markers of metabolic stress are expressed across cortical organoid protocols. Violin plots show data both from our experiments (1-3) and published data sets from other protocols (4-12) which have significantly increased expression of the glycolysis gene PGK1, and the ER stress genes ARCN1 and GORASP2 compared to primary samples (n= 5 individual replicates, GW14 shown). Width of the colored area indicates mean gene expression level of each data set and overlaid dots show each individual data point. All protocols have significantly higher expression of these three markers compared to primary samples (****p= < 0.0001, two-sided Student’s t-test). b) Single cell sequencing identified increased expression of genes in organoids which were validated across all stages of organoid differentiation evaluated (week 3-14). Validation staining experiments were repeated independently three times. Representative images from week 14 organoids differentiated using the ‘least directed’ differentiation protocol. Colonies of iPSCs also express the ER stress markers ARCN1 and GORASP2 (n=3 biologically independent samples across three experiments). Scale bar = 50 uM. c) Primary cortical tissue express glycolysis and ER stress genes at undetectable levels (n=3 biologically independent samples across three experiments). When tissue was cultured for one week, there was no significant increase in cellular stress (n=3 biologically independent samples across three experiments). Scale bar = 50 uM.
Extended Data Figure 13.
Extended Data Figure 13.. Glycolysis and ER Stress Across Experimental Conditions
a) Metabolic stress network module eigengene expression across all cells is shown in box and whisker plots (min to max, bar at average, error bars of standard deviation) across 11 datasets generated either in this manuscript or from publicly available datasets. Data is shown for expressed genes from KEGG pathway glycolysis and ER stress networks (This study: n=242,349 cells from 37 organoids across 4 independent experiments; published datasets as annotated). b) The same box and whisker plots (min to max, bar at average, error bars of standard deviation) are shown for organoid (n=week 3: 38,417 cells, week 5: 26,787 cells, week 8: 11,023 cells, week 10: 50,550 cells, week 15: 2,722 cells, week 24: 4,506 cells from 4 independent experiments) and all primary ages (n= GW6: 5,970 cells, GW10: 7,194 cells, GW14: 14,435 cells, GW18: 78,157 cells, GW22: 83,653 cells from 5 independent experiments). ER stress and glycolysis networks decrease over time in primary samples but decrease less in organoids and are significantly higher in most organoid stages than primary samples. Significance was calculated for each organoid sample with respect to each primary sample, and a one-sided Welch’s t-test was performed (to evaluate if organoid was higher than primary). All comparisons were either not significant (ns) or significant with ****p < 0.0001. c) Cellular stress genes are expressed at low levels during human cortical development. GW13 and 17 samples were stained for the glycolysis gene, PGK1, and showed little expression at either age. The ER stress gene, ARCN1, had little expression at either age, however there was modest expression of the ER stress gene, GORASP2, at GW13 that decreased by later neurogenesis. Staining validation studies were performed independently four times. d) Dissociated primary cells were cultured for one week. Across five independent studies , there was no detectable expression of the glycolysis gene, PGK1, however the ER stress genes, ARCN1 and GORASP2, significantly increased. e) Immunostaining of primary aggregates (n=5 biologically independent samples), which express markers of oRG cells (HOPX and SOX2), IPCs (TBR2) and neurons (CTIP2). Aggregates also had increased cellular stress indicated by PGK1, ARCN1 and GORASP2 staining. Violin plots show expression level and data distribution for each maker in primary cells, primary cells after organoid transplantation and primary cells after being aggregated together. The expression of PGK1 and GORASP2 are increased in post-transplanted primary cells from the organoid as well as in primary cell aggregates. Cell types and physical distribution in the primary aggregate are shown, scale bar = 50 mM, representative image shown (n = 3 replicates).
Extended Data Figure 14.
Extended Data Figure 14.. Organoid Transplantation at Multiple Timepoints
a) Fluorescence associated cell sorting (FACS) plots showing dummy infection (left) and transplanted organoids (right) in terms of the their GFP signal [x-axis] vs sidesscatter [y-axis]. Cells in gated region were collected (% of parent written on plot) and sequenced for transplantations 2.5 weeks after incubating in the organoid, representative plot shown on right, n=5. b) Immunohistochemical validation of cells infected with GFP virus were all SOX2 labeled progenitor in cells dissociated from primary cortical tissue GW14-20. Scale bar = 50 mM, representative image shown (n = 5 replicates). c) An additional example of primary cell integration into organoids after transplant, where the primary cells integrate into organoid rosettes (n=7 primary samples into 21 organoids across 2 independent studies). d) tSNE of pre- and post-transplant primary cells, as well as the cluster designations. Many cell types represented in pre-transplanted cells are not present in the post-transplant population. e) Subtype similarity correlation between pre-transplant, post-transplant, and primary aggregate samples. Includes plot (bar is average subtype correlation, error bars are standard error) as a replicate to the experiment in Figure 5B, validating that at older organoid ages (week 12) the post-transplanted cells are still significantly impaired in their subtype specification (****p = 1.46e−11 n = 2 primary biologically independent samples into 2 organoids in addition to n = 5 biologically independent samples into 10 organoids in Figure 5, two-sided Welch’s t-test). Primary aggregates are significantly impaired in their subtype specification (**p = 0.0016), but are significantly better than post-transplanted primary cells (**p= 0.0037). This may be related to non-neural populations in the aggregates. f) Transplanted organoid cells were visualized in the mouse cortex after 2 and 5 weeks post-transplant (n=13 independent mice transplanted with 14 organoids derived from 2 iPSC lines across 2 independent experiments). Human cells were visualized by GFP and human nuclear antigen (HNA) expression. Organoid-derived cells expressed markers of progenitors (SOX2 and PAX6), neurons (CTIP2, SATB2, NEUN) and astrocytes (GFAP, HOPX). Mouse-derived vascular cells (Laminin & CD31) innervate the organoid transplant. g) After 2 weeks post-transplantation, organoid cells have reduced expression of the glycolysis gene, PGK1, and ER stress genes, ARCN1 and GORASP2 (n=6 transplanted mice stained with each marker independently from 2 iPSC lines across 2 independent experiments). h) Subtype correlation analysis of pre- and post- transplanted organoid cells shows an increase in oRG subtype identity (similarity to primary cluster 26) and in newborn neurons (similarity to primary cluster 22).
Figure 1.
Figure 1.. Cell types in Cortical Primary and Organoid Samples
a) Single-cell sequencing of primary cortical cells identifies a number of cell types. These cell types are labeled in the tSNE plot on the left, and markers of cell type identity depict progenitors (SOX2), outer radial glia (HOPX), intermediate progenitor cells (EOMES), newborn neurons (NEUROD6), maturing neurons (SATB2) and inhibitory interneurons (DLX6-AS1). Single cell data can be explored at: https://organoidreportcard.cells.ucsc.edu. b) Single-cell sequencing of cortical organoid cells generated from four different pluripotent stem cell lines and three protocols with varied levels of directed differentiation generates similar cell types to primary cortex, however the population proportions differ. The proportion of cells for each marker in each sample type are: SOX2+ (primary 15.4%, organoid 41.2%), HOPX+ (primary 7.6%, organoid 4.2%), EOMES+ (primary 4.1%, organoid 1.5%), NEUROD6+ (primary 51.9%, organoid 20.3%), SATB2+ (primary 32.5%, organoid 2.0%), DLX6-AS1+ (primary 17.1%, organoid 3.5%).
Figure 2.
Figure 2.. Molecular Comparisons of Cell Subtypes Between Primary and Organoid Samples
a) Each cluster was classified by marker genes for class, state, type and subtype (primary: n=5 individuals across independent experiments; organoids: n=37 organoids from 4 PSC lines across 4 independent experiments). Correlation between pairwise combinations of marker genes in heatmap (red intensity: Pearson’s correlation from −1 to 1). First histogram indicates cell subtypes in primary (orange) and organoid (blue) samples. Second histogram shows quantitative correlation from the best match for each category averaged across clusters (mean plus standard deviation; subtype vs type: **p= 0.0073, subtype vs state: ****p=0.00008, subtype vs class: ****p= 0.003, Welch’s two-sided t-test). b) Using VariancePartition, the genes defining metadata properties were evaluated for contribution to overall variance. Genes contributing >25% variance by cell type were used in Venn diagram. Box and whisker (mean plus standard deviation) depicts level of specificity at class (****p=4.4e−14), state (****p=4.7e−18), type (****p= 1.02e−20) and subtype level (****p= 5.34e−38). For all comparisons Welch’s two-sided t-test was used (primary: n=5; organoids: n=37). The dot plot depicts discriminating genes between radial glia and neuron identity in primary samples. Each dot is a gene, shown as the average radial glia [x-axis] and neuron [y-axis] expression in primary (orange) or organoid (blue) cells. c) Differential expression (two-tailed Wilcoxon rank sum test) between clusters annotated as oRG cells in primary and organoid datasets generated log2(fold change) [x-axis] and −log10(adjusted p-value measurements) [y-axis] (primary: n=5; organoids: n=37). A pseudocount of 500 was assigned to comparisons with an adjusted p-value of 0. Many measurements were significant, including oRG identity gene, PTPRZ1. Week 8 organoids had minimal co-expression of PTPRZ1 and HOPX (top), while GW15 oSVZ contains extensive co-localization (repeated independently 3x). White arrows: double positive cells; yellow: single positive. Scale bar = 50 uM d) Differential expression (two-tailed Wilcoxon test) between cell clusters annotated as upper layer neurons.
Figure 3.
Figure 3.. Maturation of Cortical Lamina and Radial Glia
a) Immunohistochemistry of SOX2+ progenitors, HOPX+ oRG cells, CTIP2+ deep layer neurons and TBR2+ IPCs in primary and organoid samples during neurogenesis. Primary samples express SOX2 and TBR2 in the VZ and CTIP2 in the cortical plate at GW13. By GW15 HOPX+ oRGs are born and reside in the oSVZ. The cortex expands dramatically over the next weeks with more HOPX+ oRG cells residing in the oSVZ providing a scaffold for neurons to migrate. Organoids express similar markers to GW13 samples by week five of differentiation with multiple VZ-like structures. oRG cells arise and increase between week eight and ten. The radial architecture expands and dissolves over this period. By week 15 a mix of cell types are present in the organoid. Organoids shown were differentiated using the ‘least directed’ differentiation protocol and staining validated independently three times (primary: n=4 biologically independent samples; organoid: n=3 biologically independent samples). Scale bar = 50 uM b) Pseudoage was calculated by identifying networks from a 10,000 cell subset of primary radial glia that highly correlated to age (either positively or negatively). These networks were then collapsed into a single “age network”. The module eigengene for this age network was then calculated on the remaining data and used for pseudoage. Pseduoage is indicated by the graph line and shading represents the geometric density standard error of the regression. The primary dataset (orange) has a high Pearson’s correlation and R-squared value, while the organoid dataset has no correlation to the pseudoage metric.
Figure 4.
Figure 4.. Analysis of Areal Identity in Organoid Excitatory Neurons
a) Each of seven cortical areas was used to generate a unique area gene signature by comparing expression to the other six areas. The unique signatures were considered networks, and module eigengenes across area networks were calculated for each primary and organoid cell. The area with the highest normalized eigengene (normalized to the highest score within each area for equal comparison) was designated as the areal identity of that cell. b) Areal identity was assigned for each cell within an organoid and the areal composition is shown for the 37 organoids in our dataset. Organoid samples are listed from earliest to latest stage collected (weeks 3-24). Within a timepoint, the organoid protocol used is ordered from least to most directed differentiation; each timepoint is comprised of multiple PSC lines. Every organoid has heterogeneous areal expression. c) The average module eigengene score for each primary (orange) and organoid (blue) cell designated (primary) or assigned (organoid) PFC or V1 identity (primary: n=5 independent samples across 5 experiments; organoid: n=37 organoids across 4 independent experiments). The average value for PFC was not significantly different between organoid and primary, while the V1 organoid cells had higher correlation to the V1 signature than primary cells, indicating areal identity in the organoid strongly resembles normal development (mean with standard deviation shown, two-sided Welch’s t-test, p= 0). d) Validation of intermixing of areal identities in organoid samples differentiated using the ‘least directed’ differentiation protocol. In the PFC, BCL11B (CTIP2) and SATB2 co-localize in the same cell, whereas in V1 cells they are mutually exclusive. Both patterns are in close proximity in the organoid. AUTS2 is a rostrally expressed transcription factor while NR2F1 is a caudally expressed factor, but are adjacent in the organoid. Scale bar = 50 uM, representative image shown (n = 3 replicates each).
Figure 5.
Figure 5.. Influence of Culture on Metabolic Stress and Cell Type
a) Primary samples were progenitor-enriched, GFP-labeled and transplanted into organoids. After 2.5 weeks, GFP+ cells were isolated via FACS and processed for scRNA-seq. b) Primary GFP+ cells integrate into organoids differentiated using the ‘least directed’ protocol. Scale bar = 50 uM. Pre-transplantation cells have similar profiles and cellular subtypes as primary data. After transplantation, there is a decrease in subtype correlation (n=7 biologically independent samples across 2 independent experiments). Mean subtype correlation indicated on graph, error bars show standard deviation (p= 2.8e−9, two-sided Welch’s t-test). c) After transplant, primary cells increase expression of stress genes, PGK1 (****p= 1.76e−87, two-sided student’s t-test) and GORASP2 (arrow; ****p= 9.60e−63 two-sided student’s t-test) as indicated by width of colored domain in each respective violin plot (n=7 samples across 2 experiments). Scale bar = 50 uM. d) Organoids were dissociated, GFP labeled, and injected into the cortex of P4 mice. After 2-5 weeks, mouse brains were harvested for scRNA-seq and immunostaining. e) Human cells are visualized by GFP and human nuclear antigen expression (n=13 mice transplanted with 14 organoids derived from 2 iPSC lines across 2 independent experiments). Organoid cells express markers of progenitors (HOPX), neurons (CTIP2, SATB2) and astrocytes (GFAP). Mouse vascular cells (Laminin & CD31) innervate the transplant. f) Post-transplant, organoid cells have reduced expression of stress genes. Scatter plots show decreased staining intensity in transplanted organoids (error bars: standard deviation) of PGK1 (****p= 9.64E-07), ARCN1 (****p=1.28E-05) and GORASP2 (****p=1.88E-06; n=19 sections from 6 transplanted mice across 2 experiments, each marker stained independently; all comparisons used the two-sided student’s t-test). Violin plots show a decrease in PGK1 (****p= 2.16e−17) and GORSASP2 (**p= 0.0019) expression in organoid cells post-transplant from single cell analysis (n= 1980 cells from 7 transplanted mice across 2 experiments, all groups were evaluated using the two-sided Welch’s t-test).

Comment in

  • Imposter syndrome?
    Lewis S. Lewis S. Nat Rev Neurosci. 2020 Apr;21(4):180-181. doi: 10.1038/s41583-020-0280-8. Nat Rev Neurosci. 2020. PMID: 32080403 No abstract available.
  • Benchmarking pluripotent stem cell-derived organoid models.
    De Los Angeles A, Tunbridge EM. De Los Angeles A, et al. Exp Neurol. 2020 Aug;330:113333. doi: 10.1016/j.expneurol.2020.113333. Epub 2020 Apr 27. Exp Neurol. 2020. PMID: 32353463

References

    1. Kadoshima T et al. Self-organization of axial polarity, inside-out layer pattern, and species-specific progenitor dynamics in human ES cell-derived neocortex. Proceedings of the National Academy of Sciences of the United States of America 110, 20284–20289, doi:10.1073/pnas.1315710110 (2013). - DOI - PMC - PubMed
    1. Lancaster MA et al. Cerebral organoids model human brain development and microcephaly. Nature 501, 373–379, doi:10.1038/nature12517 (2013). - DOI - PMC - PubMed
    1. Camp JG et al. Human cerebral organoids recapitulate gene expression programs of fetal neocortex development. Proceedings of the National Academy of Sciences of the United States of America 112, 15672–15677, doi:10.1073/pnas.1520760112 (2015). - DOI - PMC - PubMed
    1. Pollen AA et al. Establishing Cerebral Organoids as Models of Human-Specific Brain Evolution. Cell 176, 743–756 e717, doi:10.1016/j.cell.2019.01.017 (2019). - DOI - PMC - PubMed
    1. Velasco S et al. Individual brain organoids reproducibly form cell diversity of the human cerebral cortex. Nature 570, 523–527, doi:10.1038/s41586-019-1289-x (2019). - DOI - PMC - PubMed

Publication types