

ERG shrinks by 10% when reducing dark adaptation time to 10 min, but only for weak flashes
- PMID: 31997114
- PMCID: PMC7347516
- DOI: 10.1007/s10633-020-09751-6
ERG shrinks by 10% when reducing dark adaptation time to 10 min, but only for weak flashes
Abstract
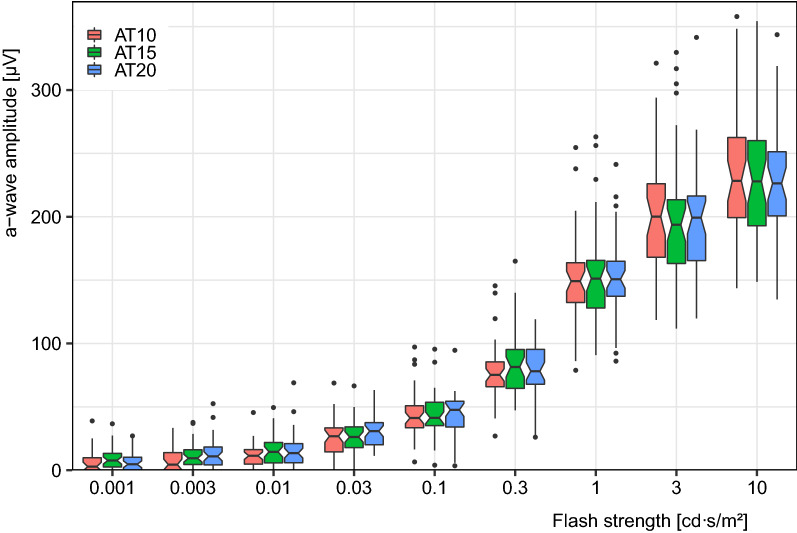
Purpose: To compare dark-adapted (DA) ERG between 10, 15 and 20 min of dark adaptation (DA).
Methods: In a counterbalanced random block design, 40 healthy adult subjects were dark-adapted for 10, 15 or 20 min before we recorded ERGs to nine flash strengths from 0.001 to 10.0 cd s/m2 (dilated pupils) with a DTL-like electrode. Before and between sessions, the room was lit. Apart from choosing a wider range of stimulus strengths, and adding shorter DA times, the recordings fully complied with the ISCEV ERG Standard, namely using corneal electrodes, mydriasis and a standard DA sequence.
Results: The a-wave amplitude was not affected by any adaptation condition. For the b-wave amplitude, effects of reduced DA time are stronger for weaker flashes: Reducing DA from 20 to 10 min had no measurable effect on the DA 3 ERG, but reduced the DA 0.01 b-wave significantly (p < 0.0001) to 87 ± 2% (mean ± SEM). The DA 0.001 b-wave (not part of the ISCEV ERG Standard) was more affected (down to 72 ± 4%). There was a small, but significant, increase, only for weak flashes, in a- and b-wave peak times for 20 compared to 10-min dark adaptation time.
Conclusion: Reducing dark adaptation time from 20 to 10 min in normal participants has no effect on the ISCEV DA 3 and DA 10 ERG. The reduction in DA 0.01 ERGs to 87 ± 2% agrees with Hamilton and Graham (Doc Ophthalmol 133:11-19, 2016. https://doi.org/10.1007/s10633-016-9554-x ) who found 90 ± 2% and with Asakawa et al. (Doc Ophthalmol 139:33-44, 2019. https://doi.org/10.1007/s10633-019-09693-8 ) who found 83%. Pending verification in pathophysiological states, the current results suggest that one might be able to correct for the 10% amplitude loss when gaining 10 min through shortened DA.
Keywords: Dark adaptation; Dark-adapted ERG; ISCEV ERG Standard; Time.
Conflict of interest statement
The authors declare that they have no conflict of interests.
Figures


Similar articles
-
Human retinal dark adaptation tracked in vivo with the electroretinogram: insights into processes underlying recovery of cone- and rod-mediated vision.J Physiol. 2022 Nov;600(21):4603-4621. doi: 10.1113/JP283105. Epub 2022 Jun 7. J Physiol. 2022. PMID: 35612091 Free PMC article. Review.
-
Effect of shorter dark adaptation on ISCEV standard DA 0.01 and DA 3 skin ERGs in healthy adults.Doc Ophthalmol. 2016 Aug;133(1):11-9. doi: 10.1007/s10633-016-9554-x. Epub 2016 Jul 9. Doc Ophthalmol. 2016. PMID: 27394667
-
Dark-adapted red flash ERGs in healthy adults.Doc Ophthalmol. 2018 Aug;137(1):1-8. doi: 10.1007/s10633-018-9642-1. Epub 2018 Jun 1. Doc Ophthalmol. 2018. PMID: 29858967 Free PMC article.
-
ISCEV extended protocol for the dark-adapted red flash ERG.Doc Ophthalmol. 2018 Jun;136(3):191-197. doi: 10.1007/s10633-018-9644-z. Epub 2018 Jun 22. Doc Ophthalmol. 2018. PMID: 29934801 Free PMC article.
-
Full-field electroretinogram in autism spectrum disorder.Doc Ophthalmol. 2016 Apr;132(2):83-99. doi: 10.1007/s10633-016-9529-y. Epub 2016 Feb 11. Doc Ophthalmol. 2016. PMID: 26868825
Cited by
-
Human retinal dark adaptation tracked in vivo with the electroretinogram: insights into processes underlying recovery of cone- and rod-mediated vision.J Physiol. 2022 Nov;600(21):4603-4621. doi: 10.1113/JP283105. Epub 2022 Jun 7. J Physiol. 2022. PMID: 35612091 Free PMC article. Review.
-
Synthetic electroretinogram signal generation using a conditional generative adversarial network.Doc Ophthalmol. 2025 Apr 16. doi: 10.1007/s10633-025-10019-0. Online ahead of print. Doc Ophthalmol. 2025. PMID: 40240677
-
Enhancing Electroretinogram Classification with Multi-Wavelet Analysis and Visual Transformer.Sensors (Basel). 2023 Oct 26;23(21):8727. doi: 10.3390/s23218727. Sensors (Basel). 2023. PMID: 37960427 Free PMC article.
References
-
- Bach M (2007) What a good electrophysiology system should look like, IMHO. ISCEV@ARVO, 2007-05-05
Publication types
MeSH terms
LinkOut - more resources
Full Text Sources
