An official website of the United States government
The .gov means it’s official.
Federal government websites often end in .gov or .mil. Before
sharing sensitive information, make sure you’re on a federal
government site.
The site is secure.
The https:// ensures that you are connecting to the
official website and that any information you provide is encrypted
and transmitted securely.
1 Department of Radiology and Center for Imaging Science, Samsung Medical Center, Sungkyunkwan University School of Medicine, Seoul, Korea.
2 Department of Radiology and Medical Research Institute, Pusan National University Hospital, Pusan National University School of Medicine, Busan, Korea.
3 School of Electronic and Electrical Engineering, Sungkyunkwan University, Suwon, Korea.
4 Center for Neuroscience Imaging Research, Institute for Basic Science, Suwon, Korea.
5 Department of Radiology, Kangwon National University Hospital, Kangwon National University School of Medicine, Chuncheon, Korea.
6 Department of Radiology and Center for Imaging Science, Samsung Medical Center, Sungkyunkwan University School of Medicine, Seoul, Korea. hoyunlee96@gmail.com.
Ideally, radiomics features and radiomics signatures can be used as imaging biomarkers for diagnosis, staging, prognosis, and prediction of tumor response. Thus, the number of published radiomics studies is increasing exponentially, leading to a myriad of new radiomics-based evidence for lung cancer. Consequently, it is challenging for radiologists to keep up with the development of radiomics features and their clinical applications. In this article, we review the basics to advanced radiomics in lung cancer to guide young researchers who are eager to start exploring radiomics investigations. In addition, we also include technical issues of radiomics, because knowledge of the technical aspects of radiomics supports a well-informed interpretation of the use of radiomics in lung cancer.
The authors have no potential conflicts of interest to disclose.
Figures
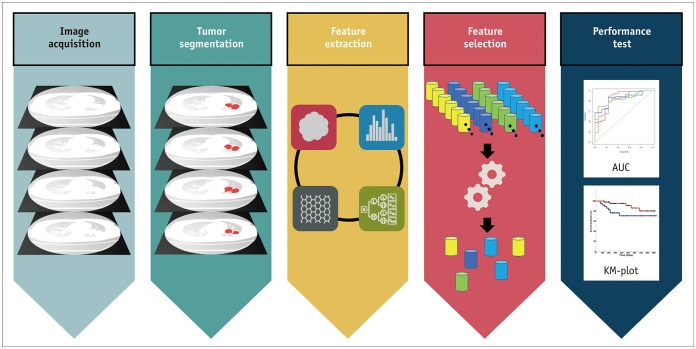
Fig. 1. Steps of radiomics: radiomics process…
Fig. 1. Steps of radiomics: radiomics process starts with image acquisition and tumor segmentation, followed…
Fig. 1. Steps of radiomics: radiomics process starts with image acquisition and tumor segmentation, followed by feature extraction and selection, and ends with performance testing.
AUC = area under curve, KM = Kaplan-Meier
Fig. 2. Generation of intratumor and peritumoral…
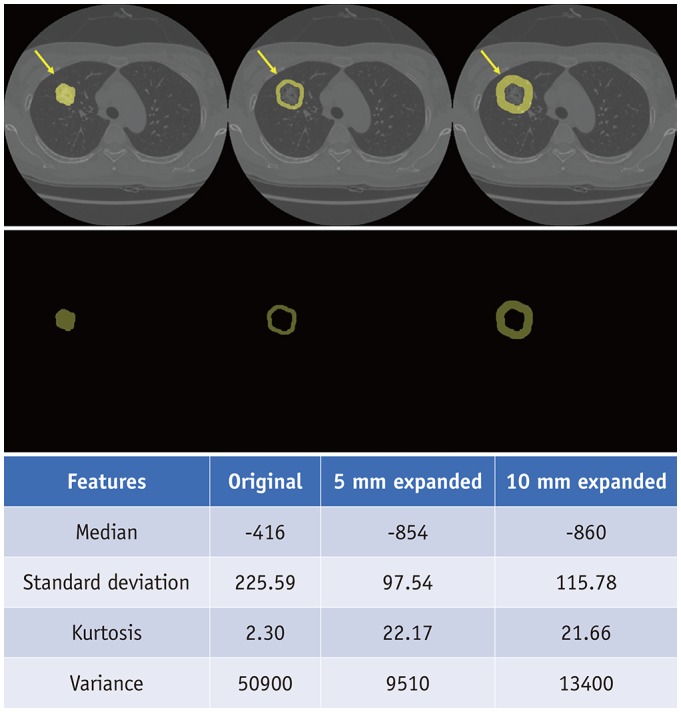
Fig. 2. Generation of intratumor and peritumoral regions of lung adenocarcinoma in 57-year-old woman.
Yellow…
Fig. 2. Generation of intratumor and peritumoral regions of lung adenocarcinoma in 57-year-old woman.
Yellow arrows indicate region of interests. Lower table demonstrates decrease of median Hounsfield units and increase in standard deviation from intratumor to 5 mm peritumoral and 10 mm peritumoral regions, suggesting reflection of tumor microenvironment.
Fig. 3. Clustering approach achieved by combining…
Fig. 3. Clustering approach achieved by combining FDG-PET and contrast-enhanced CT to identify intratumor heterogeneity…
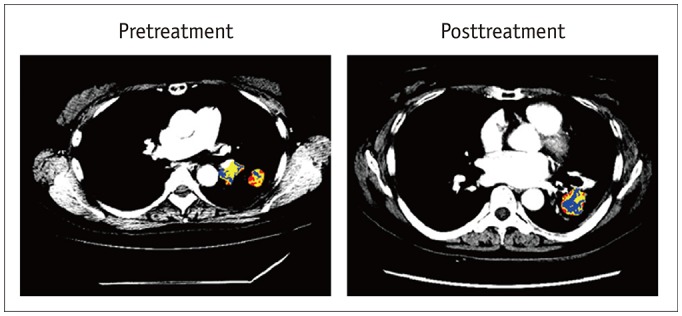
Fig. 3. Clustering approach achieved by combining FDG-PET and contrast-enhanced CT to identify intratumor heterogeneity in 63-year-old woman with lung adenocarcinoma.
Pretreatment image exhibits heterogeneous tumor areas of various colors showing multiple patterns of tumor vascularity from contrast-enhanced CT and glucose metabolism from FDG-PET. One-year posttreatment with afatinib reveals tumor with central area of low vascularity and low metabolism (blue), suggesting effective treatment. Blue area represents low vascularity and low metabolism, yellow area represents low vascularity and high metabolism or high vascularity and low metabolism, and red area represents high vascularity and high metabolism. FDG = 18F-fluorodeoxyglucose, PET = positron-emission tomography
Fig. 4. Interval CT images of 70-year-old…
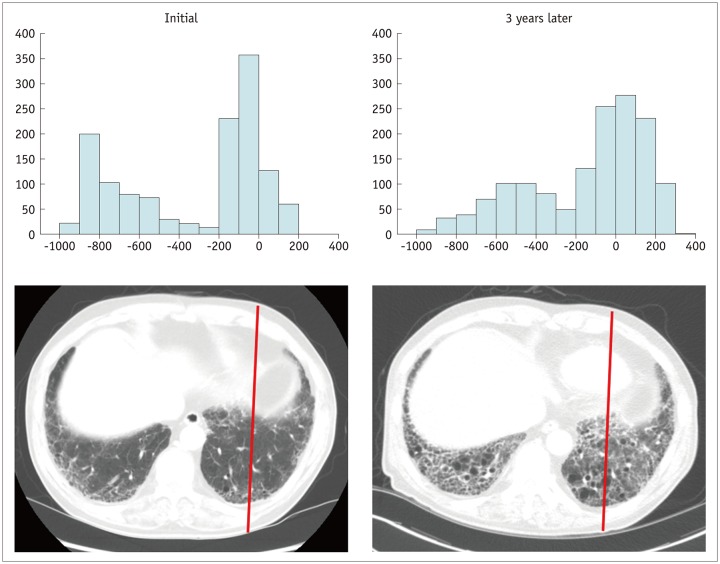
Fig. 4. Interval CT images of 70-year-old man with idiopathic pulmonary fibrosis.
Compared to histogram…
Fig. 4. Interval CT images of 70-year-old man with idiopathic pulmonary fibrosis.
Compared to histogram of initial CT scan, histogram of CT scan obtained three years later demonstrates right-side shifting of Hounsfield unit pixels due to microscopic interstitial fibrosis, suggesting progression of idiopathic pulmonary fibrosis.
Fig. 5. Example of tumor volume segmentation…
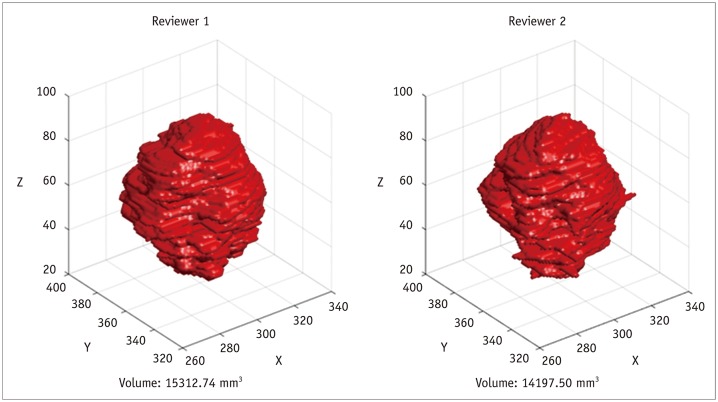
Fig. 5. Example of tumor volume segmentation by two different reviewers.
Results show inter-reader variability.
Fig. 5. Example of tumor volume segmentation by two different reviewers.
Results show inter-reader variability.
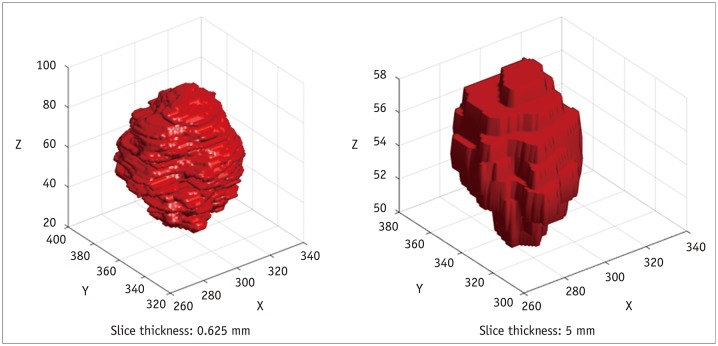
Fig. 6. Effect of CT slice thickness…
Fig. 6. Effect of CT slice thickness on tumor visualization.
Thick-section CT scan (right) demonstrates…
Fig. 6. Effect of CT slice thickness on tumor visualization.
Thick-section CT scan (right) demonstrates more partial volume artifacts compared to thin-section CT scan (left).
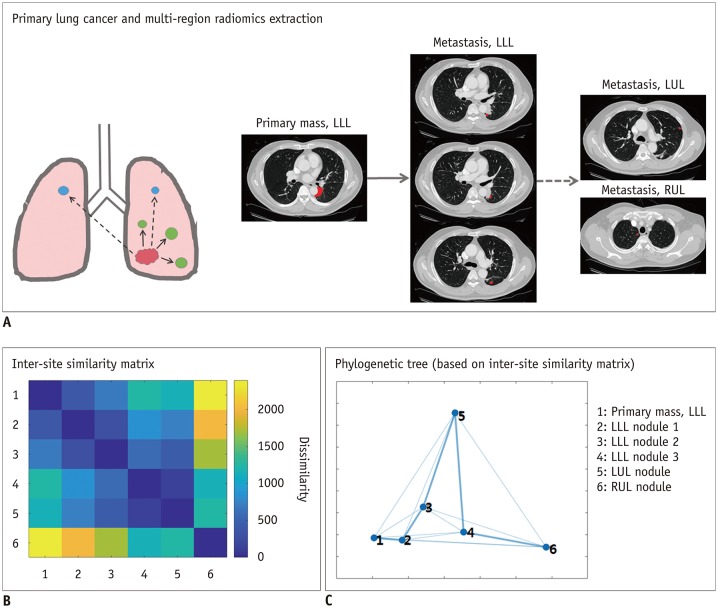
Fig. 7. Tracking cancer evolution from primary…
Fig. 7. Tracking cancer evolution from primary tumor to metastases using multi-region radiomics and inter-site…
Fig. 7. Tracking cancer evolution from primary tumor to metastases using multi-region radiomics and inter-site modeling.
A. Multi-region radiomics extraction from patient with primary lung cancer in LLL and multiple metastatic nodules in LLL, LUL, and RUL. (B) Inter-site similarity matrix and (C) phylogenetic tree (based on inter-site similarity matrix) demonstrate degrees of dissimilarity with each other, which indicates evolutional sequences through all lesions. Numbers indicate numeric codes for lesion locations. LLL = left lower lobe, LUL = left upper lobe, RUL = right upper lobe
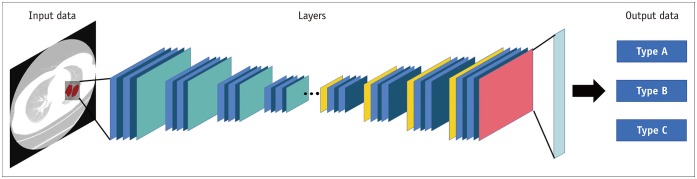
Fig. 8. Example of deep learning architectures…
Fig. 8. Example of deep learning architectures for lung cancer classification based on multi-layers.
Fig. 8. Example of deep learning architectures for lung cancer classification based on multi-layers.
He L, Huang Y, Ma Z, Liang C, Liang C, Liu Z. Effects of contrast-enhancement, reconstruction slice thickness and convolution kernel on the diagnostic performance of radiomics signature in solitary pulmonary nodule. Sci Rep. 2016;6:34921.
-
PMC
-
PubMed
Dennie C, Thornhill R, Sethi-Virmani V, Souza CA, Bayanati H, Gupta A, et al. Role of quantitative computed tomography texture analysis in the differentiation of primary lung cancer and granulomatous nodules. Quant Imaging Med Surg. 2016;6:6–15.
-
PMC
-
PubMed
Alilou M, Beig N, Orooji M, Rajiah P, Velcheti V, Rakshit S, et al. An integrated segmentation and shape-based classification scheme for distinguishing adenocarcinomas from granulomas on lung CT. Med Phys. 2017;44:3556–3569.
-
PMC
-
PubMed
Beig N, Khorrami M, Alilou M, Prasanna P, Braman N, Orooji M, et al. Perinodular and intranodular radiomic features on lung CT images distinguish adenocarcinomas from granulomas. Radiology. 2019;290:783–792.
-
PMC
-
PubMed
Aerts HJ, Velazquez ER, Leijenaar RT, Parmar C, Grossmann P, Carvalho S, et al. Decoding tumour phenotype by noninvasive imaging using a quantitative radiomics approach. Nat Commun. 2014;5:4006.
-
PMC
-
PubMed