

Basic mathematical errors may make ecological assessments unreliable
- PMID: 31997854
- PMCID: PMC6956893
- DOI: 10.1007/s10531-017-1418-5
Basic mathematical errors may make ecological assessments unreliable
Abstract
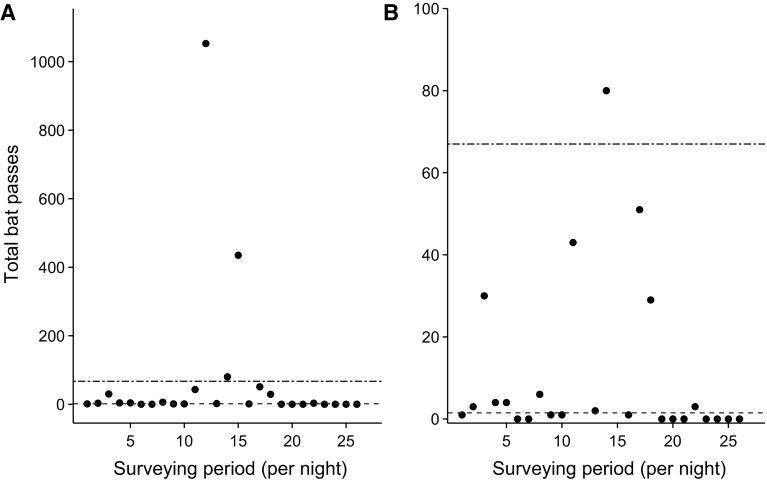
Environmental impact assessments (EIAs) are used globally as the evidence-base for planning decisions, yet their efficacy is uncertain. Given that EIAs are extremely expensive and are enshrined in legislation, their place in evidence-based decision making deserves evaluation. The mean is the most commonly used summary statistic in ecological assessments, yet it is unlikely to be a good summary where the distribution of data is skewed; and its use without any indication of variability can be highly misleading. Here, using bats as an example, we show that EIAs frequently summarise these data using the mean or fail to define the term 'average'. This can lead to the systematic misinterpretation of evidence which has serious implications for assessing risk. There is therefore a pressing need for guidance to specify data processing techniques so that planning decisions are made on a firm evidence-base. By ensuring that data processing is systematic and transparent it will result in mitigation decisions and conservation strategies that are cost-effective and proportionate to the predicted degree of risk.
Keywords: Chiroptera; Conservation management; Environmental impact assessment; Mitigation; Statistics.
© The Author(s) 2017.
Figures
References
-
- Battersby J (2010) Guidelines for surveillance and monitoring of European bats. EUROBATS publication series no. 5. UNEP/EUROBATS Secretariat, Bonn
-
- Elkin TJ, Smith PGR. What is a good environmental impact statement? Reviewing screening reports from Canada’s National Parks. J Environ Manage. 1988;26:71–89.
-
- Fischer J, Stott J, Law BS, Adams MD, Forrester RI. Designing effective habitat studies: quantifying multiple sources of variability in bat activity. Acta Chiropterol. 2009;11:127–137. doi: 10.3161/150811009X465749. - DOI
-
- Mathews F, Richardson S, Lintott PR, Hosken D (2016) Understanding the risk to European protected species (bats) at onshore wind turbine sites to inform risk management. Department for Environment Food and Rural Affairs Science and Research Projects, WCO0753 final report (Phase 2)
-
- Skalak SL, Sherwin RE, Brigham M. Sampling period, size and duration influence measures of bat species richness from acoustic surveys. Methods Ecol Evol. 2012;3:490–502. doi: 10.1111/j.2041-210X.2011.00177.x. - DOI
Publication types
LinkOut - more resources
Full Text Sources