. 2017;77(10):663.
doi: 10.1140/epjc/s10052-017-5199-5. Epub 2017 Oct 4.

Parton distributions from high-precision collider data: NNPDF Collaboration

Affiliations

Parton distributions from high-precision collider data: NNPDF Collaboration

Richard D Ball et al. Eur Phys J C Part Fields. 2017.

Abstract

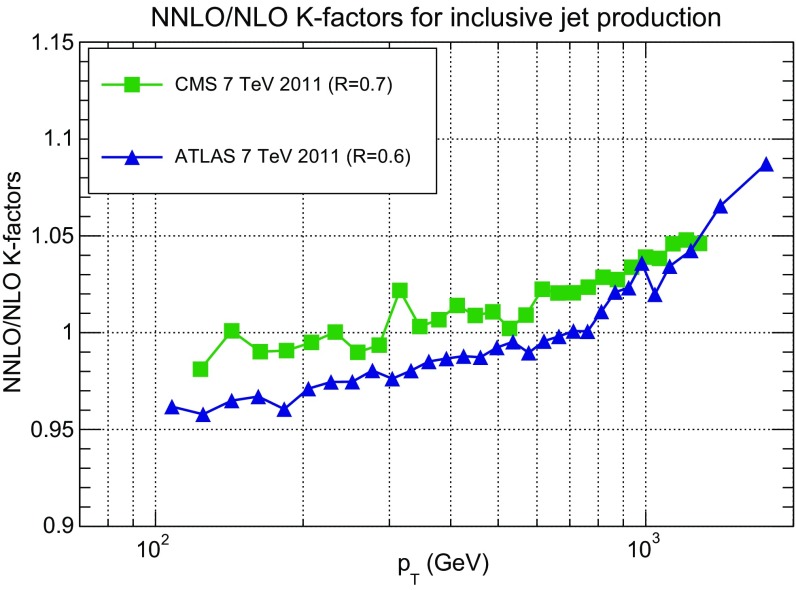
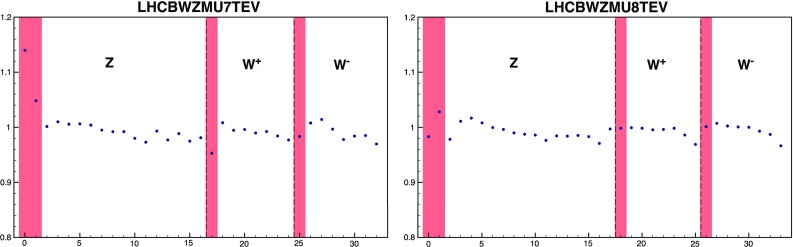
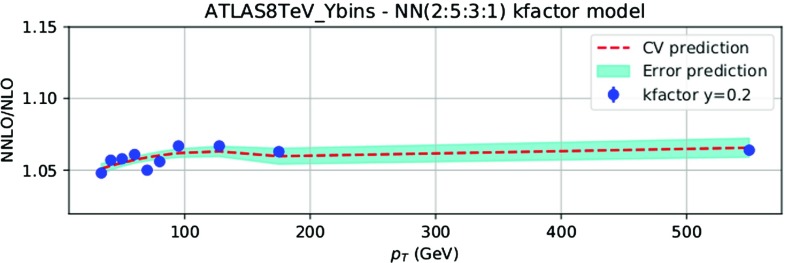
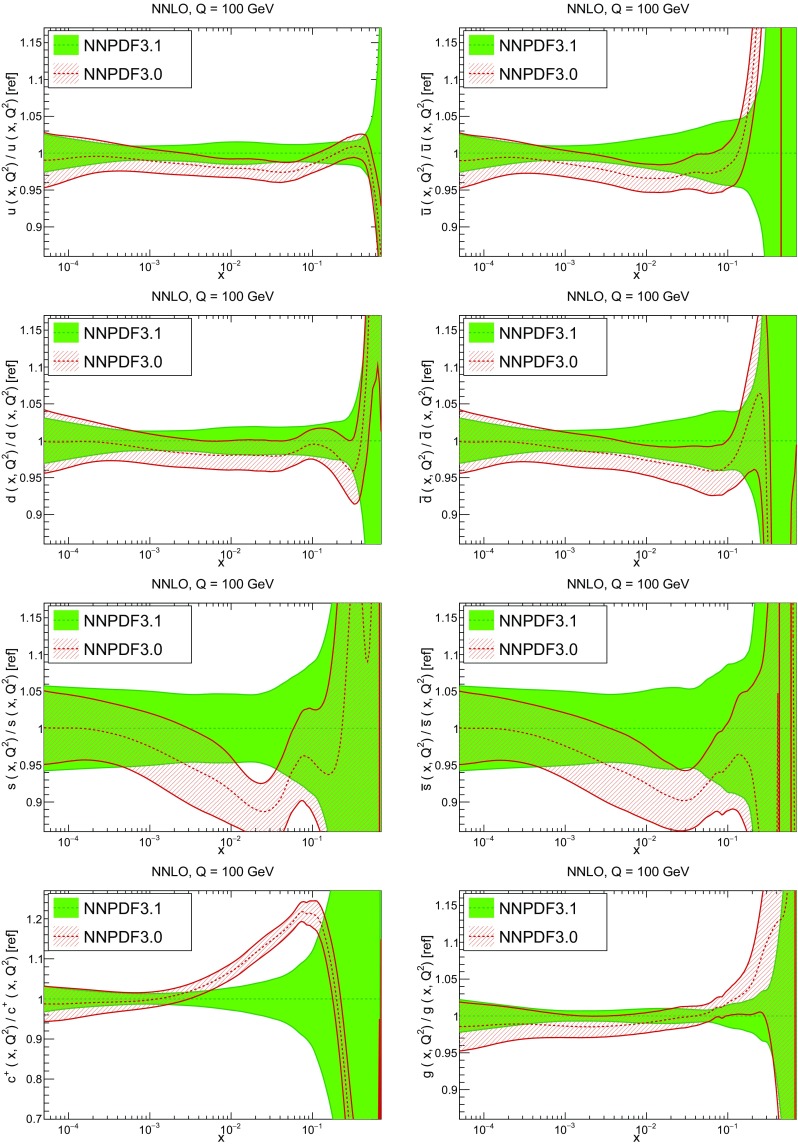
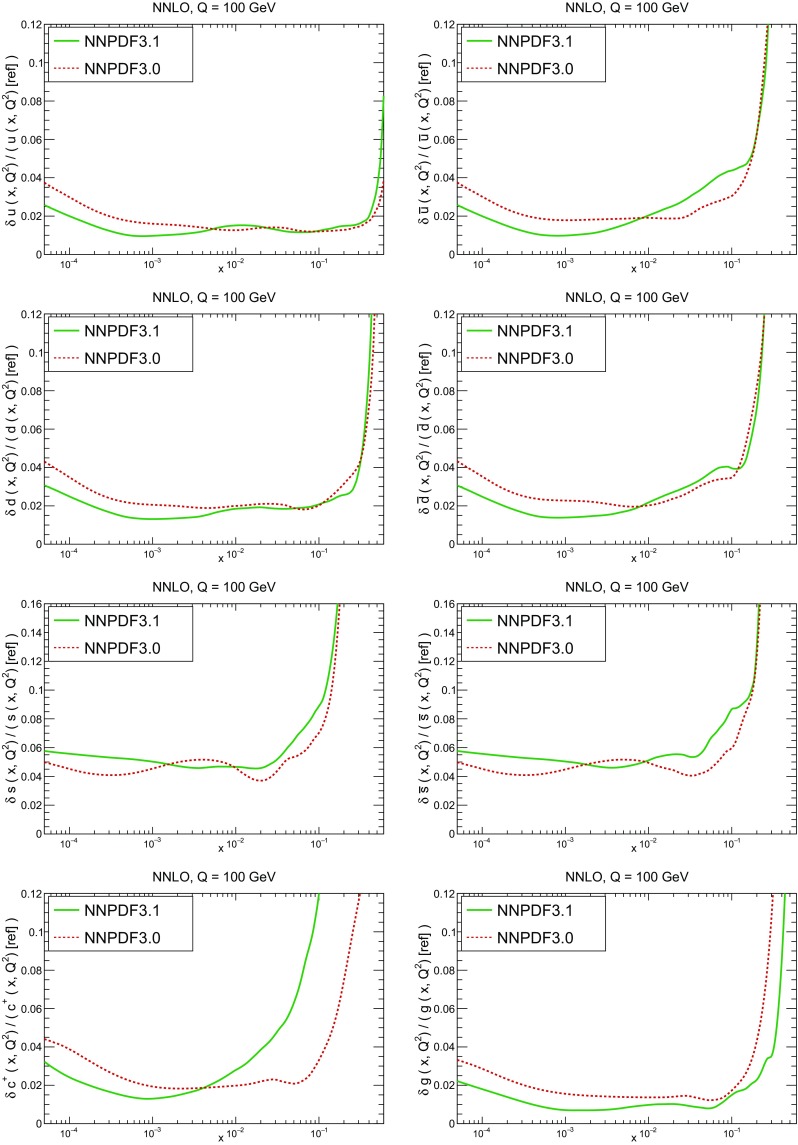
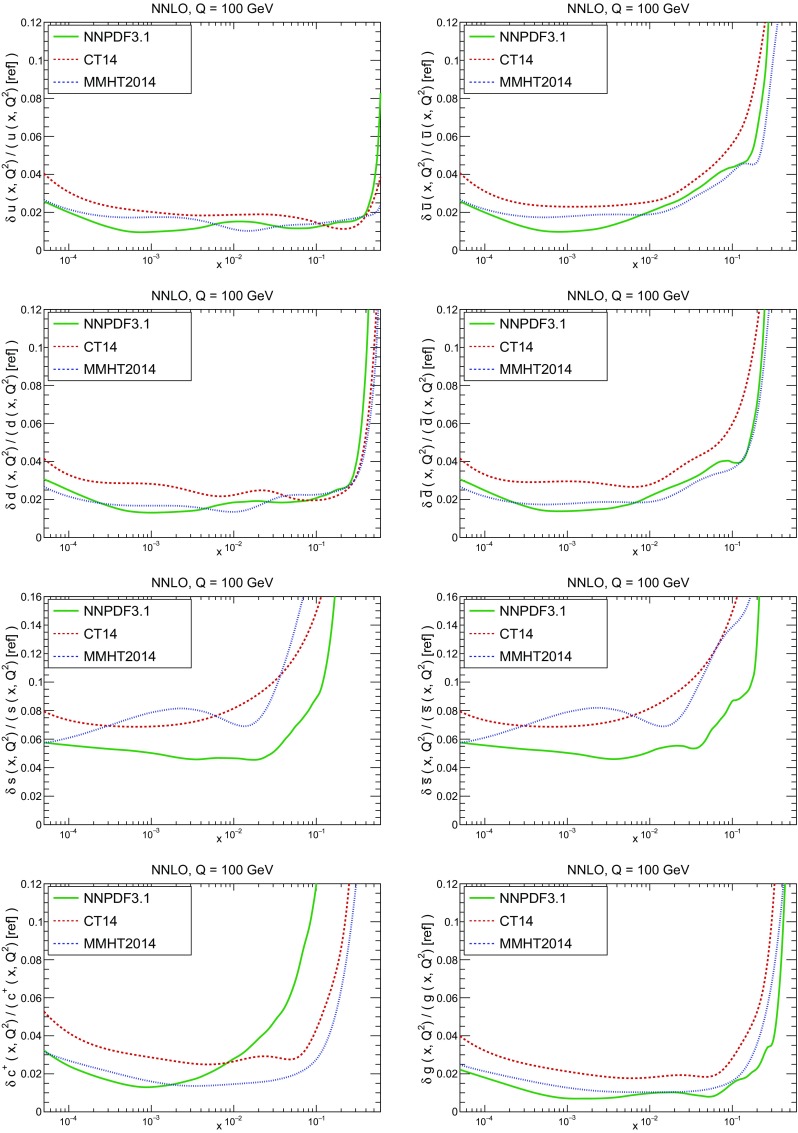
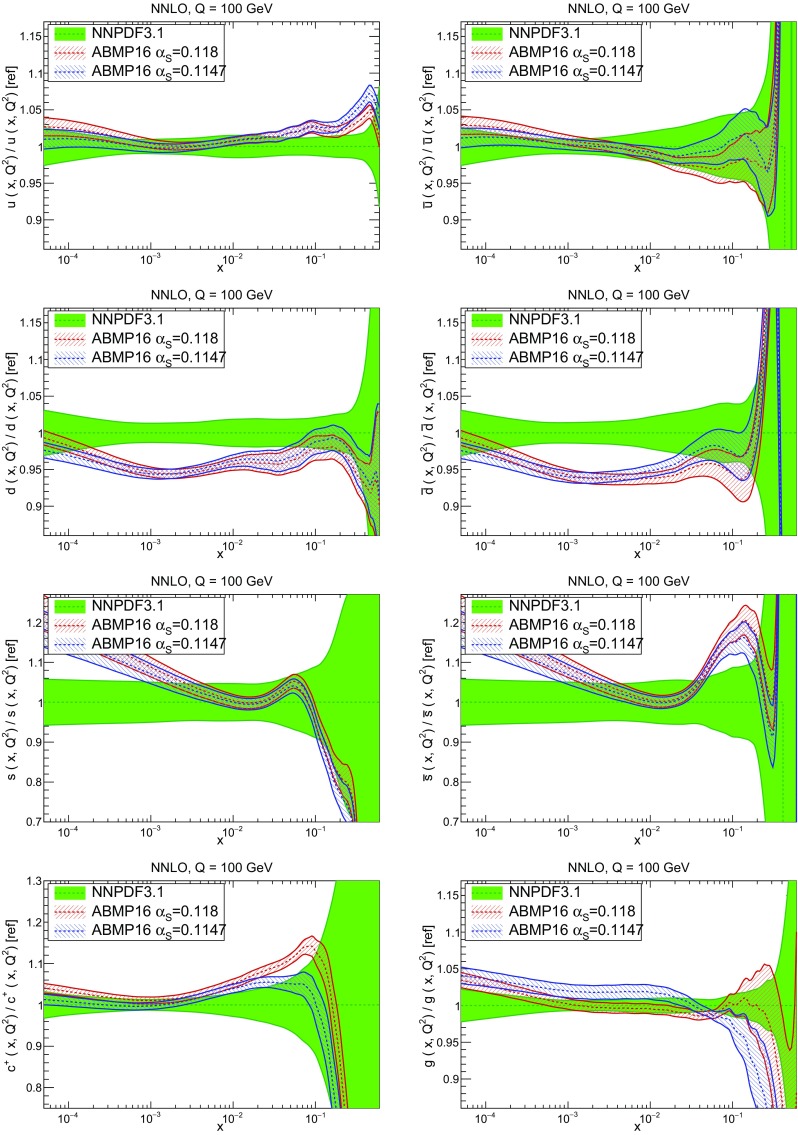
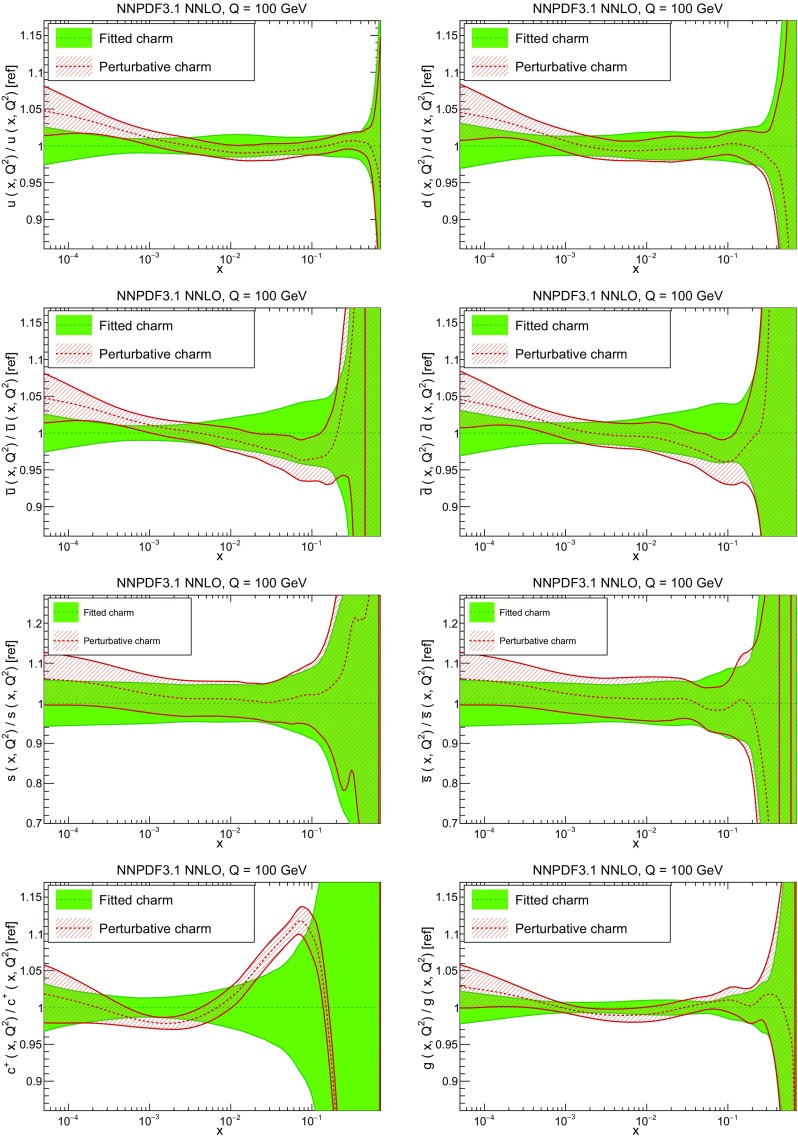
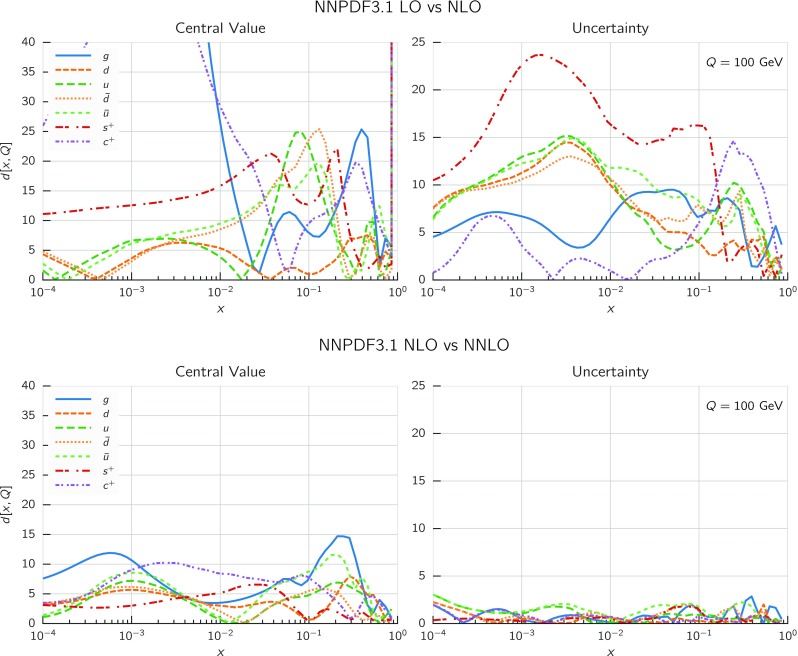
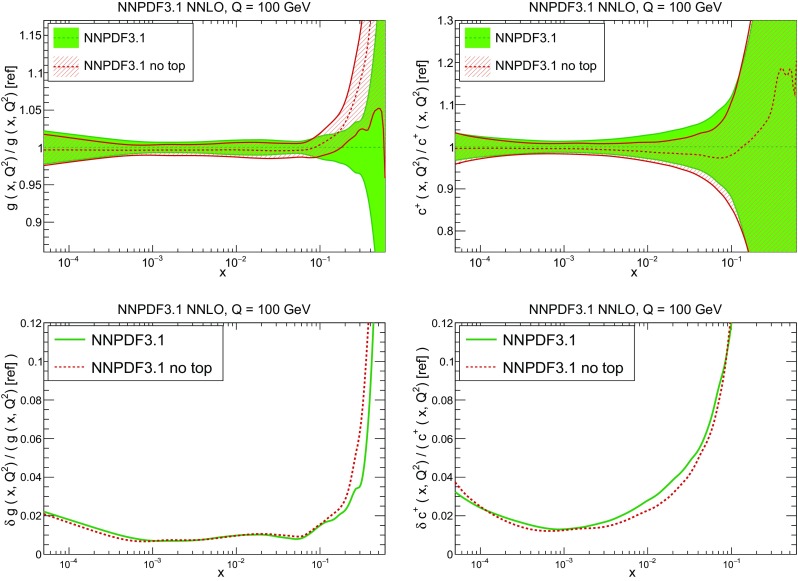
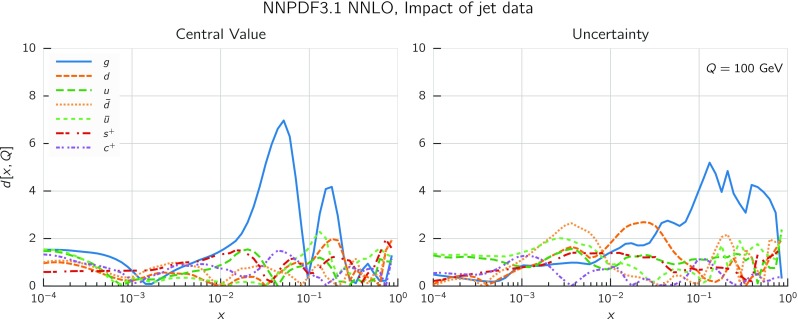
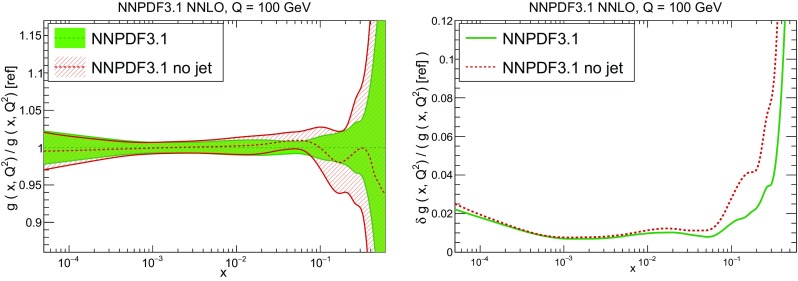
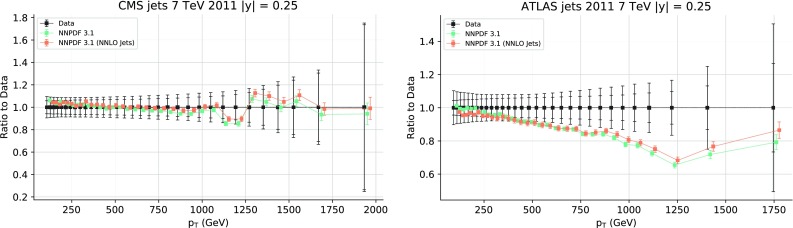
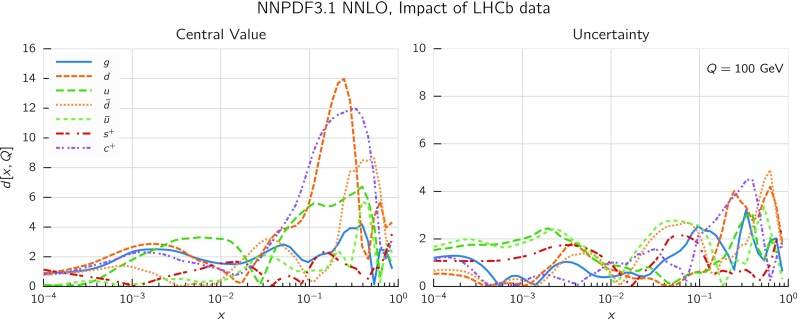
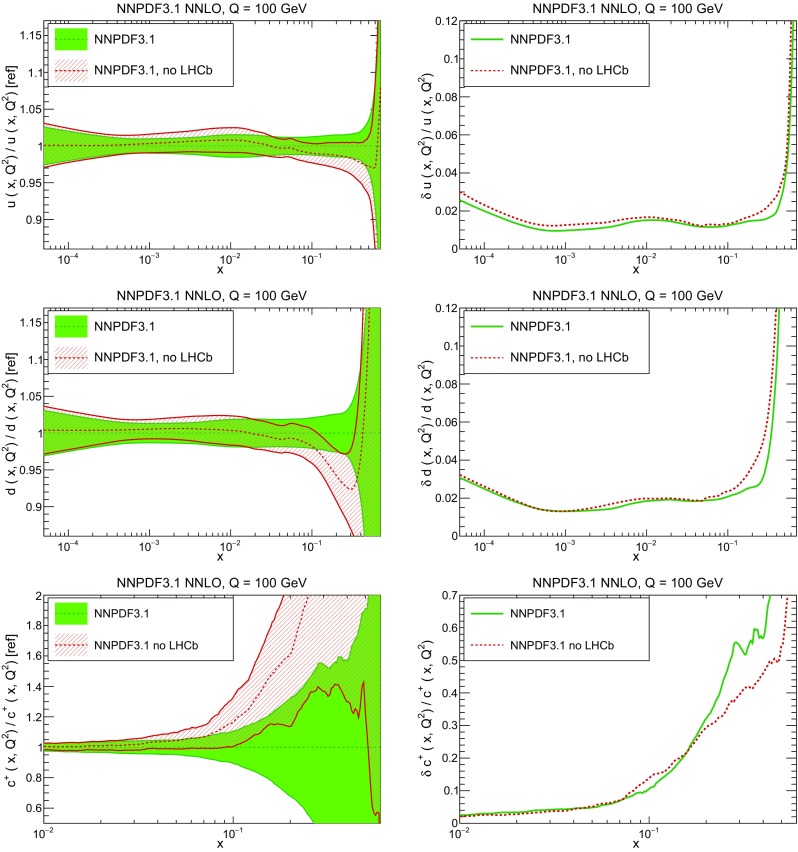
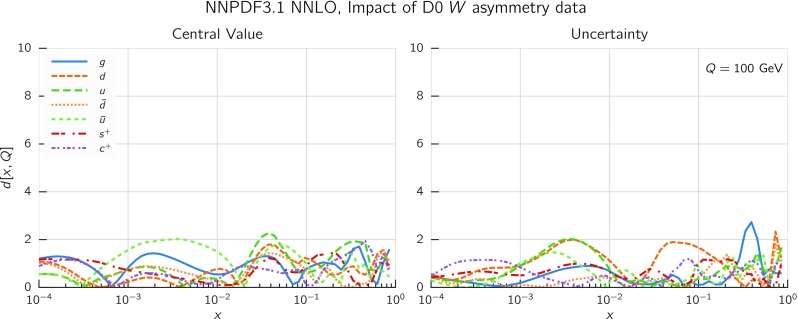
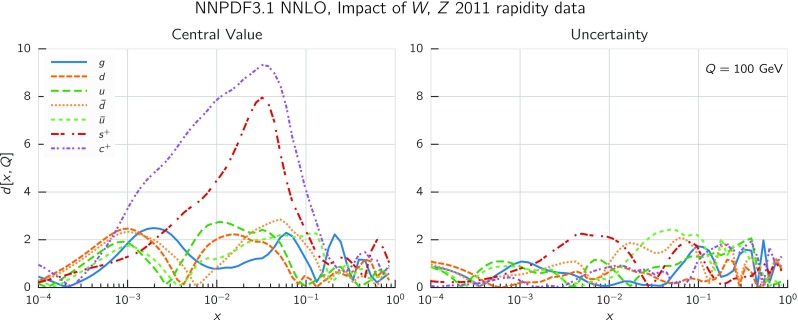
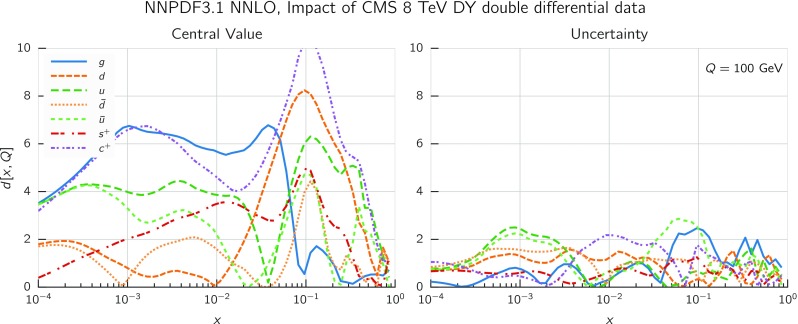
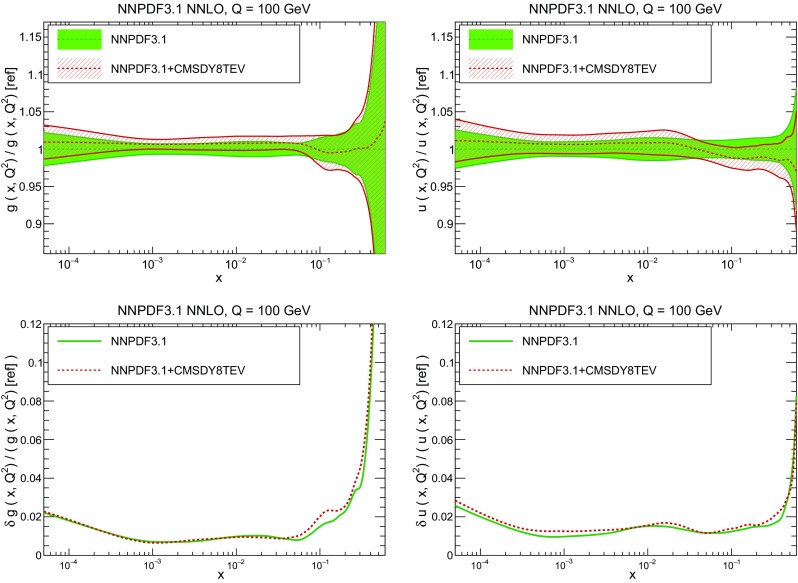
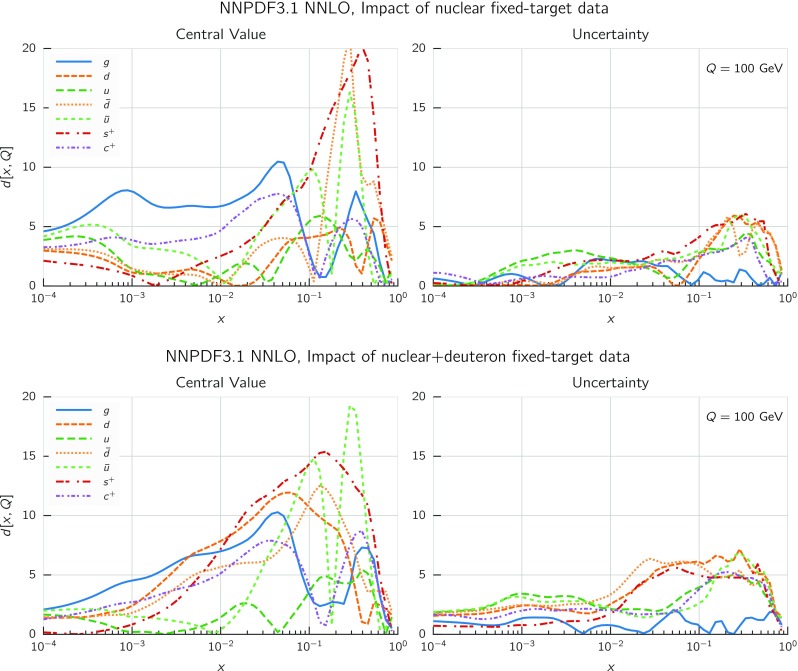
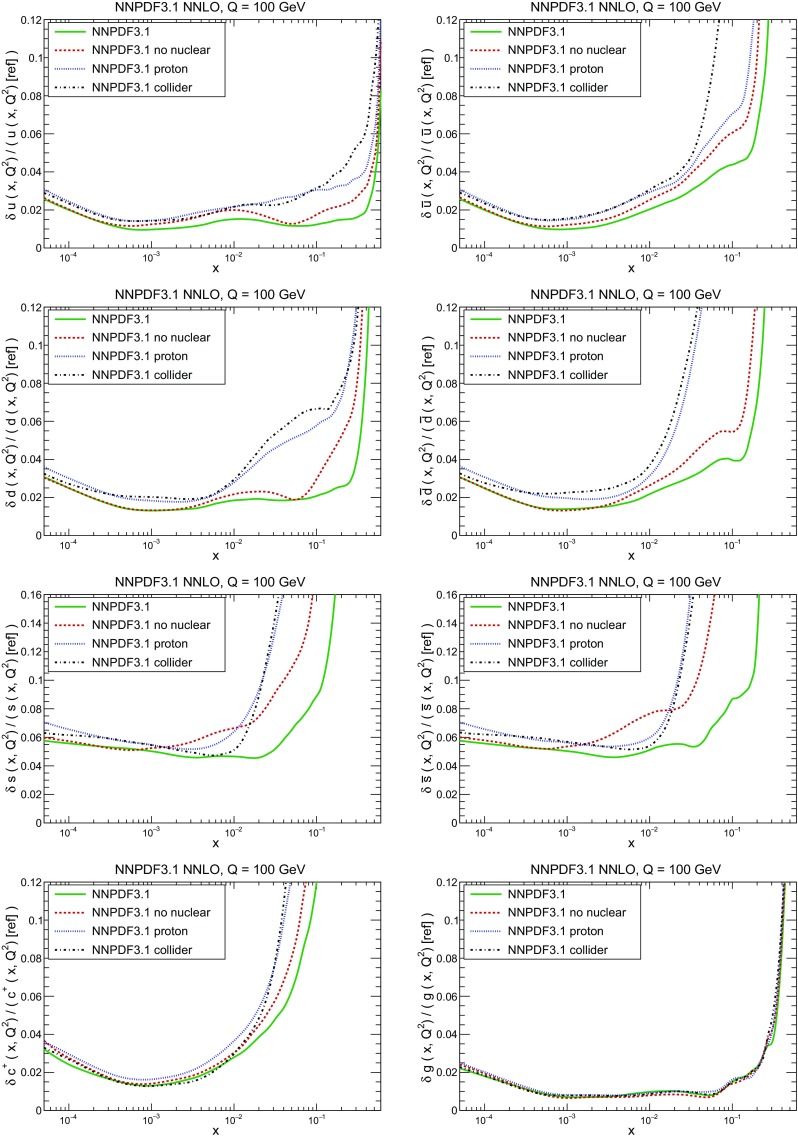
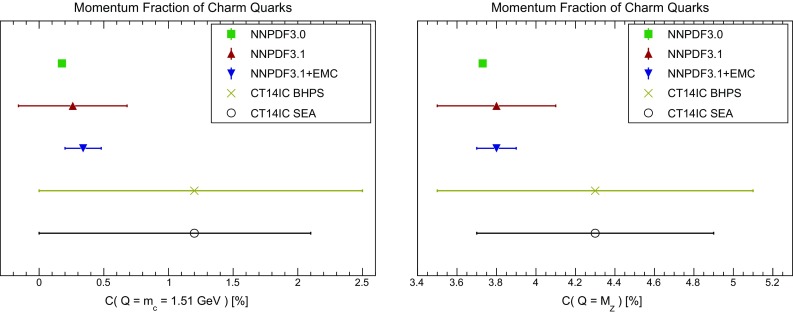
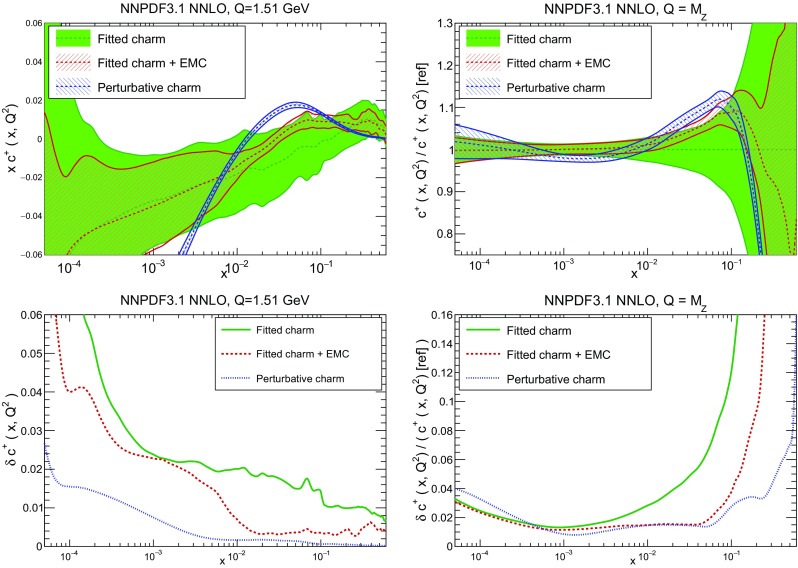
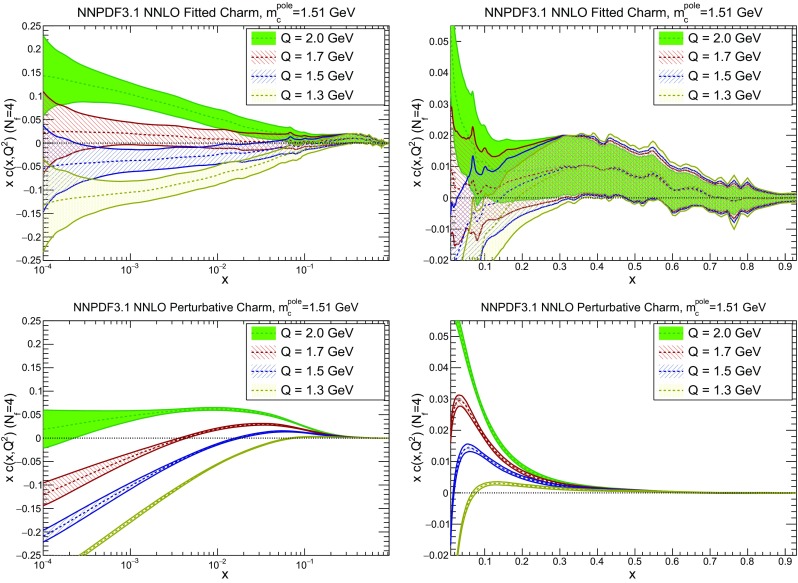
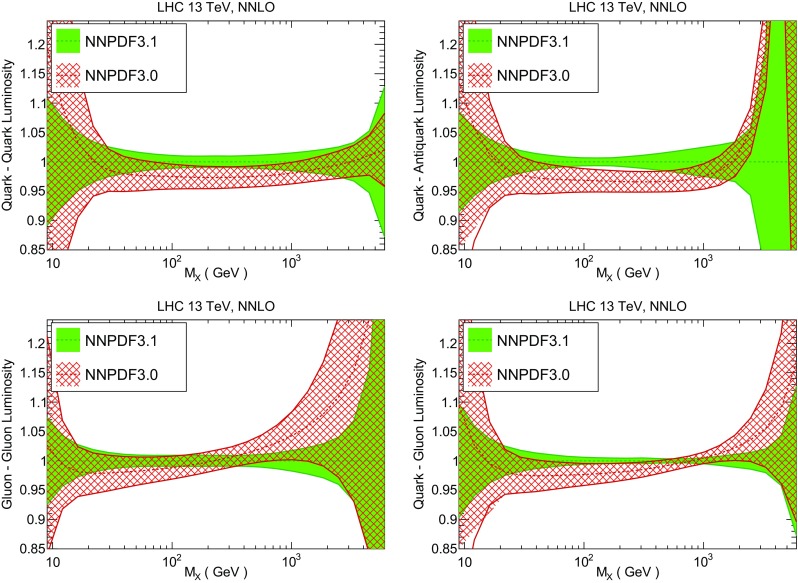
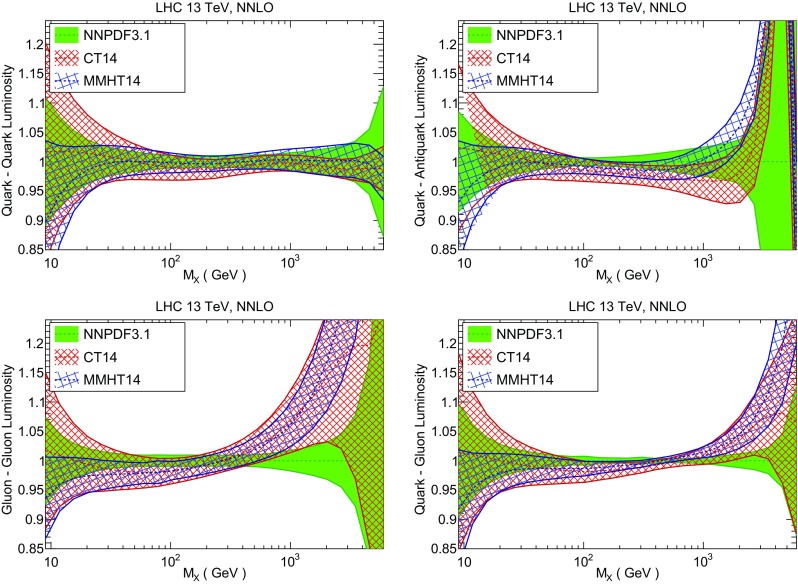
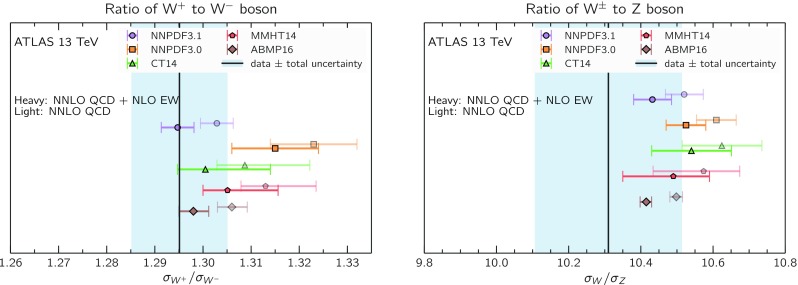
We present a new set of parton distributions, NNPDF3.1, which updates NNPDF3.0, the first global set of PDFs determined using a methodology validated by a closure test. The update is motivated by recent progress in methodology and available data, and involves both. On the methodological side, we now parametrize and determine the charm PDF alongside the light-quark and gluon ones, thereby increasing from seven to eight the number of independent PDFs. On the data side, we now include the D0 electron and muon W asymmetries from the final Tevatron dataset, the complete LHCb measurements of W and Z production in the forward region at 7 and 8 TeV, and new ATLAS and CMS measurements of inclusive jet and electroweak boson production. We also include for the first time top-quark pair differential distributions and the transverse momentum of the Z bosons from ATLAS and CMS. We investigate the impact of parametrizing charm and provide evidence that the accuracy and stability of the PDFs are thereby improved. We study the impact of the new data by producing a variety of determinations based on reduced datasets. We find that both improvements have a significant impact on the PDFs, with some substantial reductions in uncertainties, but with the new PDFs generally in agreement with the previous set at the one-sigma level. The most significant changes are seen in the light-quark flavor separation, and in increased precision in the determination of the gluon. We explore the implications of NNPDF3.1 for LHC phenomenology at Run II, compare with recent LHC measurements at 13 TeV, provide updated predictions for Higgs production cross-sections and discuss the strangeness and charm content of the proton in light of our improved dataset and methodology. The NNPDF3.1 PDFs are delivered for the first time both as Hessian sets, and as optimized Monte Carlo sets with a compressed number of replicas.


Figures

Fig. 1
Fig. 1
The kinematic coverage of the NNPDF3.1 dataset in the x,Q2 plane
Fig. 2
Fig. 2
The fractional scale uncertainty on NLO single-inclusive jet production, as a function of the jet pT for the central rapidity bins of ATLAS 7 TeV 2011 (left) and the CMS 2.76 TeV (right)
Fig. 3
Fig. 3
The NNLO/NLO cross-section ratio [110] for the central rapidity bin (0|yjet|0.5) of the ATLAS and CMS 7 TeV 2011 jet data, with the values of R of Table 5, plotted vs. pT
Fig. 4
Fig. 4
The NNLO/NLO cross-section for the LHCb 7 (left) and 8 TeV (right) data. The central rapidity region which is cut is shaded in red
Fig. 5
Fig. 5
The NNLO/NLO cross-section for the ZpT data corresponding to the acceptance cuts and binning of the ATLAS 7 TeV (top left), CMS 8 TeV (top right), and the ATLAS 8 TeV (bottom) rapidity (left) and invariant mass (right) distributions
Fig. 6
Fig. 6
The NNLO/NLO cross-section ratio in the central rapidity bin of the 8 TeV ATLAS ZpT distribution. The result of a fit and its associate uncertainty are also shown
Fig. 7
Fig. 7
The NNLO/NLO cross-section ratio for the top-quark rapidity yt (left) and top-quark pair rapidity ytt¯ (right) corresponding to the 8 TeV ATLAS and CMS data. Results obtained with three different input PDF sets, NNPDF3.0, CT14, and MMHT14, are shown
Fig. 8
Fig. 8
The NNPDF3.1 NNLO PDFs, evaluated at μ2=10GeV2 (left) and μ2=104GeV2 (right)
Fig. 9
Fig. 9
Distances between the central values (left) and the uncertainties (right) of the NNPDF3.0 and NNPDF3.1 NNLO PDF sets, evaluated at Q=100 GeV. Note the different in scale on the y axis between the two plots
Fig. 10
Fig. 10
Comparison between NNPDF3.1 and NNPDF3.0 NNLO PDFs at Q=100 GeV. From top to bottom up and anti-up, down and antidown, strange and antistrange, charm and gluon are shown
Fig. 11
Fig. 11
Comparison between NNPDF3.1 and NNPDF3.0 relative PDF uncertainties at Q=100; the PDFs are as in Fig. 10. The uncertainties shown are all normalized to the NNPDF3.1 central value
Fig. 12
Fig. 12
Comparison between NNPDF3.1, CT14 and MMHT2014 NNLO PDFs. The comparison is performed at Q=100 GeV, and results are shown normalized to the central value of NNPDF3.1; the PDFs are as in Fig. 10
Fig. 13
Fig. 13
Comparison between NNPDF3.1, CT14 and MMHT2014 relative PDF uncertainties at Q=100; the PDFs are as in Fig. 12
Fig. 14
Fig. 14
Same as Fig. 12 but now comparing to the ABMP16 NNLO nf=5 sets both with their default αs(mZ)=0.1147, and αs(mZ)=0.118
Fig. 15
Fig. 15
Comparison of NNPDF3.1 NNLO PDFs to a variant in which charm is generated entirely perturbatively (and everything else is unchanged)
Fig. 16
Fig. 16
Comparison of the fractional one-sigma PDF uncertainties in NNPDF3.1 NNLO with the corresponding version where charm is generated perturbatively (and everything else is unchanged). The PDF comparison plot was shown in Fig. 15
Fig. 17
Fig. 17
Dependence of the NNPDF3.1 NNLO PDFs on the charm mass. Results are shown both for parametrized charm (left) and perturbative charm (right), for (from top to bottom) charm, gluon, up and down PDFs
Fig. 18
Fig. 18
Distances between the LO and NLO (top) and the NLO and NNLO (bottom) NNPDF3.1 NNLO PDFs at Q=100 GeV. Note the difference in scale on the y axis between the two plots
Fig. 19
Fig. 19
Comparison between some of the LO, NLO and NNPDF3.1 NNLO PDFs: gluon and up (top), antidown and total strangeness (bottom). All results are shown at Q=100 GeV, normalized to the NNLO central value
Fig. 20
Fig. 20
Comparison between the NLO PDF uncertainties and the shift between the NLO and NNLO PDFs. All results are shown as ratios to the NLO PDFs, for Q=100 GeV. The shift is symmetrized. We show results for the singlet, gluon (top); up and antidown (bottom) PDFs
Fig. 21
Fig. 21
Dependence of NNPDF3.1 NLO (top) and NNLO (bottom) PDFs on the value of αs. The gluon (left) and up quark (right) are shown at Q=100 GeV, normalized to the central value
Fig. 22
Fig. 22
Same as Fig. 9, but now comparing the NNPDF3.1 NNLO global PDFs to PDFs determined using exactly the same methodology but with the NNPDF3.0 dataset
Fig. 23
Fig. 23
Same as Fig. 10, but now also including PDFs determined using NNPDF3.1 methodology with the NNPDF3.0 dataset. From left to right and from top to bottom the gluon, up, down, antidown, total strangeness and charm are shown
Fig. 24
Fig. 24
Same as Fig. 9, but now comparing the default NNPDF3.1 to a version of it with the 8 TeV ZpT data from ATLAS and CMS not included
Fig. 25
Fig. 25
Same as Fig. 10 (top) and as Fig. 11 (bottom), but now comparing the default NNPDF3.1 to a version of it with the 8 TeV ZpT data from ATLAS and CMS not included. Results are shown for the gluon (left) and total strangeness (right)
Fig. 26
Fig. 26
Same as Fig. 9, but now comparing the default NNPDF3.1 to a version of it with the 7 TeV ZpT ATLAS data also included
Fig. 27
Fig. 27
Same as Fig. 10 but now comparing the default NNPDF3.1 to a version of it with the 7 TeV ZpT ATLAS data also included. Results are shown for the gluon (left) and down quark (right)
Fig. 28
Fig. 28
Same as Fig. 24 but now excluding all top data (total cross-sections and differential distributions). Note the different scale on the y axis in the left plot
Fig. 29
Fig. 29
Same as Fig. 25 but now excluding all top data (total cross-sections and differential distributions). Results are shown for the gluon (left) and charm (right), the PDFs above and their uncertainties below
Fig. 30
Fig. 30
Same as Fig. 24 but now excluding all jet data
Fig. 31
Fig. 31
Comparison between the default NNPDF3.1 NNLO PDFs an alternative determination in which all jet data have been removed: the gluon (left) and the percentage uncertainty on it (right) are shown
Fig. 32
Fig. 32
Same as Fig. 10 but now comparing the default NNPDF3.1 NNLO PDFs to an alternative determination in which ATLAS and CMS 7 TeV jet data have been included using exact NNLO theory. The gluon (left) and down (right) PDFs are shown
Fig. 33
Fig. 33
Comparison between CMS (left) and ATLAS (right) one-jet inclusive data at 7 TeV from 2011, and best-fit results obtained using NLO theory supplemented by scale uncertainties or exact NNLO theory. The uncertainties shown on the best-fit prediction is the PDF uncertainty, while that on the data is the diagonal (outer error bar) and the scale uncertainty on the NLO prediction (inner error bar)
Fig. 34
Fig. 34
Same as Fig. 24 but now excluding all LHCb data. Note the different scale on the y axis in the left plot
Fig. 35
Fig. 35
Same as Fig. 25 but now excluding all LHCb data. Results are presented, from top to bottom, for the up, down and charm PDFs. Both PDFs (left) and uncertainties (right) are shown
Fig. 36
Fig. 36
Comparison between 8 TeV LHCb muon W+ (left) and W- (right) production data to NNLO predictions obtained using NNPDF3.1 and NNPDF3.0. The uncertainties shown are the diagonal experimental uncertainty for the data, and the PDF uncertainty for the best-fit prediction
Fig. 37
Fig. 37
Same as Fig. 24 but now excluding D0 W asymmetry data
Fig. 38
Fig. 38
Same as Fig. 25 but now excluding D0 W asymmetries. The anti-up (left) and antidown (right) PDFs are shown
Fig. 39
Fig. 39
Same as Fig. 24 but now excluding 2011 ATLAS WZ rapidity distributions
Fig. 40
Fig. 40
Same as Fig. 25 but now excluding 2011 ATLAS WZ rapidity distributions. The total strange (left) and charm (right) PDFs are shown
Fig. 41
Fig. 41
Comparison between the 2011 ATLAS 7 TeV W- (left) and Z (right) data to NNLO predictions obtained using NNPDF3.1 and NNPDF3.0; W production data are plotted versus the pseudo-rapidity of the forward lepton ηl, while Z production data are plotted vs. the dilepton rapidity yll
Fig. 42
Fig. 42
Same as Fig. 41 but now for two of the four data bins which have not been included in the NNPDF3.1 determination: high-mass Z production at central rapidity (left) and on-shell Z production at forward rapidity (right)
Fig. 43
Fig. 43
Same as Fig. 9 but now comparing the default NNPDF3.1 to a version of it with the 8 TeV CMS double-differential Drell–Yan data also included.
Fig. 44
Fig. 44
Same as Fig. 10 (top) but now comparing the default NNPDF3.1 to a version of it with the 8 TeV CMS double-differential Drell–Yan data also included. The corresponding percentage uncertainties are also shown (bottom). Results are shown for the gluon (left) and up quark (right)
Fig. 45
Fig. 45
Same as Fig. 26, but now comparing the default NNPDF3.1 to a version of it with the EMC F2c dataset also included
Fig. 46
Fig. 46
Same as Fig. 27 but now comparing the default NNPDF3.1 to a version of it with the EMC F2c dataset also included. Results are shown for the charm (top left), up (bottom left) and down (bottom right) PDFs. The relative PDF uncertainty on charm is also shown (top right)
Fig. 47
Fig. 47
Same as Fig. 24 but now excluding all LHC data
Fig. 48
Fig. 48
Same as Fig. 25 but now excluding all LHC data. Results are shown for the up (top left), down (top right), charm (bottom left) and gluon (bottom right) PDFs
Fig. 49
Fig. 49
Same as Fig. 24 but now excluding all data with heavy nuclear targets, but keeping deuterium data (top) or excluding all data with any nuclear target and only keeping proton data (bottom)
Fig. 50
Fig. 50
Same as Fig. 25 but now excluding all data with heavy nuclear targets, but keeping deuterium data, or excluding all data with any nuclear target and only keeping proton data. Results are shown for the gluon (top left), up (top right), down (bottom left) and antidown (bottom right)
Fig. 51
Fig. 51
Comparison of the relative PDF uncertainties at Q=100 between the NNPDF3.1 and the no heavy nuclei, proton-only and collider-only PDF determinations. The uncertainties shown are all normalized to the NNPDF3.1 central value
Fig. 52
Fig. 52
Same as Fig. 24 but now comparing the default NNPDF3.1 to a version in which all deuterium data have been corrected using the nuclear corrections from Ref. [7]
Fig. 53
Fig. 53
Same as Fig. 25 but now comparing the default NNPDF3.1 to a version in which all deuterium data have been corrected using the nuclear corrections from Ref. [7]. Results are shown for the up (left = and down (right) PDFs. The uncertainties are also shown (bottom row)
Fig. 54
Fig. 54
Same as Fig. 24 but now only keeping collider data
Fig. 55
Fig. 55
Same as Fig. 25 but now only keeping collider data. Results are shown for the gluon (top left), up (top right), down (bottom left) and antidown (bottom right)
Fig. 56
Fig. 56
Comparison of relative uncertainties on NNPDF3.0 (left) and NNPDF3.1 (right) NNLO PDFs, normalized to the NNPDF3.1 NNLO central value. The two light-quark valence PDFs and the gluon are shown (top) along with all individual sea PDFs (center) and the singlet, valence and isospin triplet combinations (bottom)
Fig. 57
Fig. 57
Graphical representation of the results of Table 11
Fig. 58
Fig. 58
The strangeness ratio Rs(x,Q) Eq. (5.1) as a function of x for two values of Q, Q=1.38 GeV (left) and Q=mZ (right). Results are shown comparing NNPDF3.1 to NNPDF3.1 and the collider-only NNPDF3.1 (top), and to CT14 and MMHT (bottom)
Fig. 59
Fig. 59
Graphical representation of the results for C(Q2) from Table 13 and Q=mc GeV (left) and Q=mZ (right). Model estimates from Ref. [136] are also shown
Fig. 60
Fig. 60
The charm momentum fraction of Table 13 plotted as a function of scale Q
Fig. 61
Fig. 61
Comparison of the charm PDF at the scale and for the PDF sets of Table 13. Both the PDF (top) and the relative uncertainty (bottom) are shown
Fig. 62
Fig. 62
The charm PDF in the nf=4 scheme at small x (left) and large x (right plot) for different values of Q, in the NNPDF3.1 NNLO PDF set (top) and when assuming that charm is perturbatively generated (bottom)
Fig. 63
Fig. 63
Comparison of parton luminosities with the NNPDF3.0 and NNPDF3.1 NNLO PDF sets for the LHC 13 TeV. From left to right and from top to bottom quark–antiquark, quark–quark, gluon–gluon and quark–gluon PDF luminosities are shown. Results are shown normalized to the central value of NNPDF3.1
Fig. 64
Fig. 64
The relative uncertainty on the luminosities of Fig. 63, plotted as a function of the invariant mass MX and the rapidity y of the final state; the left plots show results for NNPDF3.0 and the right plots for NNPDF3.1 (upper four rows). The bottom row shows results for the up–antidown luminosity
Fig. 65
Fig. 65
Same as Fig. 63, now comparing NNPDF3.1 NNLO to CT14 and MMHT14
Fig. 66
Fig. 66
Same as Fig. 65, now comparing to ABMP16 PDFs, both with their default αs(mZ)=0.1149 and with the common value αs(mZ)=0.118
Fig. 67
Fig. 67
Same as Fig. 63, now comparing NNPDF3.1 to its modified version with perturbative charm
Fig. 68
Fig. 68
Comparison of the ATLAS measurements of the W+/W- ratio (left) and the W / Z ratio (right) at s=13 TeV with theoretical predictions computed with different NNLO PDF sets. Predictions are shown with (heavy) and without (light) NLO EW corrections computed with FEWZ and HORACE, as described in the text
Fig. 69
Fig. 69
Same as Fig. 68, now for the absolute W+, W- and Z cross-sections. All predictions are normalized to the experimental central value
Fig. 70
Fig. 70
PDF dependence of the Higgs production cross-sections at the LHC 13 TeV for gluon fusion, tt¯ associated production, and VH associated production. All results are shown as ratios to the central NNPDF3.1 result. Only PDF uncertainties are shown
Fig. 71
Fig. 71
Same as Fig. 70 for single Higgs production in vector boson fusion (left) and double Higgs production in gluon fusion (right)
Fig. 72
Fig. 72
Comparison between the PDFs from the input set of Nrep=1000 replicas of NNPDF3.1 NNLO, the reduced Monte Carlo CMC-PDFs with Nrep=100 replicas, and the MC2H hessian PDFs with Neig=100 symmetric eigenvalues
Fig. 73
Fig. 73
Comparison of estimators of the probability distributions computed using the NNPDF3.1 NNLO input Nrep=1000 replica set, and compressed sets of N~rep replicas, plotted as a function of N~rep. The error function (ERF) corresponding to central values, standard deviations, kurtosis, skewness, correlations and Kolmogorov distance are shown
Fig. 74
Fig. 74
Relative difference in the DIS structure functions computed with FKgenerator and APFEL, using NNPDF3.0 as input PDF set, for the CHORUS charged-current neutrino–nucleus reduced cross-sections, the NMC proton reduced cross-sections and neutral- and charged-current cross-sections from the H1 experiments from the HERA-II dataset. Datasets are as in Table 1 of Ref. [5]. For each dataset, we compare the theoretical calculations at LO and in the FONLL-A, B and C [100] heavy-quark mass schemes
Fig. 75
Fig. 75
Same as Fig. 74 for fixed-target Drell–Yan cross-sections: results are shown at LO, NLO and NNLO for the E605 pA and E866 pp cross-section datasets, as given in Table 2 of Ref. [5]

References

    1. Forte S. Parton distributions at the dawn of the LHC. Acta Phys. Polon. B. 2010;41:2859.
    1. Forte S, Watt G. Progress in the determination of the partonic structure of the proton. Annu. Rev. Nucl. Part. Sci. 2013;63:291. doi: 10.1146/annurev-nucl-102212-170607. - DOI
    1. Ball RD. Global Parton distributions for the LHC Run II. Nuovo Cim. 2016;38(4):127.
    1. Rojo J, et al. The PDF4LHC report on PDFs and LHC data: results from Run I and preparation for Run II. J. Phys. G. 2015;42:103103. doi: 10.1088/0954-3899/42/10/103103. - DOI
    1. NNPDF Collaboration, R. D. Ball et al., Parton distributions for the LHC Run II. JHEP 04, 040 (2015). arXiv:1410.8849

LinkOut - more resources