

Differential Expression Profiles and Functional Prediction of tRNA-Derived Small RNAs in Rats After Traumatic Spinal Cord Injury
- PMID: 31998075
- PMCID: PMC6968126
- DOI: 10.3389/fnmol.2019.00326
Differential Expression Profiles and Functional Prediction of tRNA-Derived Small RNAs in Rats After Traumatic Spinal Cord Injury
Abstract
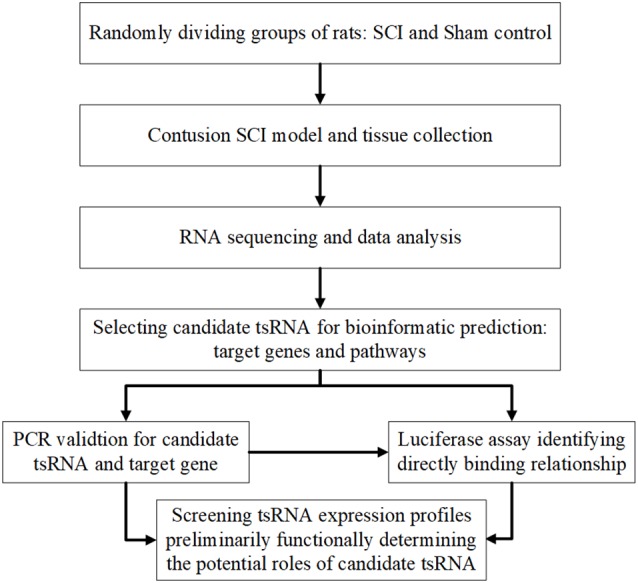
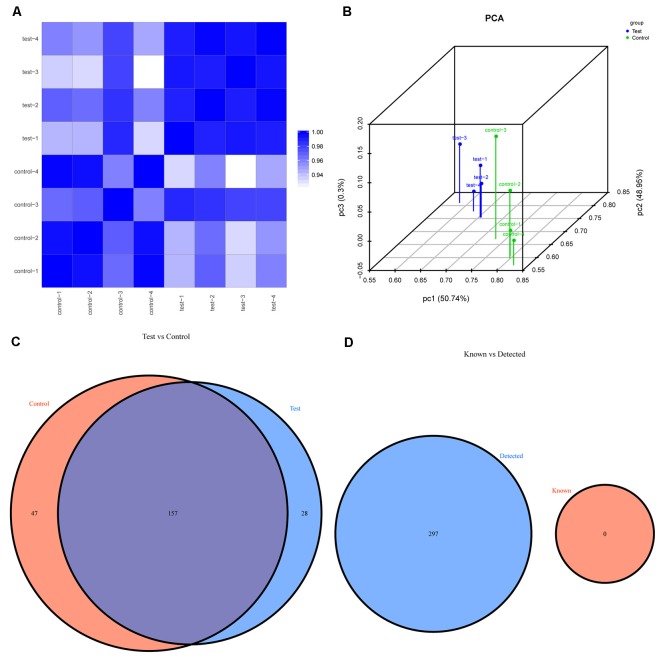
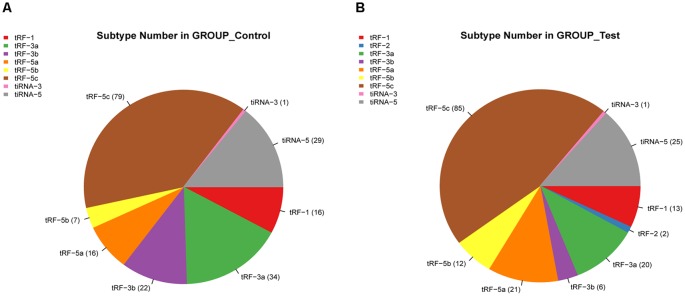
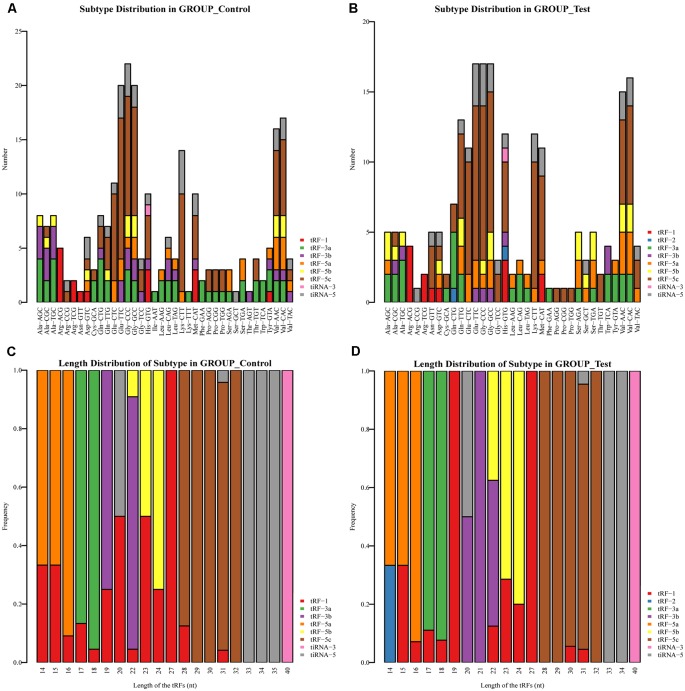
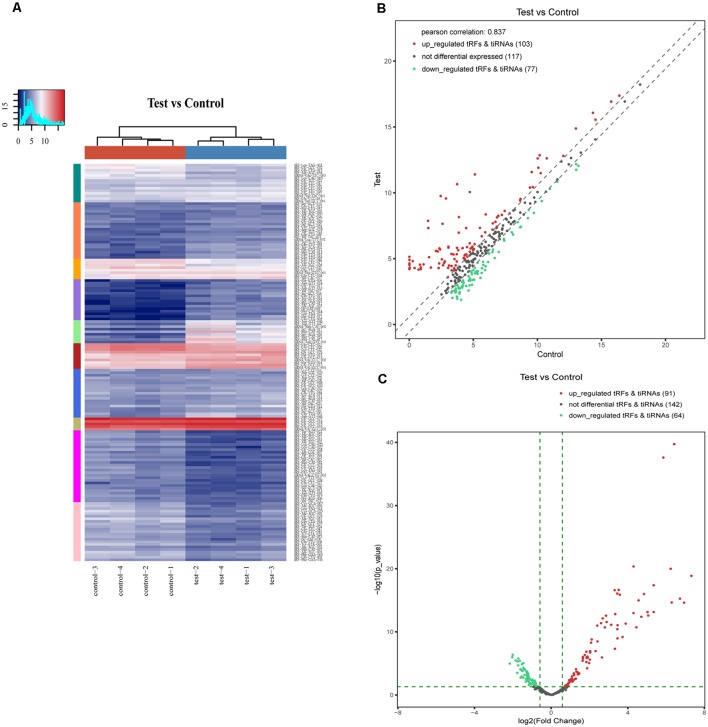
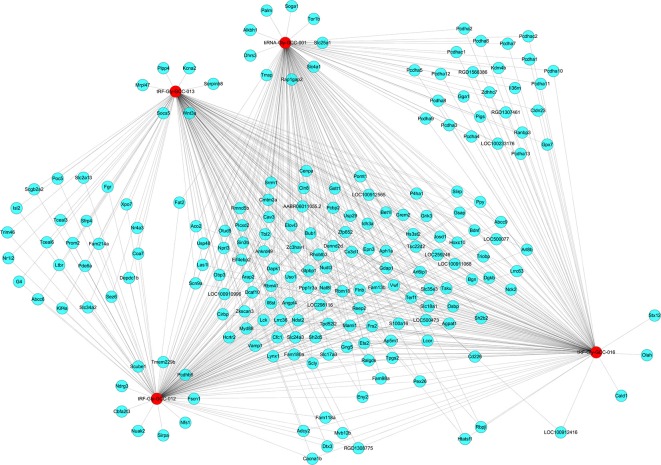
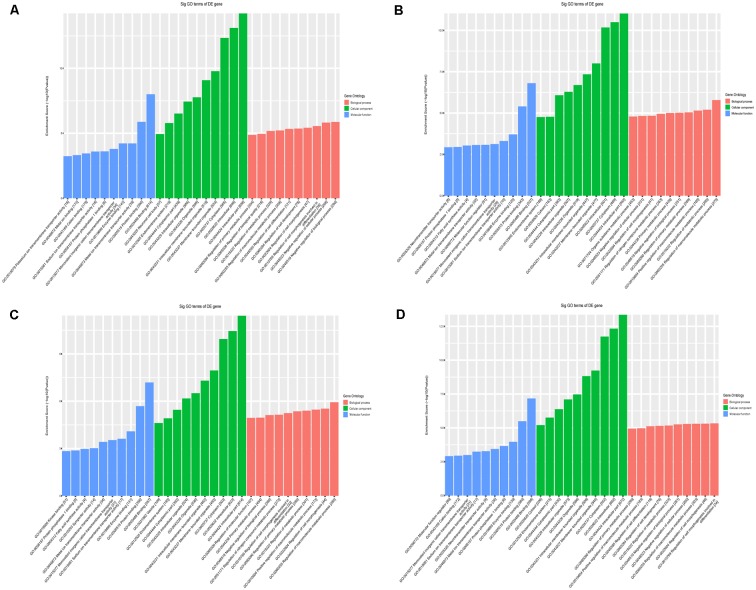
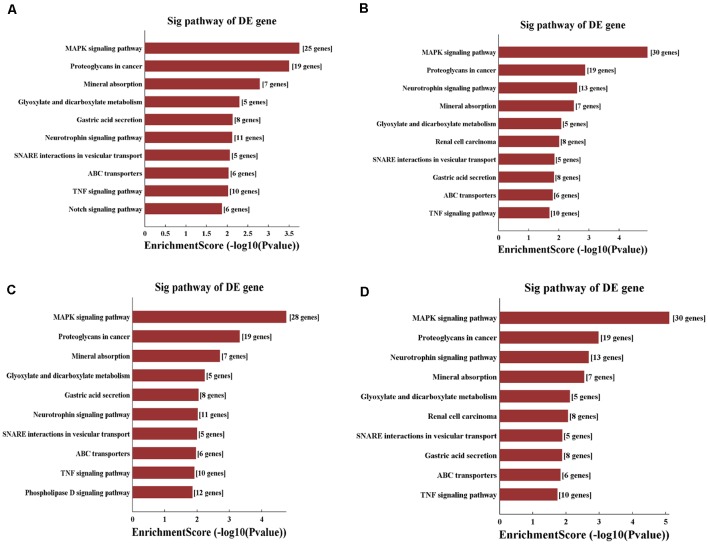
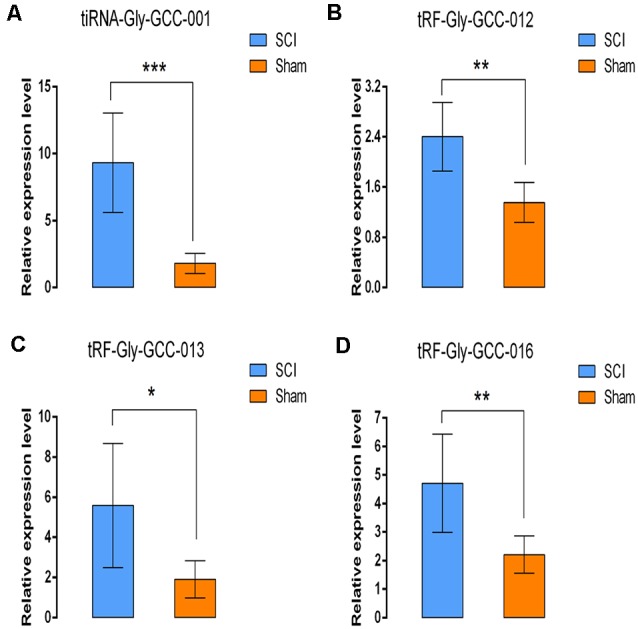
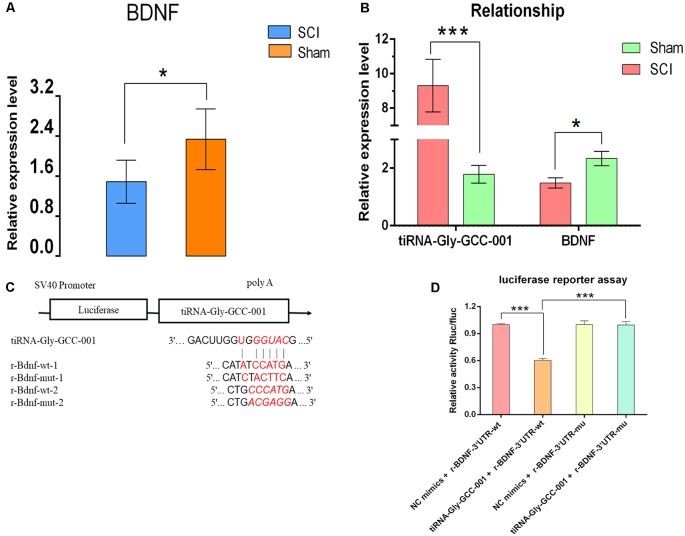
Spinal cord injury (SCI) is mostly caused by trauma. As the primary mechanical injury is unavoidable, a focus on the underlying molecular mechanisms of the SCI-induced secondary injury is necessary to develop promising treatments for patients with SCI. Transfer RNA-derived small RNA (tsRNA) is a novel class of short, non-coding RNA, possessing potential regulatory functions in various diseases. However, the functional roles of tsRNAs in traumatic SCI have not been determined yet. We used a combination of sequencing, quantitative reverse transcription-polymerase chain reaction (qRT-PCR), bioinformatics, and luciferase reporter assay to screen the expression profiles and identify the functional roles of tsRNAs after SCI. As a result, 297 differentially expressed tsRNAs were identified in rats' spinal cord 1 day after contusion. Of those, 155 tsRNAs were significantly differentially expressed: 91 were significantly up-regulated, whereas 64 were significantly down-regulated after SCI (fold change > 1.5; P < 0.05). Bioinformatics analyses revealed candidate tsRNAs (tiRNA-Gly-GCC-001, tRF-Gly-GCC-012, tRF-Gly-GCC-013, and tRF-Gly-GCC-016) that might play regulatory roles through the mitogen-activated protein kinase (MAPK) and neurotrophin signaling pathways by targeting brain-derived neurotrophic factor (BDNF). We validated the candidate tsRNAs and found opposite trends in the expression levels of the tsRNAs and BDNF after SCI. Finally, tiRNA-Gly-GCC-001 was identified to target BDNF using the luciferase reporter assay. In summary, we found an altered tsRNA expression pattern and predicted tiRNA-Gly-GCC-001 might be involved in the MAPK and neurotrophin pathways by targeting the BDNF, thus regulating the post-SCI pathophysiologic processes. This study provides novel insights for future investigations to explore the mechanisms and therapeutic targets for SCI.
Keywords: BDNF; bioinformatics; sequencing; spinal cord injury; tRNA-derived small RNA.
Copyright © 2020 Qin, Feng, Zhang, Zhang, Liu, Yang, Du, Sun, Yang, Gao and Li.
Figures
Similar articles
-
Transfer RNA-derived small RNAs (tsRNAs) sequencing revealed a differential expression landscape of tsRNAs between glioblastoma and low-grade glioma.Gene. 2023 Mar 1;855:147114. doi: 10.1016/j.gene.2022.147114. Epub 2022 Dec 13. Gene. 2023. PMID: 36526122
-
Unveiling the role of tRNA-derived small RNAs in MAPK signaling pathway: implications for cancer and beyond.Front Genet. 2024 Mar 26;15:1346852. doi: 10.3389/fgene.2024.1346852. eCollection 2024. Front Genet. 2024. PMID: 38596214 Free PMC article. Review.
-
tiRNA-Gly-GCC-001 in major depressive disorder: Promising diagnostic and therapeutic biomarker.Br J Pharmacol. 2024 Jul;181(13):1952-1972. doi: 10.1111/bph.16319. Epub 2024 Mar 4. Br J Pharmacol. 2024. PMID: 38439581
-
Differential Expression Profiles and Bioinformatics Analysis of tRNA-Derived Small RNAs in Muscle-Invasive Bladder Cancer in a Chinese Population.Genes (Basel). 2022 Mar 28;13(4):601. doi: 10.3390/genes13040601. Genes (Basel). 2022. PMID: 35456407 Free PMC article.
-
Transfer RNAs-derived small RNAs and their application potential in multiple diseases.Front Cell Dev Biol. 2022 Aug 22;10:954431. doi: 10.3389/fcell.2022.954431. eCollection 2022. Front Cell Dev Biol. 2022. PMID: 36072340 Free PMC article. Review.
Cited by
-
Novel insights into the roles of tRNA-derived small RNAs.RNA Biol. 2021 Dec;18(12):2157-2167. doi: 10.1080/15476286.2021.1922009. Epub 2021 May 17. RNA Biol. 2021. PMID: 33998370 Free PMC article. Review.
-
Action mechanisms and research methods of tRNA-derived small RNAs.Signal Transduct Target Ther. 2020 Jun 30;5(1):109. doi: 10.1038/s41392-020-00217-4. Signal Transduct Target Ther. 2020. PMID: 32606362 Free PMC article. Review.
-
Differential Expression Profiles and Function Prediction of Transfer RNA-Derived Fragments in High-Grade Serous Ovarian Cancer.Biomed Res Int. 2021 Mar 30;2021:5594081. doi: 10.1155/2021/5594081. eCollection 2021. Biomed Res Int. 2021. PMID: 33860037 Free PMC article.
-
Expression profiles and functional analysis of tRNA-derived small RNAs in epicardial adipose tissue of patients with heart failure.Ann Med. 2023;55(2):2267981. doi: 10.1080/07853890.2023.2267981. Epub 2023 Oct 15. Ann Med. 2023. PMID: 37839439 Free PMC article.
-
Differential expression profiling of tRNA-Derived small RNAs and their potential roles in methamphetamine self-administered rats.Front Genet. 2023 Feb 2;14:1088498. doi: 10.3389/fgene.2023.1088498. eCollection 2023. Front Genet. 2023. PMID: 36845381 Free PMC article.
References
-
- Arcaroli J. J., Quackenbush K. S., Powell R. W., Pitts T. M., Spreafico A., Varella-Garcia M., et al. . (2012). Common PIK3CA mutants and a novel 3′ UTR mutation are associated with increased sensitivity to saracatinib. Clin. Cancer Res. 18, 2704–2714. 10.1158/1078-0432.ccr-11-3167 - DOI - PMC - PubMed
LinkOut - more resources
Full Text Sources
Molecular Biology Databases
Research Materials