. 2020 Jan 9:13:562.
doi: 10.3389/fncel.2019.00562. eCollection 2019.

Muscarinic Modulation of Morphologically Identified Glycinergic Neurons in the Mouse PreBötzinger Complex

Affiliations

Muscarinic Modulation of Morphologically Identified Glycinergic Neurons in the Mouse PreBötzinger Complex

Fang Zheng et al. Front Cell Neurosci. .

Abstract

The cholinergic system plays an essential role in central respiratory control, but the underlying mechanisms remain elusive. We used whole-cell recordings in brainstem slices from juvenile mice expressing enhanced green fluorescent protein (EGFP) under the control of the glycine transporter type 2 (GlyT2) promoter, to examine muscarinic modulation of morphologically identified glycinergic neurons in the preBötzinger complex (preBötC), an area critical for central inspiratory rhythm generation. Biocytin-filled reconstruction of glycinergic neurons revealed that the majority of them had few primary dendrites and had axons arborized within their own dendritic field. Few glycinergic neurons had axon collaterals extended towards the premotor/motor areas or ran towards the contralateral preBötC, and had more primary dendrites and more compact dendritic trees. Spontaneously active glycinergic neurons fired regular spikes, or less frequently in a "burst-like" pattern at physiological potassium concentration. Muscarine suppressed firing in the majority of regular spiking neurons via M2 receptor activation while enhancing the remaining neurons through M1 receptors. Interestingly, rhythmic bursting was augmented by muscarine in a small group of glycinergic neurons. In contrast to its heterogeneous modulation of glycinergic neuronal excitability, muscarine generally depressed inhibitory and excitatory synaptic inputs onto both glycinergic and non-glycinergic preBötC neurons, with a stronger effect on inhibitory input. Notably, presynaptic muscarinic attenuation of excitatory synaptic input was dependent on M1 receptors in glycinergic neurons and on M2 receptors in non-glycinergic neurons. Additional field potential recordings of excitatory synaptic potentials in the M2 receptor knockout mice indicate that glycinergic and non-glycinergic neurons contribute equally to the general suppression by muscarine of excitatory activity in preBötC circuits. In conclusion, our data show that preBötC glycinergic neurons are morphologically heterogeneous, and differ in the properties of synaptic transmission and muscarinic modulation in comparison to non-glycinergic neurons. The dominant and cell-type-specific muscarinic inhibition of synaptic neurotransmission and spiking may contribute to central respiratory disturbances in high cholinergic states.

Keywords: glycine; inhibitory neurotransmission; morphometric analysis; muscarinic acetylcholine receptors; preBötzinger complex.


Figures

Figure 1
Figure 1
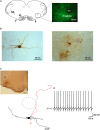
Glycine transporter type 2 (GlyT2) enhanced green fluorescent protein (EGFP)-positive neurons in the preBötzinger complex (preBötC). Panel (A) is a schematic drawing of a brainstem slice showing the location of the preBötC. Nucleus ambiguus (NA), inferior olive (IO) and the rootlets of n. XII (arrows) are used as landmarks. The fluorescent micrograph (60 μm thick) on the right shows the distribution of EGFP-positive neurons and the location of the preBötC ventral to NA, which itself is free from EGFP label. (B) Two examples of light micrographs of biocytin-labeled neurons (60 μm thick sections). Panel (C) shows a reconstructed drawing of a biocytin-filled neuron, which is a projection of five consecutive sections (60 μm), re-cut from the slice (350 μm) after electrophysiological recording. The upper-left micrograph illustrates the location of the neuron. The approximate location of NA is indicated by the dashed circle. (D) This membrane voltage trace shows the spontaneous discharge pattern of the neuron depicted in (C), recorded in whole-cell current-clamp in physiological external potassium and with GABAergic synaptic inhibition blocked.
Figure 2
Figure 2
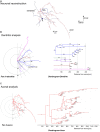
Quantitative analysis of a biocytin-labeled glycinergic preBötC neuron. Panel (A) shows an example of a glycinergic preBötC neuron, reconstructed with the help of Neurolucida software, showing the soma (arrow), dendrites (blue) and axons (red). Panels (B,C) are schematic projections of the dendrites (fan in dendrite) and axons (fan in axon) of the neuron illustrated in (A). Note that all dendrites (B) and axon collaterals (C) on the left diagrams are rotated over to one side and projected on the half-plane. The distances to the soma for each dendrite (B) and axonal collateral (C) were quantified and plotted as dendrograms for the dendrite and axon on the right.
Figure 3
Figure 3
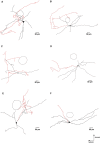
Glycinergic neurons with axons that remained close to the preBötC. Panels (A–F) are examples of camera lucida drawings of biocytin-labeled glycinergic neurons in the preBötC. These neurons had axons and axon collaterals that remained mostly within 500 μm from the soma. The circle indicates the location of NA as an orientation reference. The axons are depicted in red.
Figure 4
Figure 4
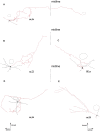
PreBötC glycinergic neurons with long axonal projections. Panels (A–E) illustrate biocytin-filled putative glycinergic neurons with axons that project more than 500 μm away from the soma. The dashed lines indicate the midline of the slice. Neurons in (A,B,D) were located on the left side, while neurons in (C,D) were from the right side of the slice. The reconstructed axons are depicted in red. The circle indicates the location of NA as an orientation reference. Note that the neuron in (A) projects to the contralateral preBötC. The other four neurons project in the direction of the hypoglossal nucleus (n. XII).
Figure 5
Figure 5
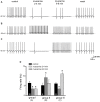
Effects of muscarine on regular spiking glycinergic neurons in the preBötC. Current-clamp recordings of spontaneously active neurons were made in the presence of picrotoxin (100 μM). Original traces in (A–C) illustrate examples of the three different response patterns of preBötC glycinergic neurons to muscarine application (10 μM). Scale bar in (C) also applies for traces in (A,B). Histograms in (D) summarize the early (2–4 min) and late (6–8 min) effects of muscarine on firing rate. Groups are based on the responses shown in (A–C) and are further described in the “Results” section. The numbers inside the columns indicate the number of neurons of the respective groups. *p < 0.05, compared to respective control.
Figure 6
Figure 6
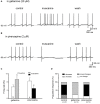
Pharmacological profiles of muscarinic effects on preBötC glycinergic neurons. Panels (A,B) are illustrations of the effects of muscarine (10 μM for 6–8 min) in the presence of the M2R antagonist gallamine (20 μM) and of the M1R antagonist pirenzepine (2 μM), respectively. Muscarine effects on firing were partially reversible (wash). The histogram in (C) summarizes responses to muscarine in control and in the presence of muscarinic receptor blockers. The histogram in (D) summarizes responses to muscarine. Mixed response patterns to muscarine were observed in the control group (with muscarine alone), with most neurons (28 out of 47 neurons or 60%) showing a reduction in firing rate. The majority of responses were shifted to an increase in firing rate in the presence of gallamine (10 out 13, or 77%) or a decrease in the presence of pirenzepine (9 out 13, or 70%). *p < 0.05, compared to respective control.
Figure 7
Figure 7
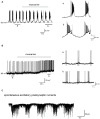
Effect of muscarine on the “burst-like” firing glycinergic neurons in the preBötC. Traces in (A) show the effects of muscarine (10 μM) recorded in a “burst-like” glycinergic neuron. This cell discharged in a rhythmic “burst-like” pattern consisting of alternating bursts of action potentials (APs) interspersed with strong membrane hyperpolarization and cessation of firing. Two “bursts” of rhythmic discharges before and during muscarine (indicated by black bars underneath the trace) are enlarged for closer inspection on the right. Note that muscarine had such a strong excitatory effect on this neuron that it induced a depolarization block during the burst (arrowheads). Traces in (B) are from a different rhythmically firing “burst-like” neuron, whose morphology is shown in Figure 1B (right). This neuron fired brief, rhythmic “bursts” of 3–5 APs under control conditions as illustrated on a larger time scale on the right. Note the lack of a large depolarizing envelope as in panel (A). Muscarine application depolarized this neuron and increased the burst frequency and number of spikes per burst. Trace in (C) is from an EGFP-positive glycinergic neuron recorded in voltage-clamp mode at −70 mV. Note the rhythmic bursts of spontaneous excitatory postsynaptic currents (EPSCs), which were recorded in the presence of picrotoxin (100 μM) and strychnine (10 μM) to block fast GABA- and glycinergic inputs, respectively.
Figure 8
Figure 8
Muscarine reduces inhibitory postsynaptic currents (IPSCs) in preBötC neurons. Voltage-clamp recordings of evoked IPSCs were made in the presence of kynurenic acid (2 mM). Cells were held at −70 mV and IPSCs are shown as downward deflections due to the high chloride-containing internal solution. Traces in (A,B) are example traces from an EGFP-positive (“glycinergic”) and an EGFP-negative (“non-glycinergic”) neuron in the preBötC, respectively. Pairs of IPSCs were evoked by delivering two identical, electrical stimuli at half-maximal amplitude to the slice, 200 ms apart, using a nearby placed stimulating electrode. Note the decrease in peak IPSC amplitude in response to the 2nd stimulus compared to the 1st in control perfusate. Traces recorded before and after bath application of muscarine (10 μM) are superimposed. The paired-pulse ratio (PPR) was determined by dividing the peak amplitude of 2nd IPSC by the peak amplitude of the 1st IPSC. A PPR < 1 indicates paired-pulse depression (PPD), while a PPR > 1 signifies paired-pulse facilitation (PPF). The muscarine-induced inhibition of 1st IPSC and the accompanying change in PPR were quantified, and group means values and SEM measured for these parameters in glycinergic and non-glycinergic neurons are shown in the histograms in (C,D), respectively (*p < 0.05).
Figure 9
Figure 9
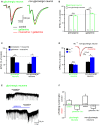
Muscarine suppresses EPSCs in preBötC neurons. Representative voltage-clamp recordings of pairs of evoked EPSCs (stimulus interval was 50 ms) made in the presence of picrotoxin (100 μM) and strychnine (10 μM) in the bath. (A,B) Superimposed traces recorded before and during bath application of muscarine (10 μM) in two types of preBötC neurons. Note that in control perfusate, the glycinergic neuron showed PPD while the non-glycinergic neuron showed PPF. Muscarine reduced the amplitude of the 1st EPSC in both groups of neurons as summarized in the histograms shown in (C). The graph in (D) summarizes muscarinic effects on PPR of EPSC in the two groups of neurons. This figure shows that muscarine turned the prevailing PPD (PPR < 1) in glycinergic neurons into PPF (PPR > 1; *p < 0.05).
Figure 10
Figure 10
Muscarine exerts a receptor subtype-specific control over excitatory synaptic input onto preBötC neurons. (A) Superimposed traces show the effects of the M2R blocker gallamine (20 μM) on evoked EPSCs in representative traces from both groups of neurons. Gallamine increased EPSC amplitude and blocked the effect of muscarine (10 μM) in the non-glycinergic neuron (right), but not in the glycinergic neuron (left). (B) Histogram summarizes the relative changes in EPSC amplitudes compared to control (amplitude of control EPSC was set to 100%) in response to the application of the M1R antagonist pirenzepine (1 μM) or the M2R antagonist gallamine. Note that an endogenous M2R-mediated tonic inhibition was only observed for EPSCs recorded in non-glycinergic neurons. (C,D) Histograms summarize the receptor subtype selectivity of muscarinic modulation of EPSCs in preBötC neurons. Muscarine was applied in the presence of muscarinic acetylcholine receptor (mAChR) antagonists (C) or to slices from M2 knockout mice (M2−/−) and their wild-type littermates (M2+/+; D). EPSC amplitude before muscarine application served as control and was set to 100%. Superimposed traces (inset in D) from an M2−/− slice shows that muscarinic inhibition of EPSC amplitude in non-glycinergic neurons is M2R-mediated. (E) Muscarinic effects on holding current in glycinergic neurons voltage-clamped at −70 mV. The application of muscarine produced an outward current (upper trace). In the presence of gallamine, we observed an inward current response to muscarine (lower trace). The downward events along the traces are the simultaneously recorded evoked/spontaneous EPSCs. The histogram in (F) summarizes shifts in holding current for glycinergic and non-glycinergic neurons under control conditions and with M2Rs pharmacologically blocked (gallamine) or genetically disrupted (M2−/−). The numbers in columns indicate sample number in each group (*p < 0.05, n.s. not significant).
Figure 11
Figure 11
Muscarine reduces field excitatory postsynaptic potentials (fEPSPs) in the preBötC. (A) Electrical stimulation (100 μs, 100 μA; indicated by arrow) of the adjacent reticular formation evoked fEPSPs in the preBötC, consisting of an early axonal component (fiber volley, FV) and a late synaptic component (fEPSP). All recordings were performed in the presence of picrotoxin and strychnine to block fast inhibitory synaptic inputs. The late component was sensitive to AMPA receptor blockade by CNQX (20 μM) as indicated by comparing the two superimposed traces. (B) Muscarine (10 μM) produced a reversible attenuation of the fEPSP (traces in control, muscarine and during wash superimposed). In the same recording session, we repeated muscarine application in the presence of atropine (1 μM) and under these conditions muscarine failed to affect fEPSP amplitude (C). (D) Superimposed traces recorded from the preBötC of an M2−/− mouse illustrate attenuation of muscarine fEPSPs suppression. Arrows in (A–D) indicate truncated stimulating artifacts. Each trace is an average of 6–10 consecutive recordings. (E) Histogram summarizes muscarine-induced changes in peak fEPSP amplitude, expressed as a percentage of control values. The partial involvement of M2R is indicated by the reduced muscarinic effect in M2−/− mice which were intermediate between atropine (no effect) and control. Numbers in columns represent sample number in each group (*p < 0.05).
Figure 12
Figure 12
Graphic summary of muscarinic effects on preBötC glycinergic neurons. For explanation see text. Abbreviations: AP, action potential; EPSC, excitatory postsynaptic current; IPSC, inhibitory postsynaptic current; M1R or M2R, muscarinic acetylcholine receptor type 1 or 2; PPR, paired-pulse ratio.

Similar articles

Cited by

References

    1. Abdala A. P., Paton J. F., Smith J. C. (2015). Defining inhibitory neurone function in respiratory circuits: opportunities with optogenetics? J. Physiol. 593, 3033–3046. 10.1113/jphysiol.2014.280610 - DOI - PMC - PubMed
    1. Bacak B. J., Segaran J., Molkov Y. I. (2016). Modeling the effects of extracellular potassium on bursting properties in pre-Bötzinger complex neurons. J. Comput. Neurosci. 40, 231–245. 10.1007/s10827-016-0594-8 - DOI - PMC - PubMed
    1. Bellingham M. C., Berger A. J. (1996). Presynaptic depression of excitatory synaptic inputs to rat hypoglossal motoneurons by muscarinic M2 receptors. J. Neurophysiol. 76, 3758–3770. 10.1152/jn.1996.76.6.3758 - DOI - PubMed
    1. Bellingham M. C., Ireland M. F. (2002). Contribution of cholinergic systems to state-dependent modulation of respiratory control. Respir. Physiol. Neurobiol. 131, 135–144. 10.1016/s1569-9048(02)00043-5 - DOI - PubMed
    1. Büsselberg D., Bischoff A. M., Becker K., Becker C. M., Richter D. W. (2001). The respiratory rhythm in mutant oscillator mice. Neurosci. Lett. 316, 99–102. 10.1016/s0304-3940(01)02382-5 - DOI - PubMed