. 2020 Jan 10:13:458.
doi: 10.3389/fnhum.2019.00458. eCollection 2019.

The Application of EEG Mu Rhythm Measures to Neurophysiological Research in Stuttering

Affiliations

The Application of EEG Mu Rhythm Measures to Neurophysiological Research in Stuttering

David Jenson et al. Front Hum Neurosci. .

Abstract

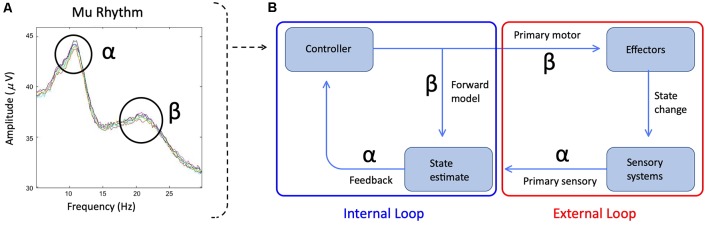
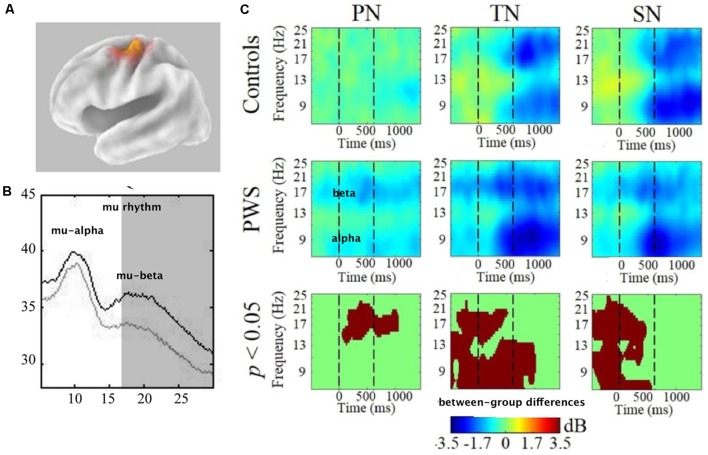
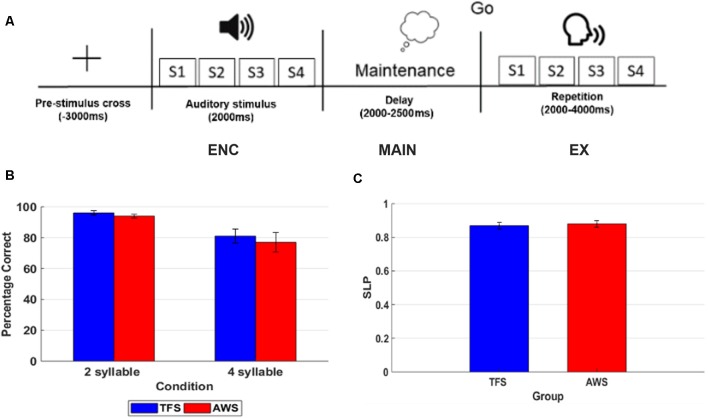
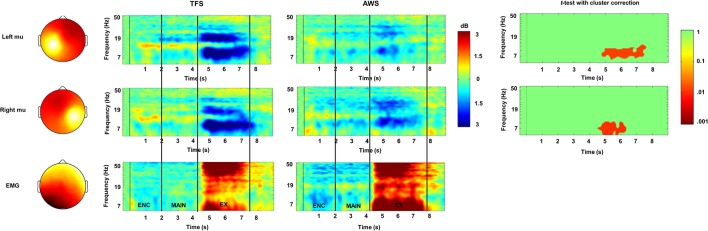
Deficits in basal ganglia-based inhibitory and timing circuits along with sensorimotor internal modeling mechanisms are thought to underlie stuttering. However, much remains to be learned regarding the precise manner how these deficits contribute to disrupting both speech and cognitive functions in those who stutter. Herein, we examine the suitability of electroencephalographic (EEG) mu rhythms for addressing these deficits. We review some previous findings of mu rhythm activity differentiating stuttering from non-stuttering individuals and present some new preliminary findings capturing stuttering-related deficits in working memory. Mu rhythms are characterized by spectral peaks in alpha (8-13 Hz) and beta (14-25 Hz) frequency bands (mu-alpha and mu-beta). They emanate from premotor/motor regions and are influenced by basal ganglia and sensorimotor function. More specifically, alpha peaks (mu-alpha) are sensitive to basal ganglia-based inhibitory signals and sensory-to-motor feedback. Beta peaks (mu-beta) are sensitive to changes in timing and capture motor-to-sensory (i.e., forward model) projections. Observing simultaneous changes in mu-alpha and mu-beta across the time-course of specific events provides a rich window for observing neurophysiological deficits associated with stuttering in both speech and cognitive tasks and can provide a better understanding of the functional relationship between these stuttering symptoms. We review how independent component analysis (ICA) can extract mu rhythms from raw EEG signals in speech production tasks, such that changes in alpha and beta power are mapped to myogenic activity from articulators. We review findings from speech production and auditory discrimination tasks demonstrating that mu-alpha and mu-beta are highly sensitive to capturing sensorimotor and basal ganglia deficits associated with stuttering with high temporal precision. Novel findings from a non-word repetition (working memory) task are also included. They show reduced mu-alpha suppression in a stuttering group compared to a typically fluent group. Finally, we review current limitations and directions for future research.

Keywords: basal ganglia; internal models; mu rhythm; sensorimotor integration; speech perception; speech production; stuttering; working memory.


Figures

Figure 1
Figure 1
(A) The spectral plot of mu rhythm with alpha and beta symbols identifying the frequency peaks. Plot derived from data presented in Jenson et al. (2014). (B) Simplified schematic of State Feedback Control with the internal sensorimotor loop outlined in blue and the external primary motor/sensory loop outlined in red. Alpha and beta symbols indicate the sensitivity of mu bands to the distinct internal and external loop processes. Within the internal loop, mu-beta captures forward models, which represent sensory predictions of the upcoming motor plan and are encoded in projections from the premotor cortex to auditory and somatosensory cortices. Following a comparison between forward model predictions and sensory targets in auditory and somatosensory cortices, any mismatch is mapped onto corrective motor commands and returned to the premotor cortex via an inverse model (encoded in mu-alpha) for ongoing motor planning. Within the external loop, mu-beta encodes the primary motor response, while mu-alpha encodes sensory feedback to the premotor cortex based on the available reafference.
Figure 2
Figure 2
Peri-labial electromyographic (EMG) channel data from all subjects in covert (SylC) and overt (SylP) syllable production following a visual inspection. The vertical dashed line in each graph represents the cue to initiate production. While peri-labial EMG activity in SylP is characterized by preparatory activity prior to the cue to speak followed by robust activity following the speech cue, minimal peri-labial activity is observed over the time course of SylC. Data has been adapted from Jenson et al. (2018).
Figure 3
Figure 3
Event-related spectral perturbation (ERSP)-decomposed left hemisphere mu and peri-labial EMG data from overt word production. The vertical dotted line represents the cue to initiate production. (A) ERSP data from fluent controls. (B) ERSP data from participants who stutter. (C) Between-group statistical comparisons with cluster corrections for multiple comparisons. Red voxels are significant at p < 0.05 (corrected). (D) Peri-labial EMG activity. The vertical magenta line illustrates the temporal concordance between the emergence of robust alpha and beta desynchronization, statistical differences, and the onset of peak EMG activity. Data has been adapted from Jenson et al. (2018).
Figure 4
Figure 4
ERSP-decomposed left hemisphere mu data from covert (SylC) and overt (SylP) syllable production. The vertical dotted line represents the cue to initiate production. (A) ERSP data from fluent controls, with the right-most column representing within-group differences. (B) ERSP data from participants who stutter, with the right-most column displaying within-group differences. (C) Between-group differences. All statistical comparisons employed cluster corrections for multiple comparisons, and red voxels represent significant differences at p < 0.05 (corrected). Data has been adapted from Jenson et al. (2018).
Figure 5
Figure 5
(A) Van Essen image average template of left mu source (localized to BA6-premotor cortex). (B) Comparison of mu spectra for one condition (TN—discriminating tones in noise) showing significant differences in mu-beta (shaded) spectral amplitudes. All conditions showed this difference bilaterally. (C) Time-frequency decompositions of mu-alpha and mu-beta relative to baseline, showing significant group differences in PN (passive noise), TN and SN (discriminating syllables in noise). For TN and SN, stimuli were presented from time = 0–600 ms. Therefore, pre-stimulus attention is measured prior to 0 ms and post-stimulus working memory is measured after 600 ms. Warmer colors (e.g., yellow) depicts event-related synchronization (ERS) and cooler colors (e.g., blue) depict event-related-desynchronization (ERD). Data has been adapted from Saltuklaroglu et al. (2017).
Figure 6
Figure 6
This figure shows an example of a timeline for one trial in the 4 syllable repetition condition with each phase of the task labeled and behavioral accuracy on the 2 and 4 syllable tasks in the typically fluent speaker (TFS) and adults who stutter (AWS) groups. (A) Timeline of one 4 syllable trial. (B) Percentage correct trials in the 2 syllable and 4 syllable condition with TFS shown in blue and the AWS group depicted in red. (C) Syllable load performance metric (SLP) in the TFS (blue) and AWS groups (red).
Figure 7
Figure 7
ERSPs in the encoding (ENC), maintenance, (MAIN) and execution (EX) phases of the 4 syllable repetition task in TFSs (rows) and in AWS (columns). Mu rhythm scalp-topographies and a cluster associated with peri-labial EMG during execution are shown to the left with scalp-potential distributions for the component cluster with white-yellow showing greater density and red showing lower density. ERSPs are depicted in time-frequency scalograms with frequency on the y-axis and time on the x-axis. Significant group differences are shown in the third column (cluster corrected t-test) with p-values <0.05 (range 0.05–0.01) shown in red and non-significant values shown in green.

Similar articles

Cited by

References

    1. Alho J., Sato M., Sams M., Schwartz J. L., Tiitinen H., Jääskeläinen I. P. (2012). Enhanced early-latency electromagnetic activity in the left premotor cortex is associated with successful phonetic categorization. NeuroImage 60, 1937–1946. 10.1016/j.neuroimage.2012.02.011 - DOI - PubMed
    1. Alm P. A. (2004). Stuttering and the basal ganglia circuits: a critical review of possible relations. J. Commun. Disord. 37, 325–369. 10.1016/j.jcomdis.2004.03.001 - DOI - PubMed
    1. Armson J., Kalinowski J. (1994). Interpreting results of the fluent speech paradigm in stuttering research: difficulties in separating cause from effect. J. Speech Hear. Res. 37, 69–82. 10.1044/jshr.3701.69 - DOI - PubMed
    1. Arnal L. H., Giraud A. L. (2012). Cortical oscillations and sensory predictions. Trends Cogn. Sci. 16, 390–398. 10.1016/j.tics.2012.05.003 - DOI - PubMed
    1. Arnold H. S., Conture E. G., Key A. P., Walden T. (2011). Emotional reactivity, regulation and childhood stuttering: a behavioral and electrophysiological study. J. Commun. Disord. 44, 276–293. 10.1016/j.jcomdis.2010.12.003 - DOI - PMC - PubMed