. 2020 Jan 10:11:37.
doi: 10.3389/fnsyn.2019.00037. eCollection 2019.

Presynaptic Boutons That Contain Mitochondria Are More Stable

Affiliations

Presynaptic Boutons That Contain Mitochondria Are More Stable

Robert M Lees et al. Front Synaptic Neurosci. .

Abstract

The addition and removal of presynaptic terminals reconfigures neuronal circuits of the mammalian neocortex, but little is known about how this presynaptic structural plasticity is controlled. Since mitochondria can regulate presynaptic function, we investigated whether the presence of axonal mitochondria relates to the structural plasticity of presynaptic boutons in mouse neocortex. We found that the overall density of axonal mitochondria did not appear to influence the loss and gain of boutons. However, positioning of mitochondria at individual presynaptic sites did relate to increased stability of those boutons. In line with this, synaptic localization of mitochondria increased as boutons aged and showed differing patterns of localization at en passant and terminaux boutons. These results suggest that mitochondria accumulate locally at boutons over time to increase bouton stability.

Keywords: in vivo 2-photon imaging; mitochondria; neocortex; presynaptic bouton; synapse turnover; synaptic plasticity.


Figures

Figure 1
Figure 1
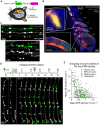
Tracking bouton plasticity and mitochondrial positioning in axons of motor cortex neurons. (A) Adeno-associated virus (AAV) expressing cytosolic EGFP and a mitochondrial targeting sequence (MTS) conjugated to TagRFP was injected into M1/M2 and a glass cranial window was implanted over S1. (B) A series of coronal brain slices showing the viral injection site across the M1/M2 border (inset, top) and the axonal projection site at S1 under the cranial window (inset, bottom). Only the ipsilateral half of the brain sections are shown. Pr = parietal cortex, D = dorsal, L = lateral, A = anterior. (C) Cropped two-photon (2P) images from in vivo imaging show axons with high EPB density (EPB-rich) or high TB density (TB-rich). (D) (top) Imaging timeline for tracking bouton structural plasticity bouton loss and gain. Viral injection and cranial window implantation were performed 24 days prior to initial 2P imaging. Arrowheads indicate imaging time-points. (bottom) Structure and mitochondrial localization in a single cropped axon over 35 days imaged using in vivo 2P microscopy. Some boutons are labeled with arrowheads to show examples of stable (yellow), lost (red) or gained (green) boutons. (E) Gaussian mixture modeling (GMM) was used to determine two potential populations (EPB-rich and TB-rich axons) that result in the observed sample distribution of axonal EPB and TB densities (mean across time). Axons that had posterior probabilities below 70% were not assigned to a group (circled; see “Materials and Methods” section). Contour lines indicate the slope of the GMM distribution.
Figure 2
Figure 2
Mitochondrial density along an axonal segment is correlated to bouton density but not bouton dynamics. (A) Mitochondrial and bouton density distributions for all axons (mean across time, n = 306 axons). (B) (left) Bouton and mitochondrial densities for each axon were strongly correlated (mean across time; R2 = Pearson’s correlation, n = 306). Red dashed line = linear regression. (right) Histogram showing the distribution of mitochondrion-to-bouton ratios for all axons (median = 0.65, approximately two mitochondria to every three boutons). (C) Example correlations between the fraction of boutons on each axon that were dynamic (lost or gained; bouton dynamic fraction) and either: (left) the number of mitochondria relative to the number of boutons (mito:bouton ratio), or (right) mitochondrial density. Results from the first weekly interval (between days 7 and 14) are shown (n = 196 axons over all weekly intervals, RS = Spearman’s rank correlation, see Supplementary Table S1).
Figure 3
Figure 3
Mitochondria are positioned more closely to en passant boutons (EPBs) than terminaux boutons (TBs). (A) The distribution of distances between each mitochondrion and its nearest bouton was plotted against the results from 1,000 rounds of randomized positioning of boutons for comparison to chance levels. Median ± range (shaded area). Kolmogorov–Smirnov (K–S) test between real data and the median of randomized positioning. As a further control, the real bouton positions were mirrored along the axon backbone to maintain the inter-bouton distances (black line) resulting in a similar distribution to the randomized positioning. (B) Same as in (A), but for boutons and their nearest mitochondrion compared to results from randomized/mirrored positioning of mitochondria. (C) Illustration of the routine for randomizing positions. The original image was manually traced and a 2D skeleton interpolated from the segmented line trace. TBs were approximately placed at the nearest point on the axon backbone (their base) for randomizing in 1D. The 2D skeleton was then straightened to 1D and either mitochondria were randomly positioned alongside real bouton positions or vice versa. (D,E) Same as in (B), but for TBs only (D; using TB base position, see G) or EPBs only (E). (F) A greater proportion of EPBs have mitochondria within a biologically relevant distance (1.5 μm, see “Materials and Methods” section) than TBs (day 0 data; Chi-squared test). When mitochondrial localization was considered from the TB base instead of the head the difference was lost (Chi-squared test). Error bars ± 95% CI. (G) Estimated location of TB bases was achieved by finding the nearest neighbor point on the axon backbone that was closest to the TB head and re-plotting the TB to that position. 2P images were cropped for easier visualization.
Figure 4
Figure 4
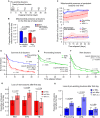
Mitochondrial presence at individual boutons is positively related to bouton age and longevity. (A) Timeline indicating the classification of pre-existing boutons (first identified on day 0) and newly-formed boutons (first identified on days 1, 2 or 3). (B) Pre-existing boutons were more likely to have mitochondria (<1.5 μm) than newly-formed boutons (Chi-squared test). Newly-formed boutons had more mitochondria present than with randomized positioning of mitochondria, as did pre-existing boutons (Chi-squared test). Error bars ± 95% CI. (C) Boutons that persisted in every time point after day 2 (after all newly-formed boutons were identified) had their mitochondrial localization tracked. Pre-existing boutons showed a significant increase in mitochondrial presence (Cochran’s Q test: χ(6)2 = 51.359, p < 0.0005). New boutons also showed an increase; however, this was not statistically significant (Cochran’s Q test: χ(5)2 = 6.81, p = 0.235). When mitochondrial positions were randomized, both new and pre-existing boutons did not show significant increases in mitochondrial localization (Cochran’s Q test: New, χ(5)2 = 3.807, p = 0.578; pre-existing, χ(6)2 = 9.787, p = 0.134). Shaded areas are ± 95% CI. (D) Survival of boutons was measured as the time until bouton loss. Pre-existing boutons were significantly more stable than new boutons (Log-rank test). The new bouton population was pooled from day 1–3 (light red lines). (E,F) Of the pre-existing population, TB and EPB survival was similar (E), however, there was a small significant decrease in survival for new EPBs compared to TBs (F; Log-rank test). (G) The proportion of new boutons with or without mitochondria that were lost after their first day. There was a significant decrease in bouton loss when mitochondria were present at new boutons (Fisher’s exact test). This relationship was due to the population of EPBs and not TBs. (H) Similarly, pre-existing EPBs with mitochondria were half as likely to be lost when compared to those without mitochondria (Fisher’s exact test). Error bars ± 95% CI.

Similar articles

Cited by

References

    1. Ash R. T., Fahey P. G., Park J., Zoghbi H. Y., Smirnakis S. M. (2018). Increased axonal bouton stability during learning in the mouse model of MECP2 duplication syndrome. eNeuro 5:ENEURO.0056-17.2018. 10.1523/eneuro.0056-17.2018 - DOI - PMC - PubMed
    1. Billups B., Forsythe I. D. (2002). Presynaptic mitochondrial calcium sequestration influences transmission at mammalian central synapses. J. Neurosci. 22, 5840–5847. - PMC - PubMed
    1. Briones T. L., Klintsova A. Y., Greenough W. T. (2004). Stability of synaptic plasticity in the adult rat visual cortex induced by complex environment exposure. Brain Res. 1018, 130–135. 10.1016/j.brainres.2004.06.001 - DOI - PubMed
    1. Chang D. T. W., Honick A. S., Reynolds I. J. (2006). Mitochondrial trafficking to synapses in cultured primary cortical neurons. J. Neurosci. 26, 7035–7045. 10.1523/jneurosci.1012-06.2006 - DOI - PMC - PubMed
    1. Courchet J., Lewis T. L., Lee S., Courchet V., Liou D.-Y., Aizawa S., et al. . (2013). Terminal axon branching is regulated by the LKB1-NUAK1 kinase pathway via presynaptic mitochondrial capture. Cell 153, 1510–1525. 10.1016/j.cell.2013.05.021 - DOI - PMC - PubMed