

Intracellular Ca2+ Concentration and Phosphatidylserine Exposure in Healthy Human Erythrocytes in Dependence on in vivo Cell Age
- PMID: 31998145
- PMCID: PMC6965055
- DOI: 10.3389/fphys.2019.01629
Intracellular Ca2+ Concentration and Phosphatidylserine Exposure in Healthy Human Erythrocytes in Dependence on in vivo Cell Age
Abstract
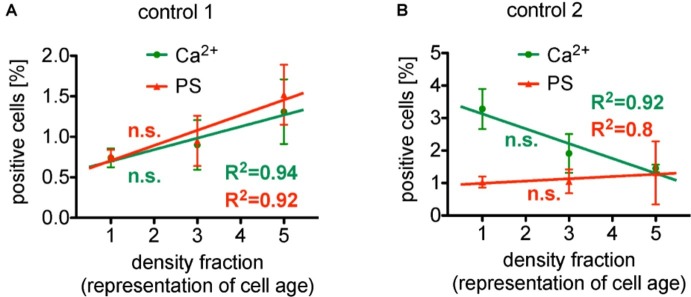
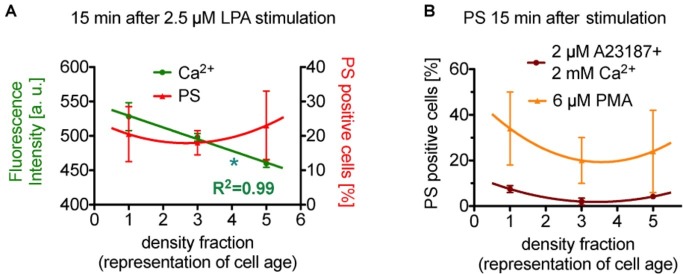
After about 120 days of circulation in the blood stream, erythrocytes are cleared by macrophages in the spleen and the liver. The "eat me" signal of this event is thought to be the translocation of phosphatidylserine from the inner to the outer membrane leaflet due to activation of the scramblase, while the flippase is inactivated. Both processes are triggered by an increased intracellular Ca2+ concentration. Although this is not the only mechanism involved in erythrocyte clearance, in this minireview, we focus on the following questions: Is the intracellular-free Ca2+ concentration and hence phosphatidylserine exposure dependent on the erythrocyte age, i.e. is the Ca2+ concentration, progressively raising during the erythrocyte aging in vivo? Can putative differences in intracellular Ca2+ and exposure of phosphatidylserine to the outer membrane leaflet be measured in age separated cell populations? Literature research revealed less than dozen of such publications with vastly contradicting results for the Ca2+ concentrations but consistency for a lack of change for the phosphatidylserine exposure. Additionally, we performed reanalysis of published data resulting in an ostensive illustration of the situation described above. Relating these results to erythrocyte physiology and biochemistry, we can conclude that the variation of the intracellular free Ca2+ concentration is limited with 10 μM as the upper level of the concentration. Furthermore, we propose the hypothesis that variations in measured Ca2+ concentrations may to a large extent depend on the experimental conditions applied but reflect a putatively changed Ca2+ susceptibility of erythrocytes in dependence of in vivo cell age.
Keywords: Ca2+ content; aging; flow cytometry; lysophosphatidic acid; phosphatidylserine exposure; red blood cells.
Copyright © 2020 Bernhardt, Nguyen, Wesseling and Kaestner.
Figures
Similar articles
-
ATP11C is a major flippase in human erythrocytes and its defect causes congenital hemolytic anemia.Haematologica. 2016 May;101(5):559-65. doi: 10.3324/haematol.2016.142273. Epub 2016 Mar 4. Haematologica. 2016. PMID: 26944472 Free PMC article.
-
Novel Insights in the Regulation of Phosphatidylserine Exposure in Human Red Blood Cells.Cell Physiol Biochem. 2016;39(5):1941-1954. doi: 10.1159/000447891. Epub 2016 Oct 24. Cell Physiol Biochem. 2016. PMID: 27771709
-
Phosphatidylserine Exposure in Human Red Blood Cells Depending on Cell Age.Cell Physiol Biochem. 2016;38(4):1376-90. doi: 10.1159/000443081. Epub 2016 Mar 24. Cell Physiol Biochem. 2016. PMID: 27007671
-
Maintenance and regulation of asymmetric phospholipid distribution in human erythrocyte membranes: implications for erythrocyte functions.Curr Opin Hematol. 2017 May;24(3):167-172. doi: 10.1097/MOH.0000000000000326. Curr Opin Hematol. 2017. PMID: 28118222 Review.
-
Erythrocyte ion channels in regulation of apoptosis.Adv Exp Med Biol. 2004;559:211-7. doi: 10.1007/0-387-23752-6_20. Adv Exp Med Biol. 2004. PMID: 18727242 Review.
Cited by
-
Apoptosis and eryptosis: similarities and differences.Apoptosis. 2024 Apr;29(3-4):482-502. doi: 10.1007/s10495-023-01915-4. Epub 2023 Nov 30. Apoptosis. 2024. PMID: 38036865 Review.
-
The Relation Between Extracellular Vesicles Released From Red Blood Cells, Their Cargo, and the Clearance by Macrophages.Front Physiol. 2022 Mar 31;13:783260. doi: 10.3389/fphys.2022.783260. eCollection 2022. Front Physiol. 2022. PMID: 35432007 Free PMC article.
-
Phosphatidylserine eversion regulated by phospholipid scramblase activated by TGF-β1/Smad signaling in the early stage of kidney stone formation.Urolithiasis. 2022 Feb;50(1):11-20. doi: 10.1007/s00240-021-01292-0. Epub 2021 Dec 3. Urolithiasis. 2022. PMID: 34860265 Free PMC article.
-
TAM-ing the CIA-Tumor-Associated Macrophages and Their Potential Role in Unintended Side Effects of Therapeutics for Cancer-Induced Anemia.Front Oncol. 2021 Mar 25;11:627223. doi: 10.3389/fonc.2021.627223. eCollection 2021. Front Oncol. 2021. PMID: 33842333 Free PMC article.
-
Pathogenesis of Anemia in Canine Babesiosis: Possible Contribution of Pro-Inflammatory Cytokines and Chemokines-A Review.Pathogens. 2023 Jan 20;12(2):166. doi: 10.3390/pathogens12020166. Pathogens. 2023. PMID: 36839438 Free PMC article. Review.
References
-
- Aiken N. R., Satterlee J. D., Galey W. R. (1992). Measurement of intracellular Ca2+ in young and old human erythrocytes using F-NMR spectroscopy. Biochim. Biophys. Acta 1136, 155–160. - PubMed
-
- Bernhardt I., Wesseling M. C., Nguyen D. B., Kaestner L. (2019). “Red blood cells actively contribute to blood coagulation and thrombus formation” in Erythrocyte. ed. Tombak A. (London: IntechOpen; ).
-
- Bitbol M., Fellmann P., Zachowski A., Devaux P. F. (1987). Ion regulation of phosphatidylserine and phosphatidylethanolamine outside-inside translocation in human erythrocytes. Biochim. Biophys. Acta 904, 268–282. - PubMed
Publication types
LinkOut - more resources
Full Text Sources
Miscellaneous