. 2020 Jan 9:10:2904.
doi: 10.3389/fmicb.2019.02904. eCollection 2019.

Fungal Traits Important for Soil Aggregation

Affiliations

Fungal Traits Important for Soil Aggregation

Anika Lehmann et al. Front Microbiol. .

Abstract

Soil structure, the complex arrangement of soil into aggregates and pore spaces, is a key feature of soils and soil biota. Among them, filamentous saprobic fungi have well-documented effects on soil aggregation. However, it is unclear what properties, or traits, determine the overall positive effect of fungi on soil aggregation. To achieve progress, it would be helpful to systematically investigate a broad suite of fungal species for their trait expression and the relation of these traits to soil aggregation. Here, we apply a trait-based approach to a set of 15 traits measured under standardized conditions on 31 fungal strains including Ascomycota, Basidiomycota, and Mucoromycota, all isolated from the same soil. We find large differences among these fungi in their ability to aggregate soil, including neutral to positive effects, and we document large differences in trait expression among strains. We identify biomass density, i.e., the density with which a mycelium grows (positive effects), leucine aminopeptidase activity (negative effects) and phylogeny as important factors explaining differences in soil aggregate formation (SAF) among fungal strains; importantly, growth rate was not among the important traits. Our results point to a typical suite of traits characterizing fungi that are good soil aggregators, and our findings illustrate the power of employing a trait-based approach to unravel biological mechanisms underpinning soil aggregation. Such an approach could now be extended also to other soil biota groups. In an applied context of restoration and agriculture, such trait information can inform management, for example to prioritize practices that favor the expression of more desirable fungal traits.

Keywords: biomass density; leucine amino peptidases; random forest; saprobic fungi; soil aggregation; traits.


Figures

FIGURE 1
FIGURE 1
Overview of fungal strains. Phylogenetic tree (maximum clade-credibility tree) of the 31 saprobic fungal strains comprising members of the phyla Ascomycota, Basidiomycota, and Mucoromycota. Following the order of the tree, images of 4 week old colonies grown on PDA are assigned to the tree. Further information about phylogeny and accession numbers of the 31 fungal strains are available in Supplementary Table S2. Strains performing best and poorest are marked; blue symbols represent good and red symbols poor aggregators.
FIGURE 2
FIGURE 2
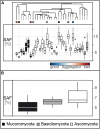
Soil aggregate formation (SAF) capability. (A) Tukey boxplots of the SAF (with n = 10 × 31 in %) capability of the 31 fungal strains. The dashed line represents the average SAF of the controls (n = 10, mean = 3.5, SD = 0.59). (B) SAF capability depicted on phylum level (pairwise comparisons: Ascomycota – Basidiomycota: p = 0.47, Ascomycota – Mucoromycota: p = 0.03, Basidiomycota – Mucoromycota: p = 0.66; n = 31).
FIGURE 3
FIGURE 3
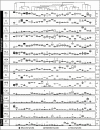
Trait distributions. Tukey boxplots of the 15 trait variables comprising morphological, chemical and biotic fungal features. Here, we present data on branching angle (BA with n = 5 in °), hyphal diameter (D with n = 5 in μm), internodal length (IL with n = 5 in μm), box counting dimension (Db with n = 8, unitless), lacunarity (L with n = 8, unitless), hyphal length in soil (HLs with n = 10 in m/g), hyphal surface area (HSA with n = 8 in μm2), biomass density (Den with n = 6 in mg × cm– 2), radial colony extension rate (Kr with n = 5 in μm × h– 1), hydrophobicity of fungal surfaces (HPB with n = 6 in% of ethanol molarity), cellobiohydrolase (Cel), laccase (Lac), leucine aminopeptidase (Leu), and acid phosphatase (Pho) activity (each with n = 5 in unit × g– 1 dry mass) and palatability (PT with n = 8 in no. of fecal pellets per collembolan individual). The boxplots represent 25th and 75th percentile, median and outlying points. Information about phylum affiliation is color-coded (black: Mucoromycota, gray: Basidiomycota, white: Ascomycota). The gray dashed line for the trait hyphal length in soil represents mean of corresponding trait controls. The trait database is available in Supplementary Table S6.
FIGURE 4
FIGURE 4
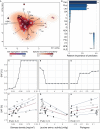
Outcomes of principal components analysis, random forest analysis and relationships between soil aggregate formation (SAF) and important trait variables. Analyses were conducted on trait mean data (n = 31). (A) Projection of the ordinated 31 fungal strains onto 15 trait variables comprising morphological, chemical and biotic characteristics into two dimensional trait space represented by principal component axis 1 and 2 (explaining 23 and 19% of variance, respectively). The trait variables are branching angle (BA), hyphal diameter (D), internodal length (IL), box counting dimension (Db), lacunarity (L), hyphal length in soil (HLs), hyphal surface area (HSA), biomass density (Den), radial colony extension rate (Kr), hydrophobicity of fungal surfaces (HPB), cellobiohydrolase (Cel), laccase (Lac), leucine aminopeptidase (Leu) and acid phosphatase (Pho) activity, and palatability (PT). Arrows indicate direction and weight of trait vectors. Red–white color gradient represents probability of species occurrence (white = low, red = high) in the trait space, with the contour lines denoting the 0.50, 0.95, and 0.99 quantiles of kernel density estimation (see “Materials and Methods” section). The dot outline represents phylum affiliation (black: Mucoromycota, gray: Basidiomycota, white: Ascomycota) while dot filling represents soil aggregate formation capability (SAF) of fungal strains (represented by a blue–red color gradient; red: low SAF, blue: high SAF). (B) Overall importance of trait variables for SAF capability with R2expl = 0.36, 0.13 and three statistically significant predictor variables. Asterisks denote significance level: ∗∗<0.001, <0.01, <0.5. Pairwise phylogenetic distance was included as PCo-axes (see “Materials and Methods” section). (C–E) Partial dependence plots for the three most important and significant trait variables identified by random forest approach. For phylogeny, we depicted PCo axis 1 on the x-axis representing the axis scores. The x-axis labels are identical with panels (F–H), respectively. (F–H) Relationships between SAF and the three most important trait variables. Corresponding regression statistics can be found in Supplementary Table S5. Phylum affiliation of fungal strains is color-coded (black: Mucoromycota, gray: Basidiomycota, white: Ascomycota). Red and blue lines represent linear and quantile regression lines, respectively. The line type depicts significance of regression lines with solid <0.05 and dashed >0.05. The trait database is available in Supplementary Table S6.
FIGURE 5
FIGURE 5
Radar plot depicting trait expressions for the four best and four poorest soil aggregate forming fungal strains.

References

    1. Aguilar-Trigueros C. A., Hempel S., Powell J. R., Anderson I. C., Antonovics J., Bergmann J., et al. (2015). Branching out: towards a trait-based understanding of fungal ecology. Fungal Biol. Rev. 29 34–41. 10.1016/j.fbr.2015.03.001 - DOI
    1. Andrade-Linares D. R., Veresoglou S. D., Rillig M. C. (2016). Temperature priming and memory in soil filamentous fungi. Fungal Ecol. 21 10–15. 10.1016/j.funeco.2016.02.002 - DOI
    1. Baldrian P., Voriskova J., Dobiasova P., Merhautova V., Lisa L., Valaskova V. (2011). Production of extracellular enzymes and degradation of biopolymers by saprotrophic microfungi from the upper layers of forest soil. Plant Soil 338 111–125. 10.1007/s11104-010-0324-3 - DOI
    1. Bardgett R. D., van der Putten W. H. (2014). Belowground biodiversity and ecosystem functioning. Nature 515 505–511. 10.1038/nature13855 - DOI - PubMed
    1. Bengtsson-Palme J., Ryberg M., Hartmann M., Branco S., Wang Z., Godhe A., et al. (2013). Improved software detection and extraction of ITS1 and ITS2 from ribosomal ITS sequences of fungi and other eukaryotes for analysis of environmental sequencing data. Methods Ecol. Evol. 4 914–919.

LinkOut - more resources