. 2020 Jan 9:10:2966.
doi: 10.3389/fmicb.2019.02966. eCollection 2019.

Potential TMA-Producing Bacteria Are Ubiquitously Found in Mammalia

Affiliations

Potential TMA-Producing Bacteria Are Ubiquitously Found in Mammalia

Silke Rath et al. Front Microbiol. .

Abstract

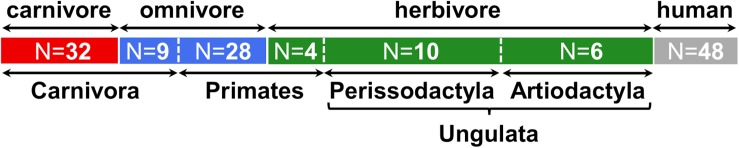
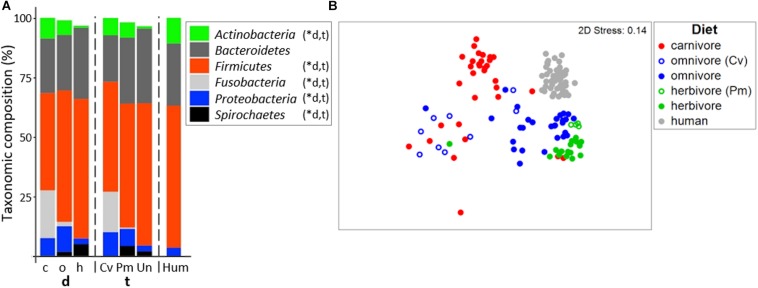
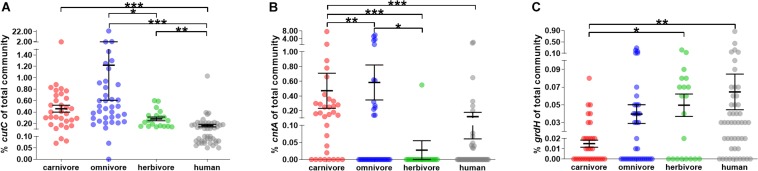
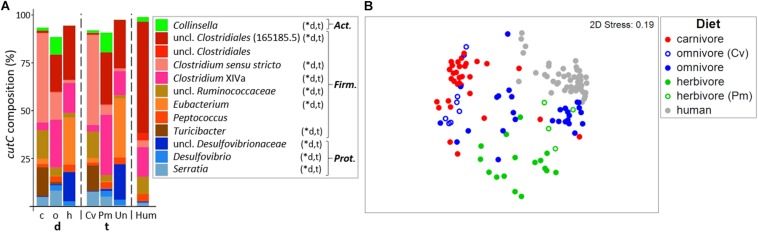
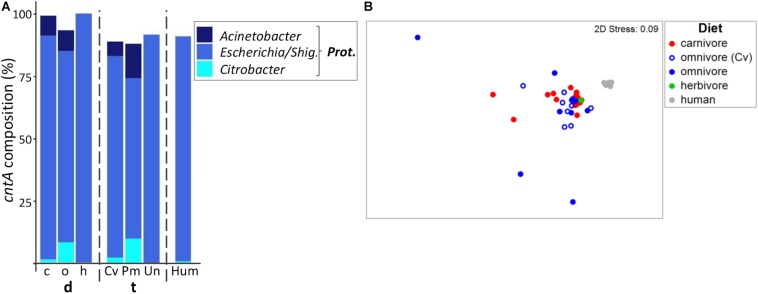
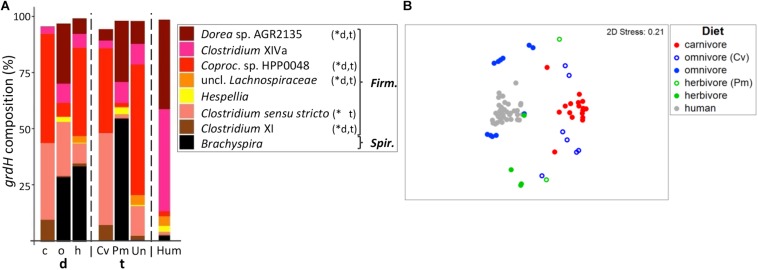
Human gut bacteria metabolize dietary components such as choline and carnitine to trimethylamine (TMA) that is subsequently oxidized to trimethylamine-N-oxide (TMAO) by hepatic enzymes. Increased plasma levels of TMAO are associated with the development of cardiovascular and renal disease. In this study, we applied gene-targeted assays in order to quantify (qPCR) and characterize (MiSeq) bacterial genes encoding enzymes responsible for TMA production, namely choline-TMA lyase (CutC), carnitine oxygenase (CntA) and betaine reductase (GrdH) in 89 fecal samples derived from various mammals spanning three dietary groups (carnivores, omnivores and herbivores) and four host orders (Carnivora, Primates, Artiodactyla and Perissodactyla). All samples contained potential TMA-producing bacteria, however, at low abundances (<1.2% of total community). The cutC gene was more abundant in omnivores and carnivores compared with herbivores. CntA was almost absent from herbivores and grdH showed lowest average abundance of all three genes. Bacteria harboring cutC and grdH displayed high diversities where sequence types affiliated with various taxa within Firmicutes dominated, whereas cntA comprised sequences primarily linked to Escherichia. Composition of TMA-forming communities was strongly influenced by diet and host taxonomy and despite their high correlation, both factors contributed uniquely to community structure. Furthermore, Random Forest (RF) models could differentiate between groups at high accuracies. This study gives a comprehensive overview of potential TMA-producing bacteria in the mammalian gut demonstrating that both diet and host taxonomy govern their abundance and composition. It highlights the role of functional redundancy sustaining potential TMA formation in distinct gut environments.

Keywords: betaine; carnitine; choline; diet; gut microbiota; mammals; microbial ecology; trimethylamine.


Figures

FIGURE 1
FIGURE 1
Overview of samples included in this study. Numbers (N) of animals belonging to each group are indicated. At the top, the dietary classification is shown and highlighted by colors (red: carnivore, blue: omnivore, green: herbivore, gray: human), while at the bottom the taxonomic affiliations at the order (and clade) level is given. More detailed information is presented in Supplementary Table S2.
FIGURE 2
FIGURE 2
Bacterial community composition in mammals. (A) shows relative mean abundances of bacterial phyla (based on 16S rRNA gene abundances) for the dietary (d) groups carnivores (c), omnivores (o), and herbivores (h) as well as the taxonomic (t) groups Carnivora (Cv), Primates (Pm), and Ungulata (Un). The community composition of human (Hum) samples is shown for comparison. Denotes significant difference (p < 0.05) in relative abundance between dietary and taxonomic groups as calculated by FDR-corrected Kruskal–Wallis tests. Only phyla with mean abundances >1% are shown. The non-metric multi-dimensional scaling plot (nMDS) in (B) depicts the ordination results of gut communities based on Bray-Curtis similarities of standardized square-root transformed relative abundance data at the genus level.
FIGURE 3
FIGURE 3
Relative abundance of genes encoding enzymes for TMA formation in mammals. (A–C) show the abundance of cutC, cntA and grdH of the total bacterial community (relative to total 16S rRNA gene abundance), respectively. In all panels, samples were grouped into herbivores (green), omnivores (blue) and carnivores (red). Human samples (gray) are shown for comparison. The black line represents the mean and its standard error. Significant differences based on FDR-corrected Kruskal–Wallis tests are symbolized as follows: p ≤ 0.05; ∗∗p ≤ 0.01; ∗∗∗p ≤ 0.001. Note the y-axis breaks at 0.1 and 1.5% for cutC abundance, at 0.1 and 1% for cntA abundance and 0.02 and 0.1% for grdH abundance.
FIGURE 4
FIGURE 4
Taxonomic composition of cutC genes in mammals. (A) shows the relative mean abundance of cutC gene types (binned according to affiliated taxa) for the dietary (d) groups carnivores (c), omnivores (o), and herbivores (h), as well as the taxonomic (t) groups Carnivora (Cv), Primates (Pm), and Ungulata (Un). CutC gene variants observed in human (Hum) samples are shown for comparison. Denotes significant difference in relative abundance between dietary and taxonomic groups as calculated by FDR-corrected Kruskal–Wallis tests. Act., Actinobacteria; Firm., Firmicutes; Prot., Proteobacteria. Only taxa with mean abundances >1% are shown. The non-metric multi-dimensional scaling plot (nMDS) in (B) depicts the ordination results of cutC gene communities based on Bray-Curtis similarities of standardized square-root transformed abundance data from complete linkage clustering (90% similarity of translated protein sequences).
FIGURE 5
FIGURE 5
Taxonomic composition of cntA genes in mammals. (A) shows the relative mean abundance of cntA gene types (binned according to affiliated taxa) for the dietary (d) groups carnivores (c), omnivores (o), and herbivores (h) as well as the taxonomic (t) groups Carnivora (Cv), Primates (Pm), and Ungulata (Un). CntA gene variants observed in human (Hum) samples are shown for comparison. Prot., Proteobacteria; Shig., Shigella. Only taxa with mean abundances >1% are shown. The non-metric multi-dimensional scaling plot (nMDS) in (B) depicts the ordination results of cntA gene communities based on Bray-Curtis similarities of standardized square-root transformed abundance data from complete linkage clustering (90% similarity of translated protein sequences).
FIGURE 6
FIGURE 6
Taxonomic composition of grdH genes in mammals. (A) shows the relative mean abundance of grdH gene types (binned according to affiliated taxa) for the dietary (d) groups carnivores (c), omnivores (o), and herbivores (h) as well as the taxonomic (t) groups Carnivora (Cv), Primates (Pm), and Ungulata (Un). GrdH gene variants observed in human (Hum) samples are shown for comparison. Denotes significant difference in relative abundance between dietary and taxonomic groups as calculated by FDR-corrected Kruskal–Wallis tests. Firm, Firmicutes; Spir., Spirochetes; Coproc., Coprococcus. Only taxa with mean abundances >1% are shown. The non-metric multi-dimensional scaling plot (nMDS) in (B) depicts the catabolic grdH gene structures based on Bray-Curtis similarities of standardized square-root transformed abundance data from complete-linkage clustering (90% similarity of translated protein sequences).

Similar articles

Cited by

References

    1. Andreesen J. R. (1994). Glycine metabolism in anaerobes. Antonie Van Leeuwenhoek 66 223–237. 10.1007/BF00871641 - DOI - PubMed
    1. Borrel G., Mccann A., Deane J., Neto M. C., Lynch D. B., Brugère J.-F., et al. (2017). Genomics and metagenomics of trimethylamine-utilizing Archaea in the human gut microbiome. ISME J. 11 2059–2074. 10.1038/ismej.2017.72 - DOI - PMC - PubMed
    1. Clarke K. R., Gorley R. N., Somerfield P. J., Warwick R. M. (2014). Change in Marine Communities: An approach to Statistical Analysis and Interpretation, 3rd Edn Plymouth: PRIMER-E, 256.
    1. Cole J. R., Wang Q., Fish J. A., Chai B., McGarrell D. M., Sun Y., et al. (2014). Ribosomal database project: data and tools for high throughput rRNA analysis. Nucleic Acids Res. 42 633–642. 10.1093/nar/gkt1244 - DOI - PMC - PubMed
    1. Costa M. C., Arroyo L. G., Allen-Vercoe E., Stämpfli H. R., Kim P. T., Sturgeon A., et al. (2012). Comparison of the fecal microbiota of healthy horses and horses with colitis by high throughput sequencing of the V3-V5 region of the 16s rRNA gene. PLoS One 7:e41484. 10.1371/journal.pone.0041484 - DOI - PMC - PubMed

LinkOut - more resources