. 2020 Jan 9:10:2945.
doi: 10.3389/fimmu.2019.02945. eCollection 2019.

Acidic Microenvironment Regulates the Severity of Hepatic Ischemia/Reperfusion Injury by Modulating the Generation and Function of Tregs via the PI3K-mTOR Pathway

Affiliations

Acidic Microenvironment Regulates the Severity of Hepatic Ischemia/Reperfusion Injury by Modulating the Generation and Function of Tregs via the PI3K-mTOR Pathway

Xiaojie Gan et al. Front Immunol. .

Abstract

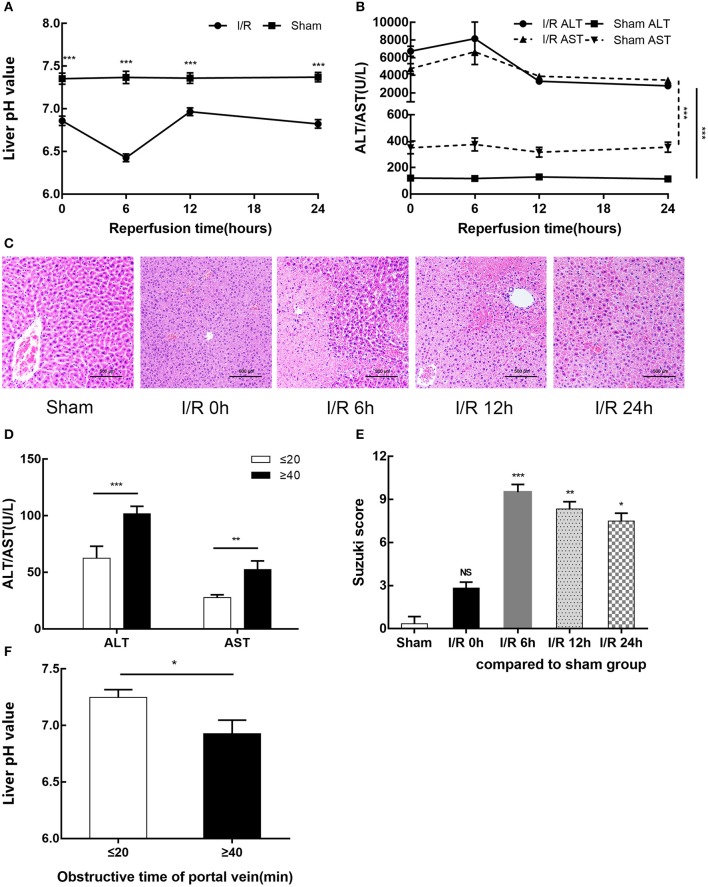
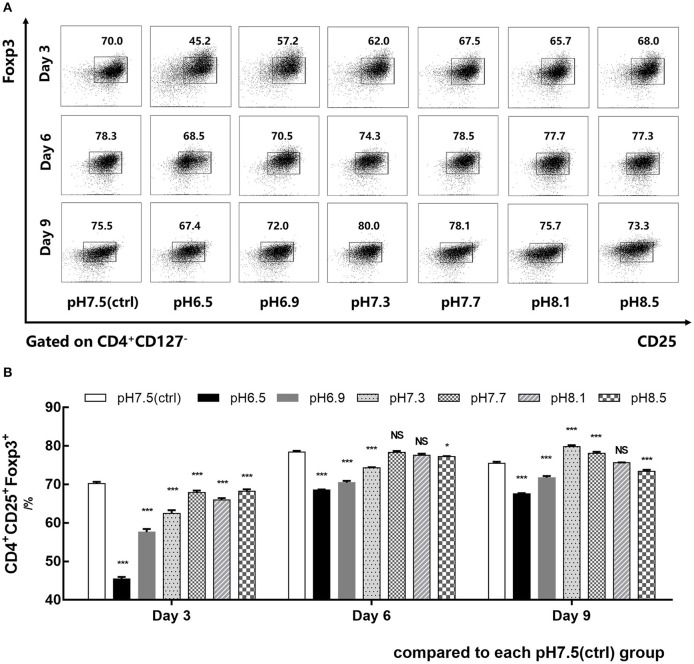
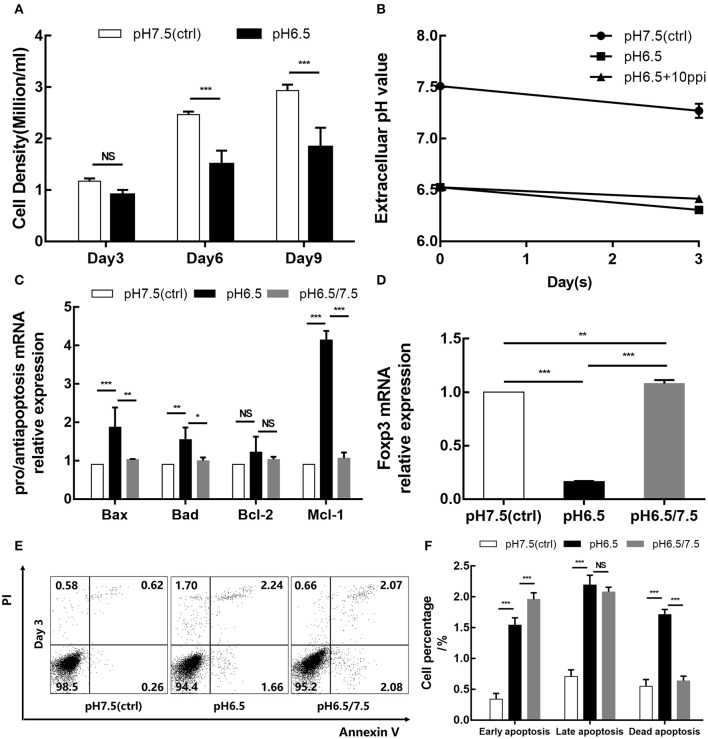
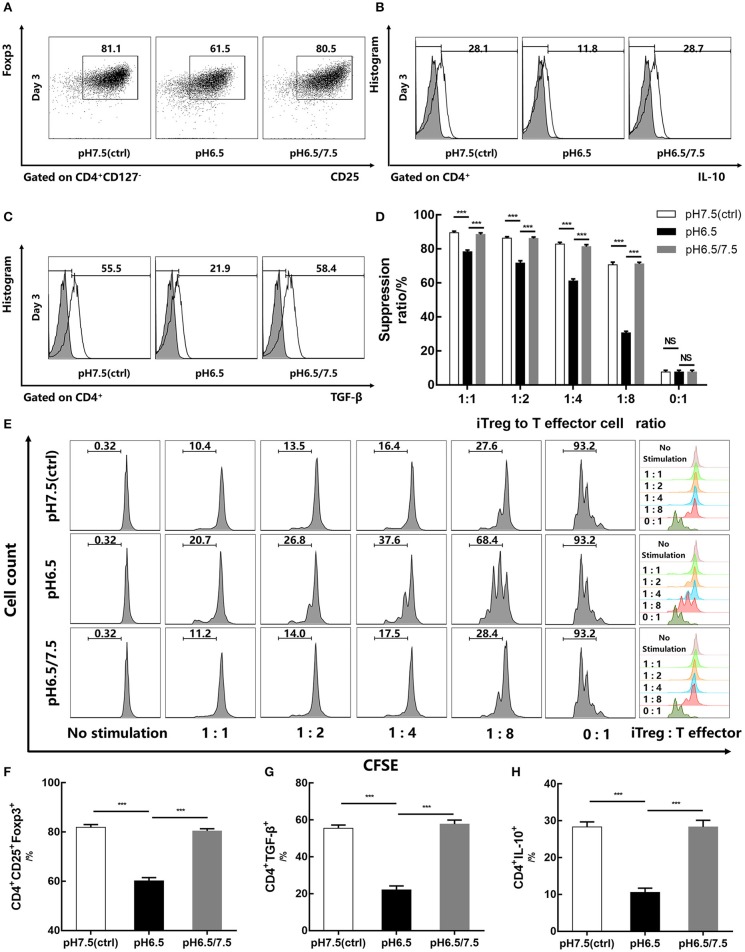
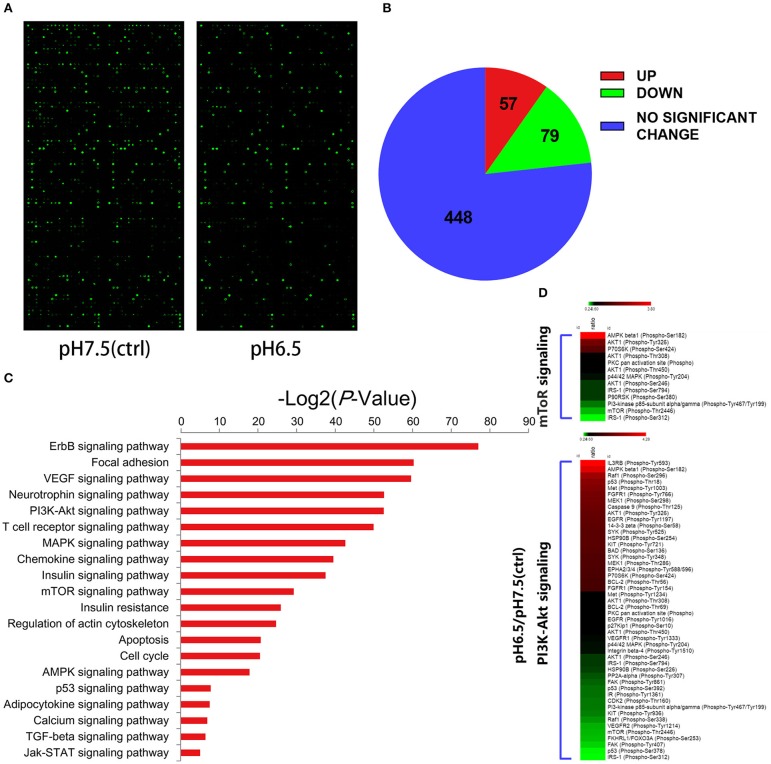
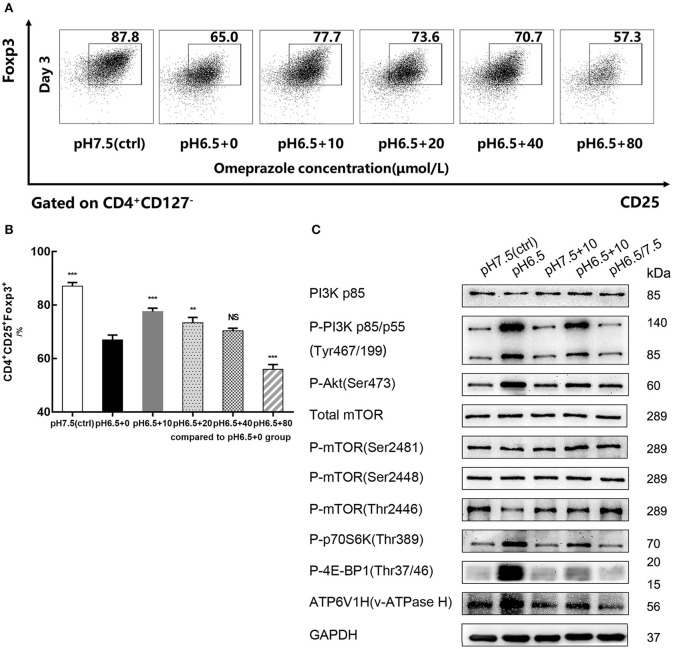
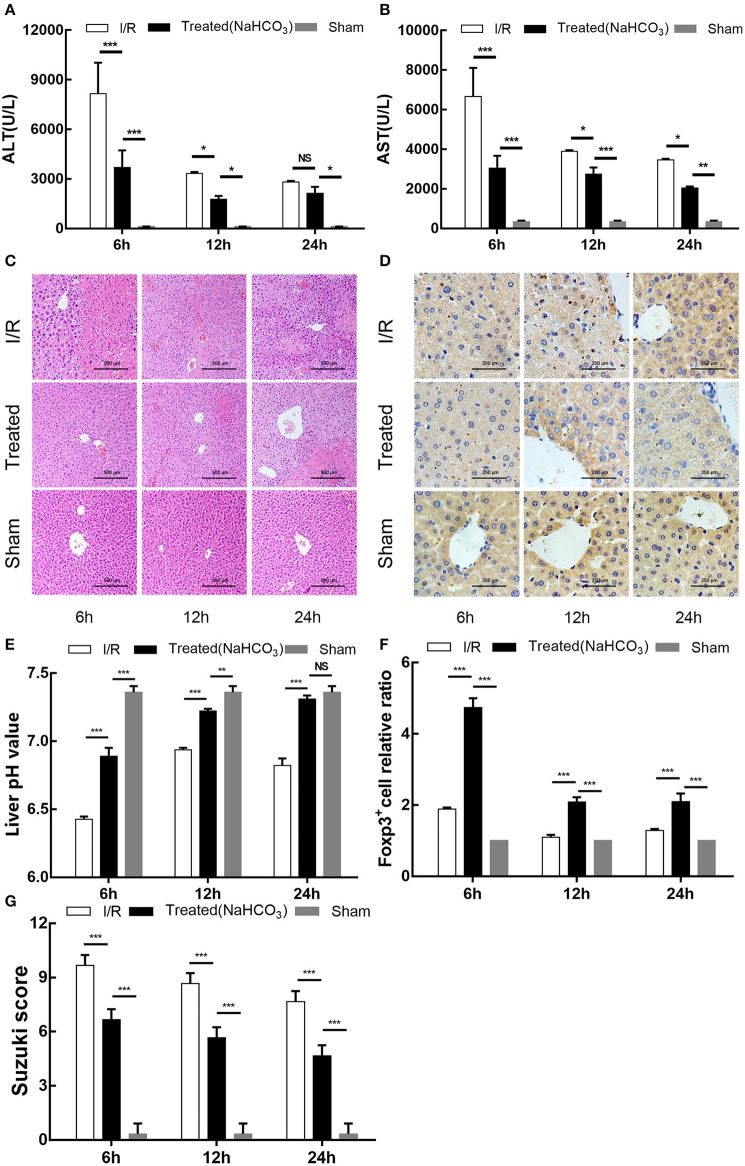
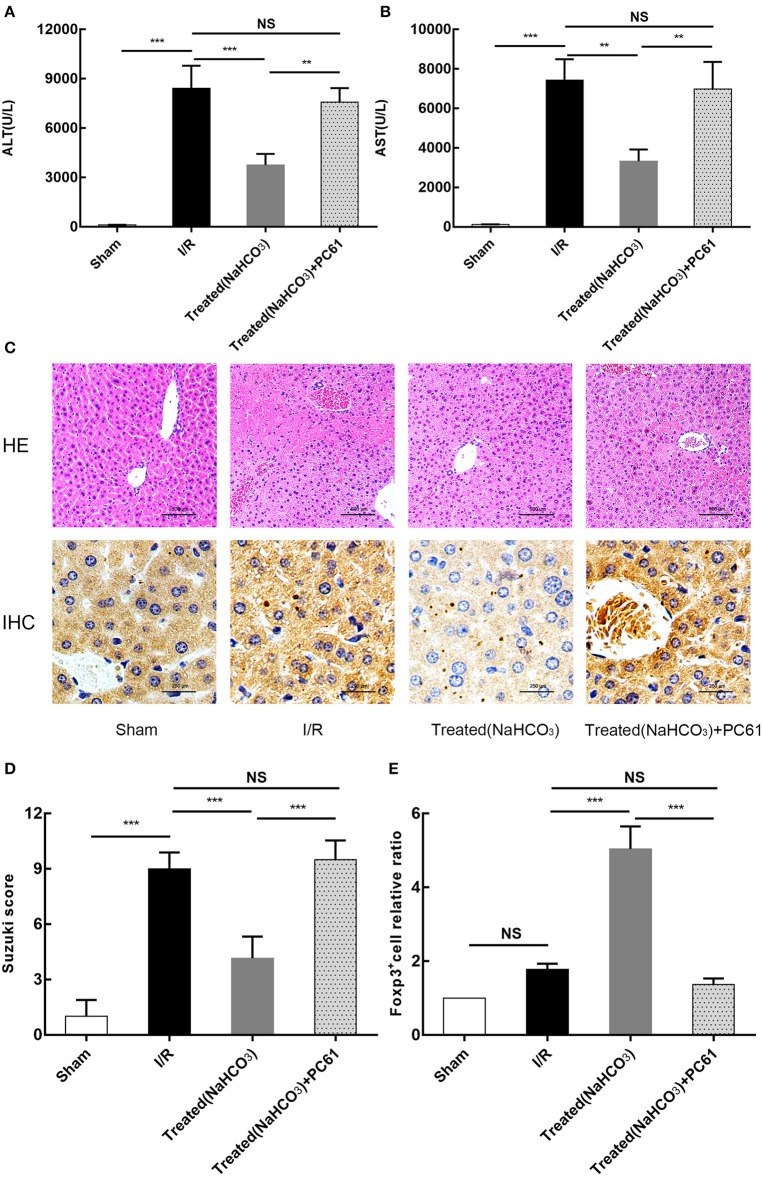
Hepatic ischemia/reperfusion injury (HIRI) is a major cause of liver dysfunction and even liver failure after liver transplantation and hepatectomy. One of the critical mechanisms that lead to HIRI is an acidic microenvironment, which develops due to the accumulation of high acid-like substances such as lactic acid and ketone bodies. Previous studies have shown that the adoptive transfer of induced regulatory T cells (iTregs) attenuates HIRI; however, little is known about the function of Tregs in the acidic microenvironment of a HIRI model. In the present study, we examined the effect of acidic microenvironment on Tregs in vitro and in vivo. Here, we report that microenvironment acidification and dysfunction of the liver is induced during HIRI in humans and mice and that an acidic microenvironment can inhibit the generation and function of CD4+CD25+Foxp3+ iTregs via the PI3K/Akt/mTOR signaling pathway. By contrast, the reversal of the acidic microenvironment restored Foxp3 expression and iTreg function. In addition, the results of cell culture in vitro indicated that the proton pump inhibitor omeprazole improves decreased iTreg differentiation caused by the acidic microenvironment, suggesting the potential clinical use of proton pump inhibitors as immunoregulatory therapy in the treatment of HIRI. Furthermore, our findings demonstrate that buffering the acidic microenvironment to attenuate HIRI in mice has an inseparable relationship with Tregs. Thus, an acidic microenvironment is a key regulator in HIRI, involved in modulating the generation and function of Tregs.

Keywords: Treg; acidic microenvironment; hepatic ischemia/reperfusion injury; immune cells; signaling.


Figures

Figure 1
Figure 1
HIRI causes microenvironment acidification and dysfunction of the liver in humans and mice. (A) pH value of injured liver lobe by time point after reperfusion in mice. (B) Serum alanine aminotransferase (ALT) and aspartate transaminase (AST) levels in sham and I/R mouse groups. (C) Representative images of mouse liver injury [hematoxylin and eosin (HE) staining, 200×] by light microscopy. (D) Serum ALT and AST levels of 20 patients undergoing partial hepatectomy surgery by hepatic portal occlusion time after operation. (E) Suzuki scores evaluating liver biopsies by group, as performed by an experienced pathologist. (F) pH value of excised liver tissue of 20 patients undergoing partial hepatectomy surgery by hepatic portal occlusion time. Data are presented as the means ± SD from three independent experiments. *p < 0.05; **p < 0.01; ***p < 0.001.
Figure 2
Figure 2
Acidic microenvironment decreases CD4+CD25+Foxp3+ iTreg induction by proapoptosis. (A) Induction efficiency of CD4+CD45RA+ naïve T cells cultured with IL-2 and TGF-β for 9 days at the indicated pH values. (B) Statistical analysis of induction efficiency. Data are presented as the means ± SD from three independent experiments. NS, not significant. *p < 0.05; ***p < 0.001.
Figure 3
Figure 3
Acidic microenvironment downregulates the iTreg proliferation and Foxp3 expression and promotes apoptosis of iTregs. (A) Cell density of the pH 6.5 and pH 7.5 groups by time point. (B) Changes in extracellular pH during cell culture. (C) Expression of pro-apoptotic genes (Bax and Bad) and anti-apoptosis genes (Bcl-2 and Mcl-1) measured by qRT-PCR at the transcriptional level after 3 days of culture. (D) mRNA expression of Foxp3 in iTregs measured by qRT-PCR at the indicated pH values after 3 days of culture. (E) Cell apoptosis after Annexin V/PI staining at the indicated pH values. (F) Statistical analysis of cell apoptosis by pH group. Data are presented as the means ± SD from three independent experiments. NS, not significant. *p < 0.05; **p < 0.01; ***p < 0.001.
Figure 4
Figure 4
Reversal of acidic microenvironment restores Foxp3 expression and iTreg function. (A) The proportion of CD4+CD25+Foxp3+ iTregs cultured with IL-2 and TGF-β for 3 days. (B,C) The proportion of CD4+IL-10+ and CD4+ TGF-β+ T cells cultured with IL-2 and TGF-β for 3 days and stimulated with phorbol 12-myristate 13-acetate, brefeldin A, and ionomycin for 6 h before the assay. (D) Statistical analysis of the suppression assay in vitro. (E) iTregs induced in media of varying pH values for 3 days were co-cultured with carboxyfluorescein succinimidyl ester-stained human naïve CD4+ T cells (responders) at the indicated ratio. After 72 h of activation with anti-CD3/CD28-conjugated beads, responder cell proliferation was assessed by flow cytometry. (F–H) Statistical analysis of related results of flow cytometry. Data are presented as the means ± SD from three independent experiments. ***p < 0.001.
Figure 5
Figure 5
Differential expression of phospho-specific protein between cells in the pH 7.5 and pH 6.5 groups. (A) Original images of phosphorylated protein chips by SureScan Dx Microarray Scanner from two groups. (B) Phosphorylation sites (582) of all (432) screened proteins based on a phospho-specific protein microarray analysis. (C) KEGG enrichment analysis of proteins in the phospho-specific protein microarray according to cellular component, biological process, and molecular function. (D) Heat map representing the fold change in the expression of different phosphorylated sites of proteins in the PI3K/Akt/mTOR signaling pathway (fold change Phos/Unphos ≥ 1.6).
Figure 6
Figure 6
Omeprazole reverses the decreased iTreg differentiation caused by acidic pH. (A) Induction efficiency of CD4+CD45RA+ naïve T cells cultured with varying concentrations of omeprazole for 3 days at the indicated pH values. (B) Statistical analysis of induction efficiency of different groups. (C) Cells of different groups were harvested and subjected to SDS-PAGE and Western blot with the indicated antibodies. Data are presented as the means ± SD from three independent experiments. NS, not significant. **p < 0.01; ***p < 0.001.
Figure 7
Figure 7
Buffering of acidic microenvironment increases Treg infiltration and alleviates liver injury in HIRI mouse model. (A,B) Serum ALT and aspartate transaminase (AST) levels in the I/R, NaHCO3 treatment, and sham mouse groups by time points. (C) Representative light microscopy images of mouse liver injury (HE staining, 200×) in the I/R, NaHCO3 treatment, and sham groups by time point. (D) Representative light microscopy images of mice liver immunohistochemical staining in the I/R, NaHCO3 treatment, and sham groups (brown: positive cells, anti-Foxp3, 400×) by time point. (E) pH values of injured liver lobe after reperfusion in I/R, NaHCO3 treatment, and sham mouse groups by time point. (F) Statistical analysis of Foxp3+ cell relative ratio of I/R, NaHCO3 treatment, and sham mouse groups in immunohistochemical staining. (G) Suzuki scores evaluating liver biopsies from different groups, as performed by an experienced pathologist. Data are presented as the means ± SD from three independent experiments. NS, not significant. *p < 0.05; **p < 0.01; ***p < 0.001.
Figure 8
Figure 8
Reversal of acidic microenvironment attenuates HIRI in mice via Treg function. (A,B) Serum ALT and aspartate transaminase (AST) levels of mice in sham, I/R, NaHCO3 treatment, and NaHCO3 + PC61 treatment groups after reperfusion for 6 h. (C) Representative images of mouse liver injury (HE staining, 200×; immunohistochemical staining, 400×) in sham, I/R, NaHCO3 treatment, and NaHCO3 + PC61 treatment groups by light microscopy after reperfusion for 6 h. (D) Suzuki scores evaluating liver biopsies from different groups, as performed by an experienced pathologist. (E) Statistical analysis of Foxp3+ cells relative ratio of sham, I/R, NaHCO3 treatment, and NaHCO3 + PC61 treatment groups in immunohistochemical staining. Data are presented as the means ± SD from three independent experiments. NS, not significant. **p < 0.01; ***p < 0.001.

References

    1. Shuh M, Bohorquez H, Loss GE, Jr, Cohen AJ. Tumor necrosis factor-alpha: life and death of hepatocytes during liver ischemia/reperfusion injury. Ochsner J. (2013) 13:119–30. - PMC - PubMed
    1. Li J, Li RJ, Lv GY, Liu HQ. The mechanisms and strategies to protect from hepatic ischemia-reperfusion injury. Eur Rev Med Pharmacol Sci. (2015) 19:2036–47. - PubMed
    1. Guan LY, Fu PY, Li PD, Li ZN, Liu HY, Xin MG, et al. . Mechanisms of hepatic ischemia-reperfusion injury and protective effects of nitric oxide. World J Gastrointest Surg. (2014) 6:122–8. 10.4240/wjgs.v6.i7.122 - DOI - PMC - PubMed
    1. He Z, Ma C, Yu T, Song J, Leng J, Gu X, et al. . Activation mechanisms and multifaceted effects of mast cells in ischemia reperfusion injury. Exp Cell Res. (2019) 376:227–35. 10.1016/j.yexcr.2019.01.022 - DOI - PubMed
    1. Datta G, Fuller BJ, Davidson BR. Molecular mechanisms of liver ischemia reperfusion injury: insights from transgenic knockout models. World J Gastroenterol. (2013) 19:1683–98. 10.3748/wjg.v19.i11.1683 - DOI - PMC - PubMed

Publication types

MeSH terms