

Decreased nonspecific adhesivity, receptor-targeted therapeutic nanoparticles for primary and metastatic breast cancer
- PMID: 31998833
- PMCID: PMC6962043
- DOI: 10.1126/sciadv.aax3931
Decreased nonspecific adhesivity, receptor-targeted therapeutic nanoparticles for primary and metastatic breast cancer
Abstract
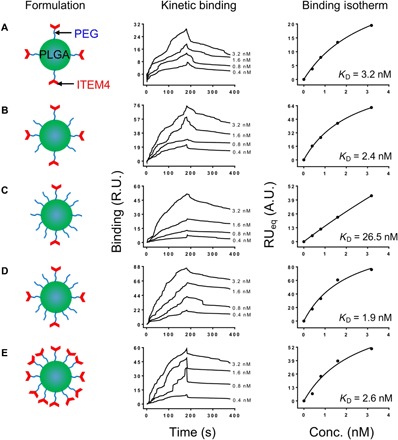
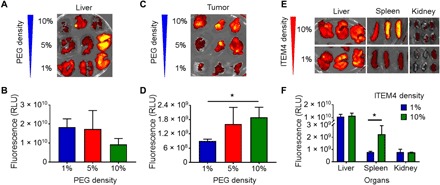
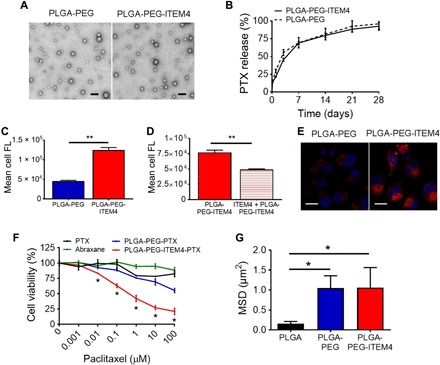
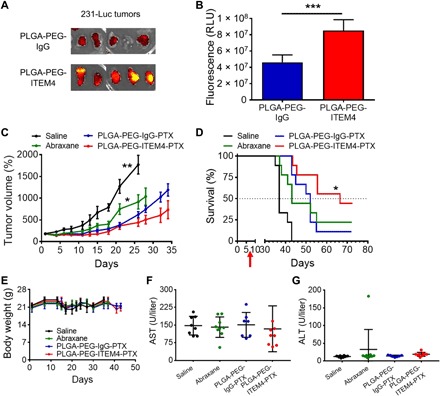
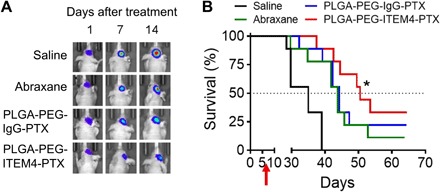
Development of effective tumor cell-targeted nanodrug formulations has been quite challenging, as many nanocarriers and targeting moieties exhibit nonspecific binding to cellular, extracellular, and intravascular components. We have developed a therapeutic nanoparticle formulation approach that balances cell surface receptor-specific binding affinity while maintaining minimal interactions with blood and tumor tissue components (termed "DART" nanoparticles), thereby improving blood circulation time, biodistribution, and tumor cell-specific uptake. Here, we report that paclitaxel (PTX)-DART nanoparticles directed to the cell surface receptor fibroblast growth factor-inducible 14 (Fn14) outperformed both the corresponding PTX-loaded, nontargeted nanoparticles and Abraxane, an FDA-approved PTX nanoformulation, in both a primary triple-negative breast cancer (TNBC) model and an intracranial model reflecting TNBC growth following metastatic dissemination to the brain. These results provide new insights into methods for effective development of therapeutic nanoparticles as well as support the continued development of the DART platform for primary and metastatic tumors.
Copyright © 2020 The Authors, some rights reserved; exclusive licensee American Association for the Advancement of Science. No claim to original U.S. Government Works. Distributed under a Creative Commons Attribution NonCommercial License 4.0 (CC BY-NC).
Figures
Similar articles
-
Albumin Nanoparticle of Paclitaxel (Abraxane) Decreases while Taxol Increases Breast Cancer Stem Cells in Treatment of Triple Negative Breast Cancer.Mol Pharm. 2020 Jul 6;17(7):2275-2286. doi: 10.1021/acs.molpharmaceut.9b01221. Epub 2020 Jun 17. Mol Pharm. 2020. PMID: 32485107 Free PMC article.
-
Growth of Metastatic Triple-Negative Breast Cancer Is Inhibited by Deep Tumor-Penetrating and Slow Tumor-Clearing Chemotherapy: The Case of Tumor-Adhering Liposomes with Interstitial Drug Release.Mol Pharm. 2020 Jan 6;17(1):118-131. doi: 10.1021/acs.molpharmaceut.9b00812. Epub 2019 Dec 23. Mol Pharm. 2020. PMID: 31825626
-
Aminoflavone-loaded EGFR-targeted unimolecular micelle nanoparticles exhibit anti-cancer effects in triple negative breast cancer.Biomaterials. 2016 Sep;101:20-31. doi: 10.1016/j.biomaterials.2016.05.041. Epub 2016 May 27. Biomaterials. 2016. PMID: 27267625 Free PMC article.
-
Targeted Therapies for Triple-Negative Breast Cancer.Curr Treat Options Oncol. 2019 Nov 21;20(11):82. doi: 10.1007/s11864-019-0682-x. Curr Treat Options Oncol. 2019. PMID: 31754897 Review.
-
Targeted nanoparticles for image-guided treatment of triple-negative breast cancer: clinical significance and technological advances.Wiley Interdiscip Rev Nanomed Nanobiotechnol. 2015 Nov-Dec;7(6):797-816. doi: 10.1002/wnan.1343. Epub 2015 May 12. Wiley Interdiscip Rev Nanomed Nanobiotechnol. 2015. PMID: 25966677 Free PMC article. Review.
Cited by
-
Circular RNAs in renal cell carcinoma: from mechanistic to clinical perspective.Cancer Cell Int. 2023 Nov 22;23(1):288. doi: 10.1186/s12935-023-03128-w. Cancer Cell Int. 2023. PMID: 37993909 Free PMC article. Review.
-
Three birds with one stone: co-encapsulation of diclofenac and DL-menthol for realizing enhanced energy deposition, glycolysis inhibition and anti-inflammation in HIFU surgery.J Nanobiotechnology. 2022 May 6;20(1):215. doi: 10.1186/s12951-022-01437-2. J Nanobiotechnology. 2022. PMID: 35524259 Free PMC article.
-
Natural exosome-like nanovesicles from edible tea flowers suppress metastatic breast cancer via ROS generation and microbiota modulation.Acta Pharm Sin B. 2022 Feb;12(2):907-923. doi: 10.1016/j.apsb.2021.08.016. Epub 2021 Aug 18. Acta Pharm Sin B. 2022. PMID: 35256954 Free PMC article.
-
Monocyte-derived multipotent cell delivered programmed therapeutics to reverse idiopathic pulmonary fibrosis.Sci Adv. 2020 May 27;6(22):eaba3167. doi: 10.1126/sciadv.aba3167. eCollection 2020 May. Sci Adv. 2020. PMID: 32518825 Free PMC article.
-
Optimal design of synthetic circular RNAs.Exp Mol Med. 2024 Jun;56(6):1281-1292. doi: 10.1038/s12276-024-01251-w. Epub 2024 Jun 14. Exp Mol Med. 2024. PMID: 38871815 Free PMC article. Review.
References
-
- Kennecke H., Yerushalmi R., Woods R., Cheang M. C. U., Voduc D., Speers C. H., Nielsen T. O., Gelmon K., Metastatic behavior of breast cancer subtypes. J. Clin. Oncol. 28, 3271–3277 (2010). - PubMed
-
- Foulkes W. D., Smith I. E., Reis-Filho J. S., Triple-negative breast cancer. N. Engl. J. Med. 363, 1938–1948 (2010). - PubMed
-
- Kassam F., Enright K., Dent R., Dranitsaris G., Myers J., Flynn C., Fralick M., Kumar R., Clemons M., Survival outcomes for patients with metastatic triple-negative breast cancer: Implications for clinical practice and trial design. Clin. Breast Cancer 9, 29–33 (2009). - PubMed
-
- Guarneri V., Dieci M. V., Conte P., Relapsed triple-negative breast cancer: Challenges and treatment strategies. Drugs 73, 1257–1265 (2013). - PubMed
-
- Mohamed A., Krajewski K., Cakar B., Ma C. X., Targeted therapy for breast cancer. Am. J. Pathol. 183, 1096–1112 (2013). - PubMed
Publication types
MeSH terms
Substances
Grants and funding
LinkOut - more resources
Full Text Sources
Medical
