

Aquatic and terrestrial cyanobacteria produce methane
- PMID: 31998836
- PMCID: PMC6962044
- DOI: 10.1126/sciadv.aax5343
Aquatic and terrestrial cyanobacteria produce methane
Abstract
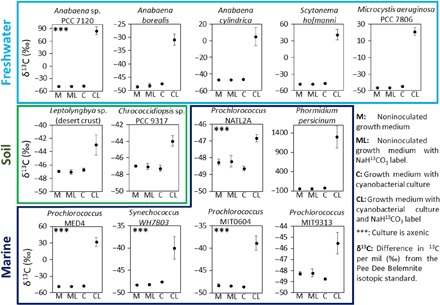
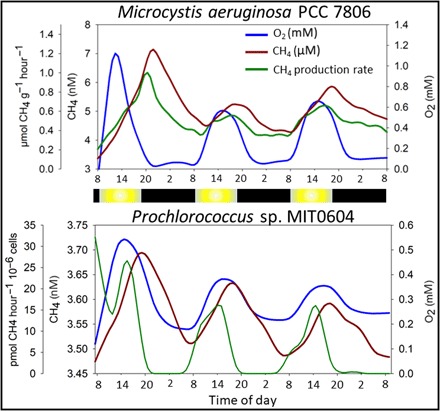
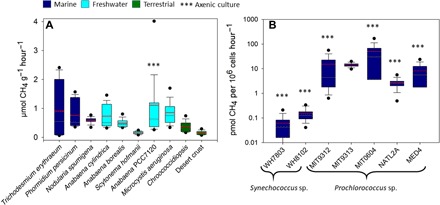
Evidence is accumulating to challenge the paradigm that biogenic methanogenesis, considered a strictly anaerobic process, is exclusive to archaea. We demonstrate that cyanobacteria living in marine, freshwater, and terrestrial environments produce methane at substantial rates under light, dark, oxic, and anoxic conditions, linking methane production with light-driven primary productivity in a globally relevant and ancient group of photoautotrophs. Methane production, attributed to cyanobacteria using stable isotope labeling techniques, was enhanced during oxygenic photosynthesis. We suggest that the formation of methane by cyanobacteria contributes to methane accumulation in oxygen-saturated marine and limnic surface waters. In these environments, frequent cyanobacterial blooms are predicted to further increase because of global warming potentially having a direct positive feedback on climate change. We conclude that this newly identified source contributes to the current natural methane budget and most likely has been producing methane since cyanobacteria first evolved on Earth.
Copyright © 2020 The Authors, some rights reserved; exclusive licensee American Association for the Advancement of Science. No claim to original U.S. Government Works. Distributed under a Creative Commons Attribution NonCommercial License 4.0 (CC BY-NC).
Figures
References
-
- Intergovernmental Panel on Climate Change, Ed., Climate Change 2013 - The Physical Science Basis (Cambridge Univ. Press, Cambridge, 2014).
-
- Saunois M., Bousquet P., Poulter B., Peregon A., Ciais P., Canadell J. G., Dlugokencky E. J., Etiope G., Bastviken D., Houweling S., Janssens-Maenhout G., Tubiello F. N., Castaldi S., Jackson R. B., Alexe M., Arora V. K., Beerling D. J., Bergamaschi P., Blake D. R., Brailsford G., Brovkin V., Bruhwiler L., Crevoisier C., Crill P., Covey K., Curry C., Frankenberg C., Gedney N., Höglund-Isaksson L., Ishizawa M., Ito A., Joos F., Kim H.-S., Kleinen T., Krummel P., Lamarque J.-F., Langenfelds R., Locatelli R., Machida T., Maksyutov S., McDonald K. C., Marshall J., Melton J. R., Morino I., Naik V., O’Doherty S., Parmentier F.-J. W., Patra P. K., Peng C., Peng S., Peters G. P., Pison I., Prigent C., Prinn R., Ramonet M., Riley W. J., Saito M., Santini M., Schroeder R., Simpson I. J., Spahni R., Steele P., Takizawa A., Thornton B. F., Tian H., Tohjima Y., Viovy N., Voulgarakis A., van Weele M., van der Werf G. R., Weiss R., Wiedinmyer C., Wilton D. J., Wiltshire A., Worthy D., Wunch D., Xu X., Yoshida Y., Zhang B., Zhang Z., Zhu Q., The global methane budget 2000-2012. Earth Syst. Sci. Data. 8, 697–751 (2016).
-
- Lenhart K., Klintzsch T., Langer G., Nehrke G., Bunge M., Schnell S., Keppler F., Evidence for methane production by the marine algae Emiliania huxleyi. Biogeosciences 13, 3163–3174 (2016).
-
- Keppler F., Hamilton J. T. G., Braß M., Röckmann T., Methane emissions from terrestrial plants under aerobic conditions. Nature 439, 187–191 (2006). - PubMed
-
- Tuboly E., Szabó A., Garab D., Bartha G., Janovszky Á., Ero″s G., Szabó A., Mohácsi Á., Szabó G., Kaszaki J., Ghyczy M., Boros M., Methane biogenesis during sodium azide-induced chemical hypoxia in rats. Am. J. Physiol. Physiol. 304, C207–C214 (2013). - PubMed
Publication types
MeSH terms
Substances
LinkOut - more resources
Full Text Sources
Other Literature Sources
