. 2020 Jan 15;6(3):eaay2174.
doi: 10.1126/sciadv.aay2174. eCollection 2020 Jan.

Direct targeting of oncogenic RAS mutants with a tumor-specific cytosol-penetrating antibody inhibits RAS mutant-driven tumor growth

Affiliations

Direct targeting of oncogenic RAS mutants with a tumor-specific cytosol-penetrating antibody inhibits RAS mutant-driven tumor growth

Seung-Min Shin et al. Sci Adv. .

Abstract

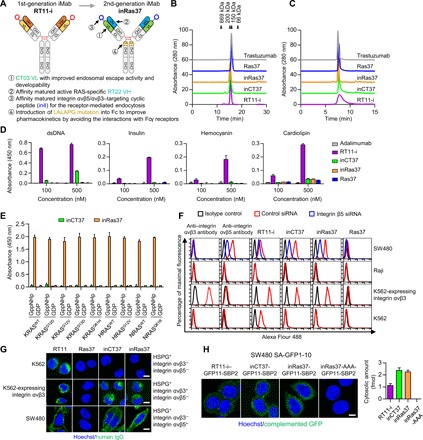
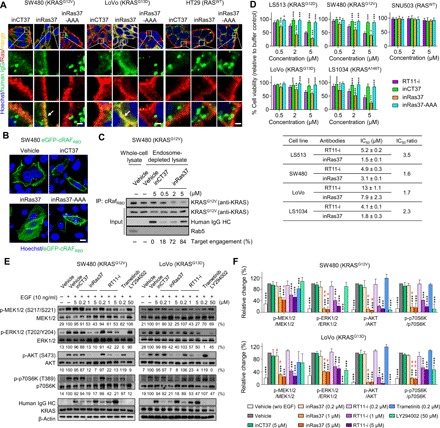
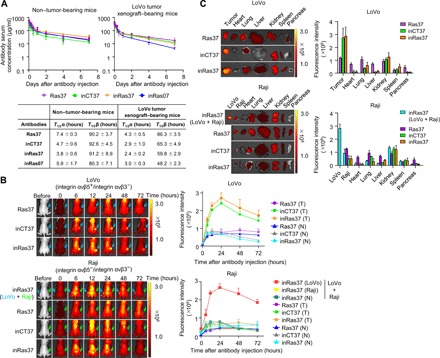
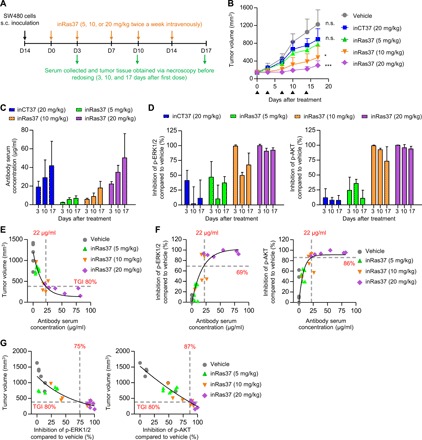
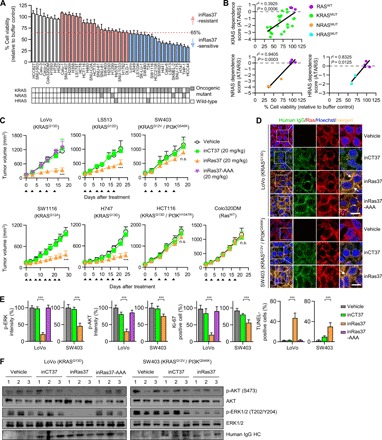
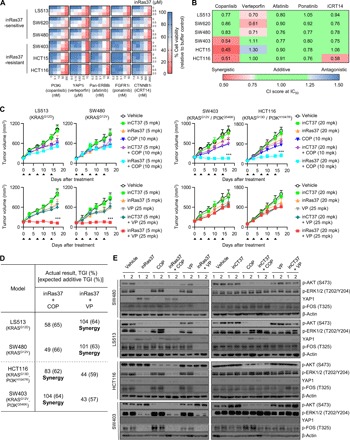
Oncogenic RAS mutant (RASMUT) proteins have been considered undruggable via conventional antibody regimens owing to the intracellular location restricting conventional-antibody accessibility. Here, we report a pan-RAS-targeting IgG antibody, inRas37, which directly targets the intracellularly activated form of various RASMUT subtypes after tumor cell-specific internalization into the cytosol to block the interactions with effector proteins, thereby suppressing the downstream signaling. Systemic administration of inRas37 exerted a potent antitumor activity in a subset of RASMUT tumor xenografts in mice, but little efficacy in RASMUT tumors with concurrent downstream PI3K mutations, which were overcome by combination with a PI3K inhibitor. The YAP1 protein was up-regulated as an adaptive resistance-inducing response to inRas37 in RASMUT-dependent colorectal tumors; accordingly, a combination of inRas37 with a YAP1 inhibitor manifested synergistic antitumor effects in vitro and in vivo. Our study offers a promising pan-RAS-targeting antibody and the corresponding therapeutic strategy against RASMUT tumors.


Figures

Fig. 1
Fig. 1. The engineered active RAS-specific iMab, inRas37, shows target cell–specific cytosol-penetrating activity with improved developability and endosomal escape.
(A) Engineering procedures to develop a second-generation active RAS-specific iMab, inRas37. (B and C) Elution profiles of antibodies purified on a size exclusion Superdex (B) and hydrophobic Zenix (C) column, with monitoring at 280 nm. The arrows indicate the elution positions of molecular weight standards. (D) Evaluation of nonspecific binding of the indicated antibodies to four antigens [double-stranded DNA (dsDNA), insulin, hemocyanin, and cardiolipin], as determined by ELISAs. (E) Selective binding of inRas37 (100 nM) to the GppNHp-bound active form of the indicated RAS proteins in comparison with the inactive GDP-bound form, as determined by an ELISA. (F) Binding specificity of the indicated antibodies (each at 20 nM) to integrin αvβ3 and integrin αvβ5 expressed on the surface of the indicated human cancer cells (flow cytometry data). siRNA, small interfering RNA. (G) Cellular internalization and cytosolic localization of the indicated antibodies (green) in the cells treated with 1 μM antibody for 12 hours before microscopic confocal analysis. Scale bars, 20 μm. (H) Split-GFP complementation assay to determine cytosolic localization of GFP11-SBP2–fused antibodies in SW480-SA-GFP1–GFP10 cells after 6-hour treatment with 1 μM antibody. Right: Quantified amount of cytosolic antibodies. Scale bar, 20 μm.
Fig. 2
Fig. 2. inRas37 exerts a potent antiproliferative action on KRASMUT cell lines by inhibiting KRASMUT downstream signaling.
(A) Cellular internalization and colocalization of the indicated antibodies (green) with activated RAS (red) in SW480, LoVo, and HT29 cells treated with 1 μM antibody for 12 hours before microscopic confocal analysis. The arrow indicates the colocalization of inRas37 with activated RAS. Scale bars, 5 μm. (B) Cytoplasmic distribution of the eGFP-cRAFRBD protein (green) in eGFP-cRAFRBD–transformed SW480 cells treated with 1 μM antibody for 12 hours before microscopic confocal analysis. Scale bar, 20 μm. (C) Immunoprecipitation (IP) of active KRASG12V with cRAFRBD from endosome-depleted cell lysates of SW480 cells following treatment with the indicated antibodies at the indicated concentrations for 12 hours. The Rab5 protein was analyzed as an early endosome marker. The number below the panel indicates a percentage of target engagement. (D) Viability of RASWT and various KRASMUT cell lines after treatment every other day (days 0, 2, and 4) with the indicated antibodies at the indicated concentrations for 6 days in three-dimensional spheroid cultures. *P < 0.05, **P < 0.01, and ***P < 0.001 versus the RT11-i–treated group. Bottom: IC50 values for RT11-i and inRas37 toward each cell line. The IC50 ratio was calculated as the IC50 of RT11-i divided by the IC50 of inRas37 for each cell line. (E and F) Representative images (E) and pooled densitometry data (F) of Western blots for SW480 and LoVo cells treated with the indicated antibodies, MEK1/2 inhibitor trametinib, or PI3K-AKT inhibitor LY294002 for 12 hours and then stimulated with EGF (10 ng/ml) for 10 min before cell lysis. The relative band intensity of the phosphorylated proteins toward that of respective total protein was expressed as a percentage of that in the buffer control. The number below the panel indicates the mean (E), and error bars represent means ± SD (F) of at least three independent experiments. ***P < 0.001 for each group versus EGF-stimulated vehicle-treated control; #P < 0.05 and ##P < 0.01 for inRas37 versus RT11-i at each equivalent concentration in each sample (unpaired two-tailed Student’s t test).
Fig. 3
Fig. 3. inRas37 has favorable PK and undergoes preferential tumor accumulation.
(A) Serum concentration–time profiles of the indicated antibodies following a single intravenous injection at 20 mpk into BALB/c nude mice without tumor (left) or with preestablished LoVo tumor xenografts (initial tumor volume = 120 mm3) (right). Error bars, ±SD (n = 3 per time point). The solid curves represent the fit of a two-compartment PK model to the data to estimate PK parameters: the initial rapid clearance phase (T1/2α) and the latter terminal serum clearance phase (T1/2β), as depicted in the inset table. (B) In vivo tumor-targeting ability of the indicated antibodies, evaluated by intravenous injection of DyLight 755–labeled antibodies (20 μg per mouse) into LoVo (top), Raji, or both LoVo (left flank) and Raji (right flank) tumor xenograft–bearing mice (bottom). Representative images are shown, which were acquired at the indicated time points after injection. Fluorescence intensities in the tumor tissue (T), as indicated by arrows, and normal tissues (N) were quantified by radiant efficiency. (C) Ex vivo analysis of fluorescence intensities quantified by radiant efficiency for excised tumors and normal organs 72 hours after intravenous injection of DyLight 755–labeled antibodies. Tumor tissue and normal organs of one representative mouse from each group are shown. In (B) and (C), error bars represent means ± SD (n = 4 per group).
Fig. 4
Fig. 4. In vivo antitumor activity of inRas37 correlates with the serum concentrations and target inhibition in the KRASG12V SW480 CDX mouse model.
(A) Schematic of dosing and PK and PD assessment of inRas37 in KRASG12V SW480 CDX-bearing BALB/c nude mice. s.c., subcutaneous. (B) Tumor growth curves in response to intravenous injection of the indicated antibodies at the indicated dose twice a week (arrowheads) for a total of five doses (n = 6 per group). *P < 0.05 and ***P < 0.001 versus inCT37; n.s., not significant. (C and D) Serum concentrations of the indicated antibodies (C) and percentage inhibition of p-ERK1/2 (left) and p-AKT (right) formation in tumor tissue lysates (D), as determined before antibody dosing on days 3 and 10 and at the end of treatment on day 17 (n = 3 per group on days 3 and 10 and n = 6 per group on day 17). (E and F) Plot of serum concentrations of inRas37 versus tumor volume (E) and versus percentage down-regulation of p-ERK1/2 (left) and p-AKT (right) (F) on day 17 (n = 6 per group). (G) Plot of tumor volume versus percentage down-regulation of p-ERK1/2 (left) and p-AKT (right) on day 17 (n = 6 per group). In (E) to (G), solid curves indicate the fit to the data via a four-parameter logistic equation.
Fig. 5
Fig. 5. In vitro responses of various RASMUT cell lines to inRas37 correlate with the in vivo responses.
(A) Viability of various RASMUT and RASWT cell lines after treatment every other day (days 0, 2, and 4) with inRas37 (2 μM) for 6 days as compared with buffer-treated control (n = 3). Bottom: Mutation status of RAS genes in the cells. RASMUT cells are colored according to the inRas37 sensitivity threshold at 65% cell viability. (B) Cell viability under the action of inRas37 treatment plotted versus KRAS, NRAS, or HRAS dependence scores (ATARiS) from Project DRIVE. Statistical analysis was performed using linear regression to determine r2 and P values. (C) Tumor growth curves in response to intravenous injection of the indicated antibodies at 20 mpk twice a week (arrowheads) into BALB/c nude mice harboring the indicated tumor xenografts. Error bars, ±SD (n = 6 per group, except for LoVo, n = 7 per group). ***P < 0.001 versus the inCT37 group. (D) IHC analysis of the indicated antibodies (green), with activated RAS (red) in KRASMUT LoVo and SW403 tumor tissues prepared 24 hours after the last treatment. The arrows indicate the colocalization of inRas37 with activated RAS. Scale bars, 10 μm. (E) IHC analysis of p-ERK1/2 (green), p-AKT (green), and Ki-67 (red) and TUNEL (green) staining levels in LoVo- and SW403-derived tumor tissues, as shown in fig. S6B. The panels show the percentage of relative fluorescence intensity compared to that in the vehicle-treated control and the percentage of Ki-67–positive and TUNEL-positive cells compared to the number of Hoechst 33342–stained cells in each sample. Error bars represent means ± SD of five random visual fields for each sample (two tumors per group). ***P < 0.001. (F) Western blot analysis of the indicated proteins in LoVo and SW403 tumor tissue lysates. In (D) to (F), tumor tissues were excised from mice 24 hours after the last treatment, as shown in (C).
Fig. 6
Fig. 6. Combination treatment identifies synergistic drug targets for inRas37 and some pharmacological inhibitors in RASMUT cell lines.
(A) Dose-response effects of combined treatment with inRas37 and one of the five pharmacological inhibitors (“i” in the label) on the viability of KRASMUT cell lines after combined treatment every other day (days 0, 2, and 4) at the indicated concentrations for 6 days in three-dimensional spheroid cultures. Heat maps show percentages of cell viability relative to a buffer-treated control (n = 3). (B) CI at IC50 for the combined treatment shown in (A), analyzed in the CompuSyn software. CI < 0.75 means a synergistic effect, 0.75 ≤ CI ≤ 1.25 denotes an additive effect, and CI > 1.25 means an antagonistic effect. (C) Tumor growth curves in response to the indicated treatments of BALB/c nude mice harboring the indicated tumor xenografts. The arrowheads indicate twice a week intravenous injection of the antibody and COP (PI3Ki copanlisib; top) or intraperitoneal injection of VP (YAP1i verteporfin; bottom) or the combined treatments at the indicated doses. Error bars indicate means ± SD (n = 6 per group). ***P < 0.001 versus group “inCT37 + COP” or “inCT37 + VP.” (D) Percentage of observed TGI and expected additive TGI, calculated via the Bliss independence model. The observed TGI by combination treatment that was higher than the expected additive TGI was considered synergistic. (E) Western blot analysis of the indicated proteins in SW480-, LS513-, HCT116-, and SW403-derived tumor tissues excised from mice 24 hours after the last treatment, as shown in (C).

Similar articles

Cited by

References

    1. Cox A. D., Fesik S. W., Kimmelman A. C., Luo J., Der C. J., Drugging the undruggable RAS: Mission possible? Nat. Rev. Drug Discov. 13, 828–851 (2014). - PMC - PubMed
    1. Hobbs G. A., Der C. J., Rossman K. L., RAS isoforms and mutations in cancer at a glance. J. Cell Sci. 129, 1287–1292 (2016). - PMC - PubMed
    1. Stephen A. G., Esposito D., Bagni R. K., McCormick F., Dragging ras back in the ring. Cancer Cell 25, 272–281 (2014). - PubMed
    1. Spencer-Smith R., O'Bryan J. P., Direct inhibition of RAS: Quest for the Holy Grail? Semin. Cancer Biol. 54, 138–148 (2019). - PMC - PubMed
    1. Ryan M. B., Corcoran R. B., Therapeutic strategies to target RAS-mutant cancers. Nat. Rev. Clin. Oncol. 15, 709–720 (2018). - PubMed

Publication types

MeSH terms