. 2020 Apr 6;217(4):e20182091.
doi: 10.1084/jem.20182091.

Sequential ubiquitination of NLRP3 by RNF125 and Cbl-b limits inflammasome activation and endotoxemia

Affiliations

Sequential ubiquitination of NLRP3 by RNF125 and Cbl-b limits inflammasome activation and endotoxemia

Juan Tang et al. J Exp Med. .

Abstract

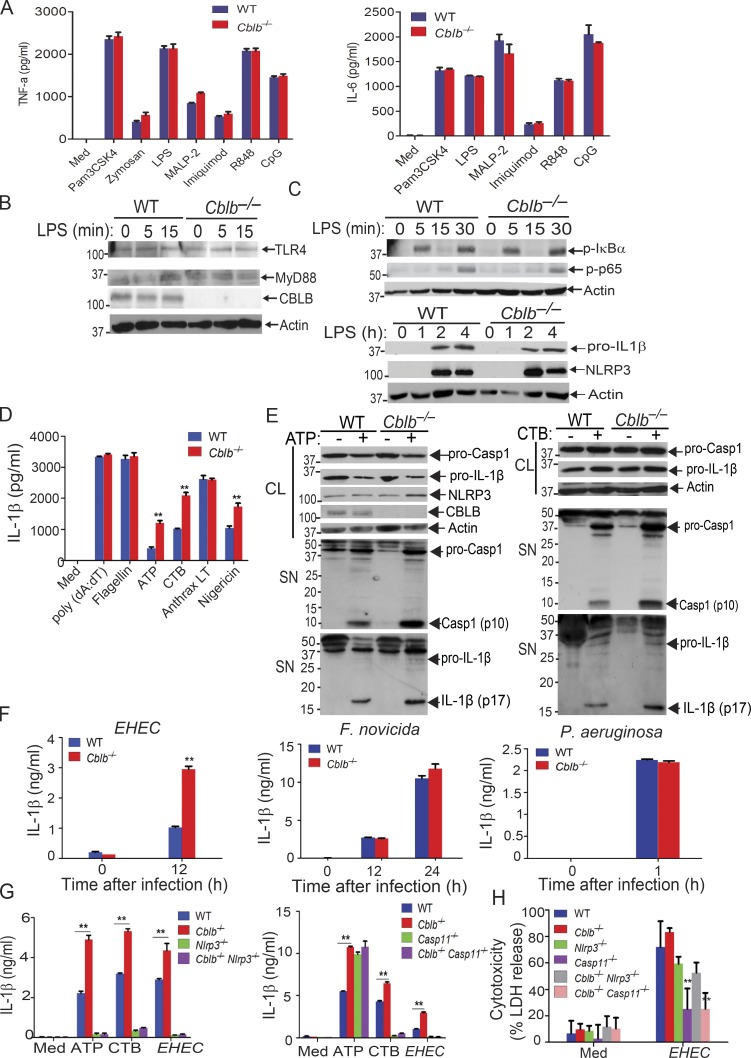
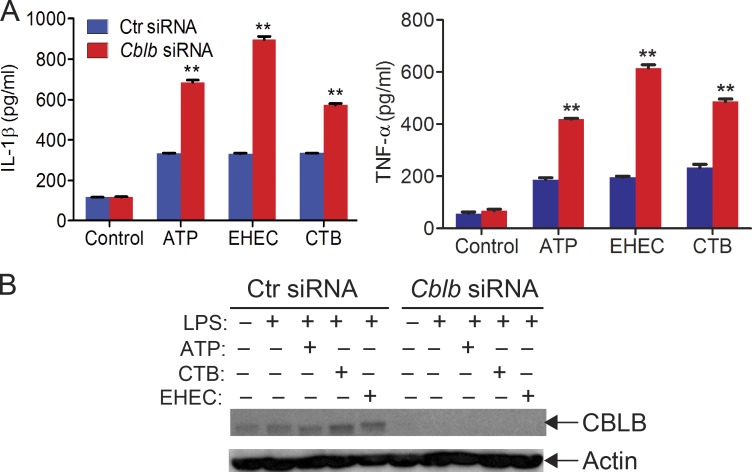
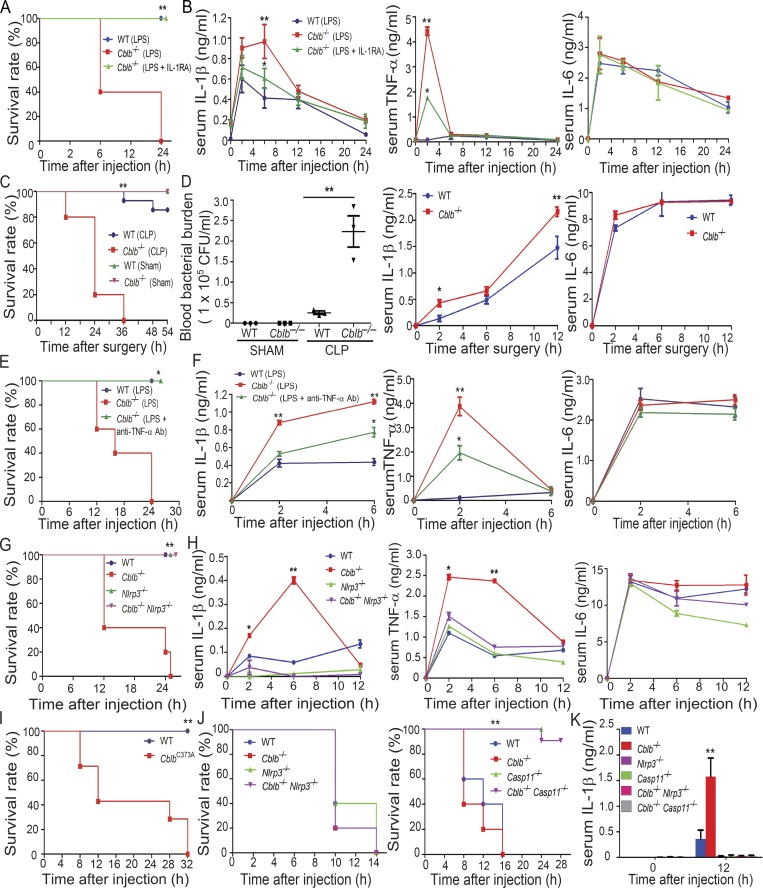
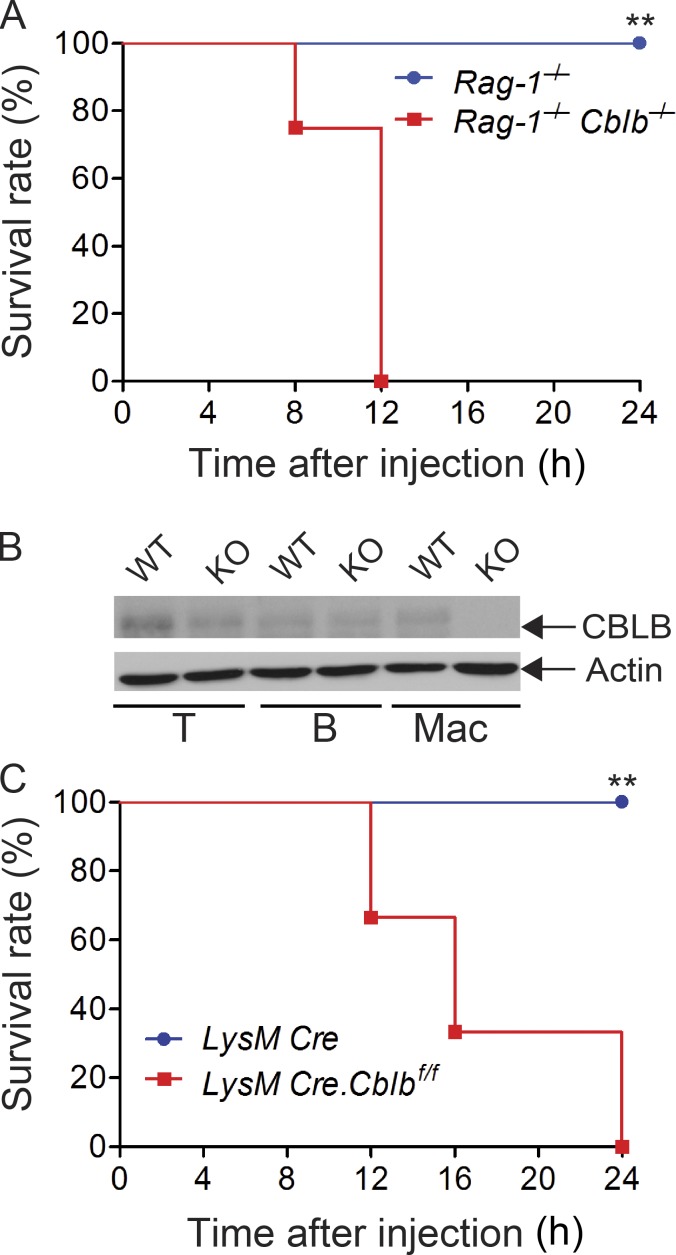
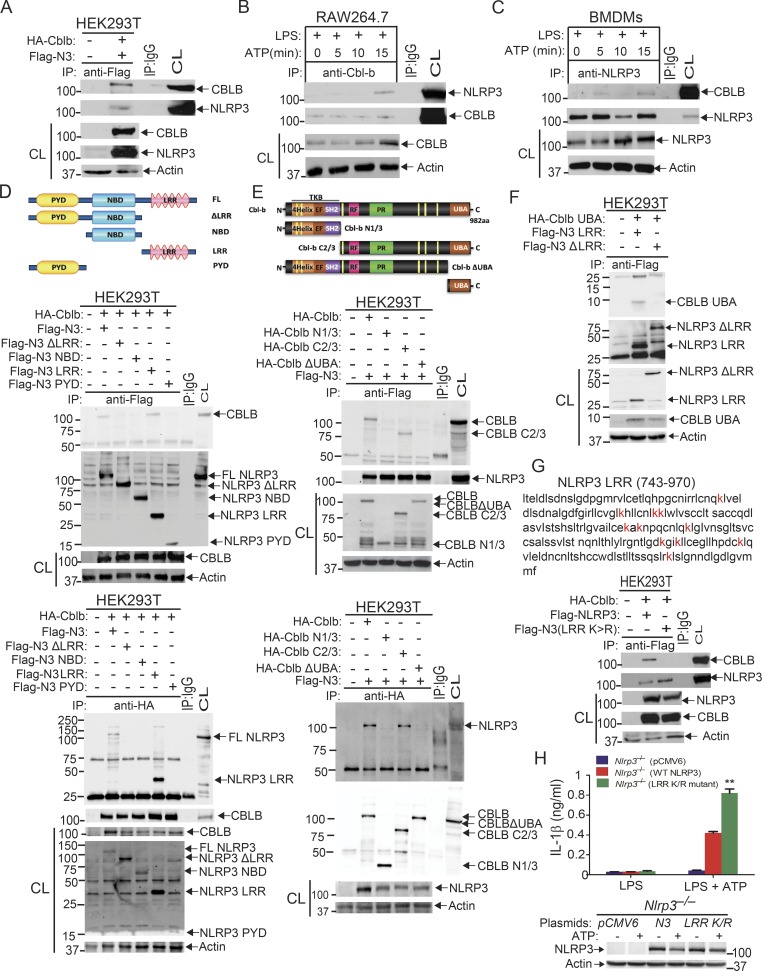
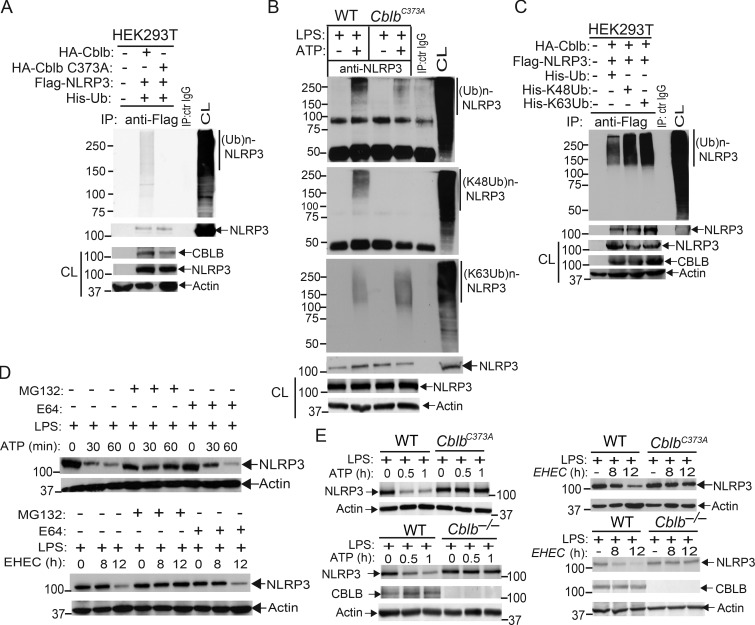
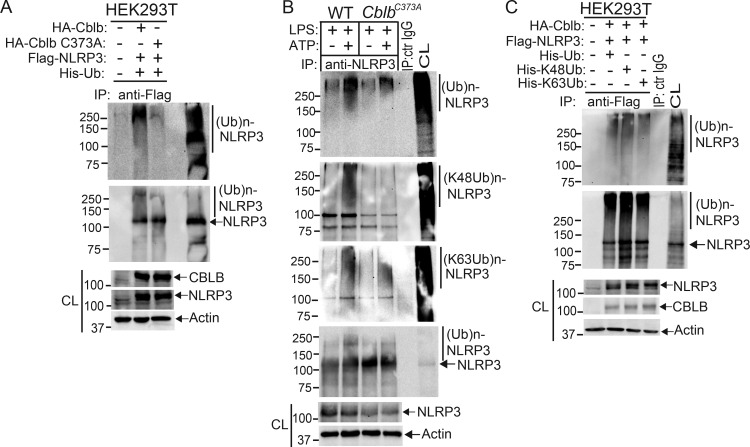
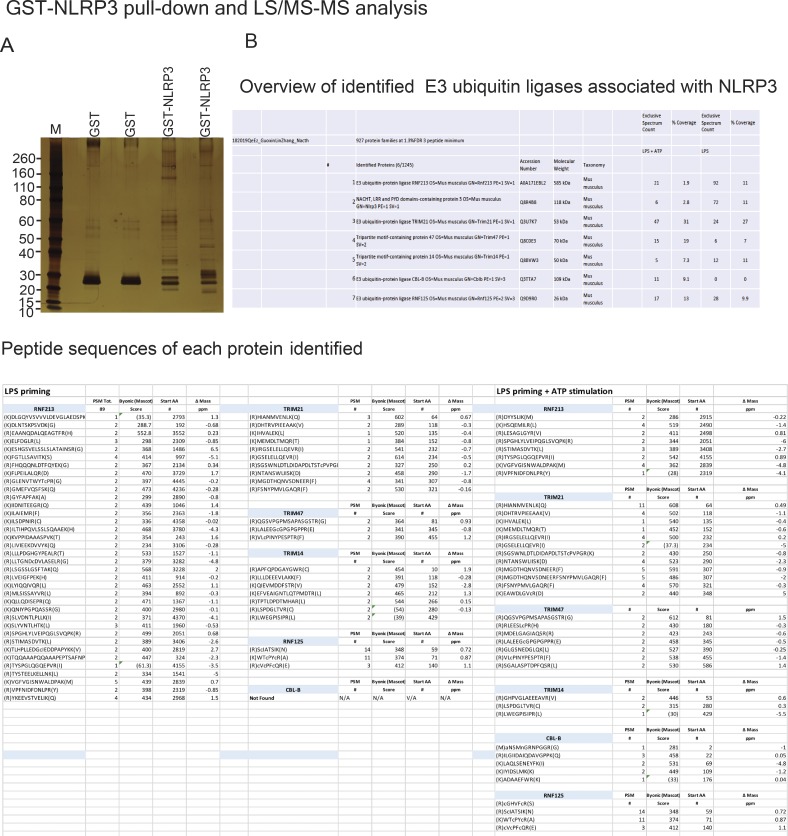
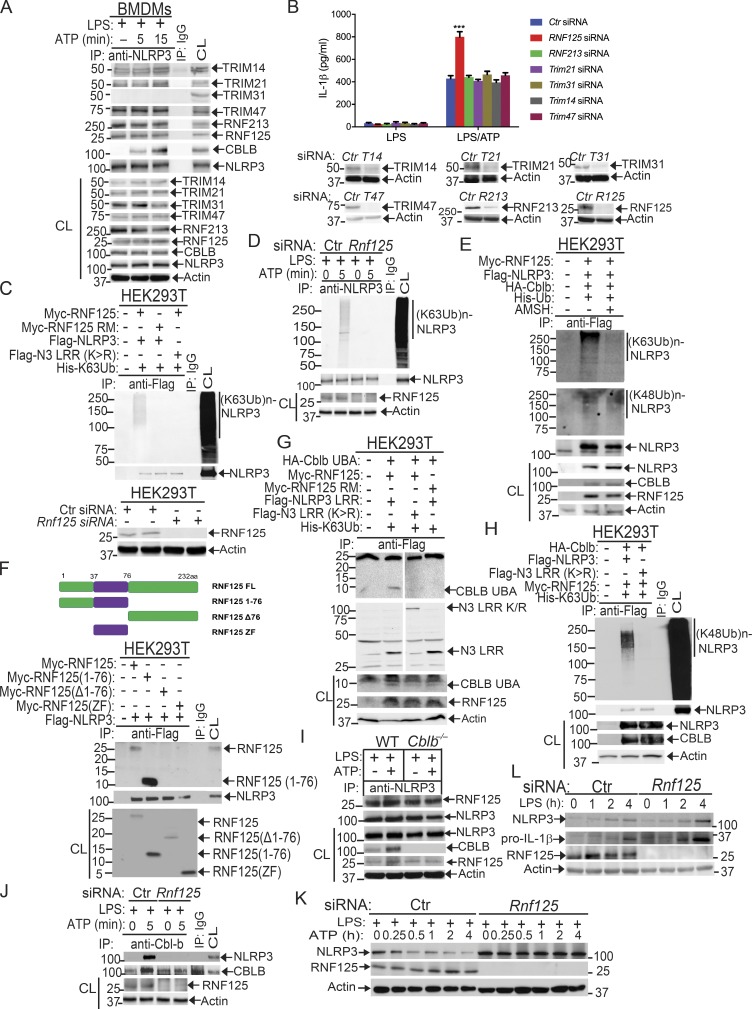
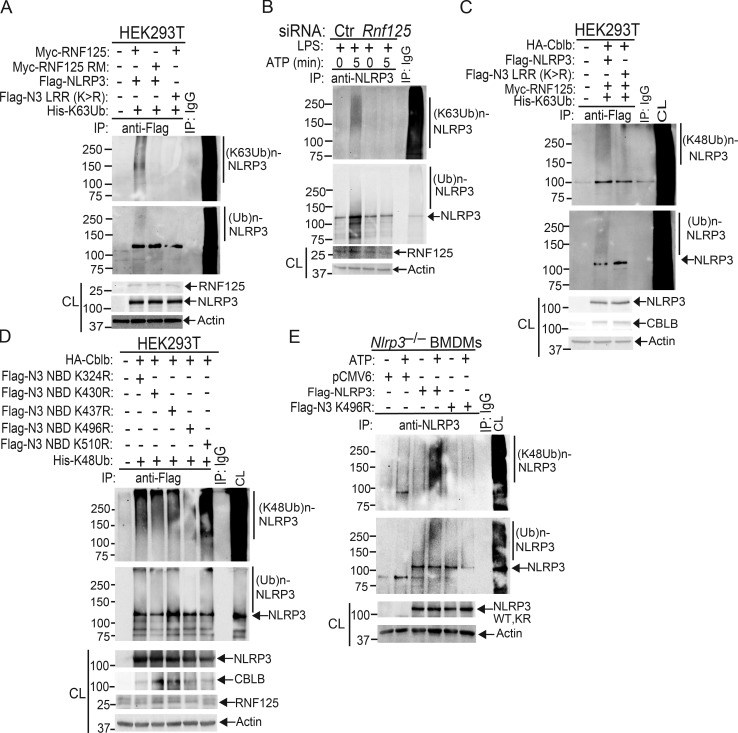
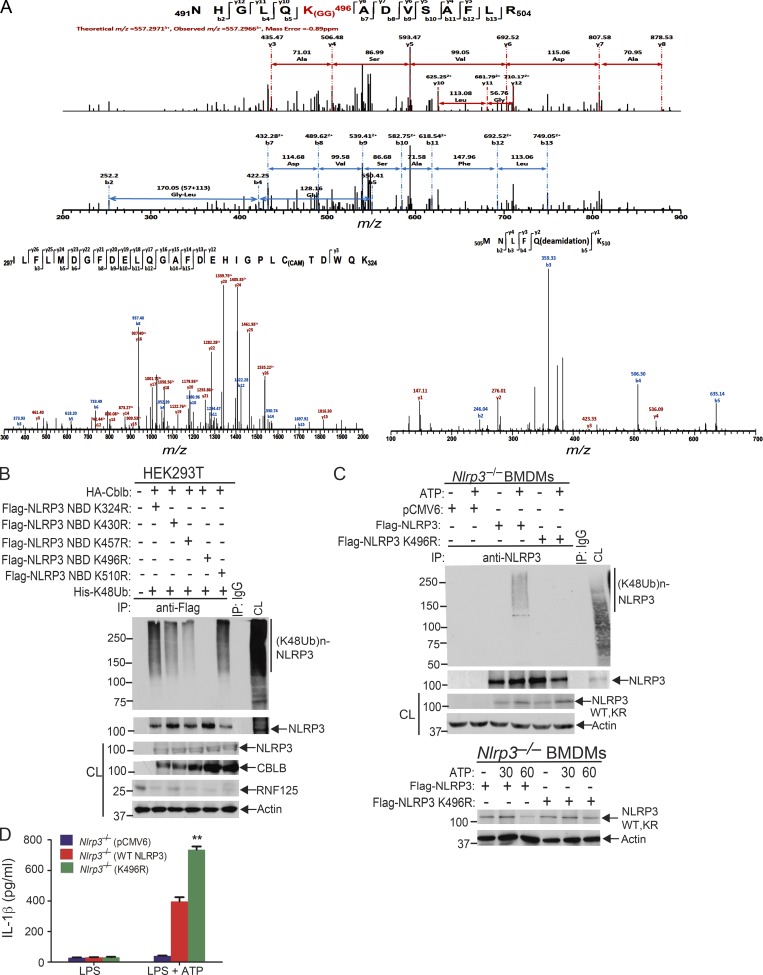
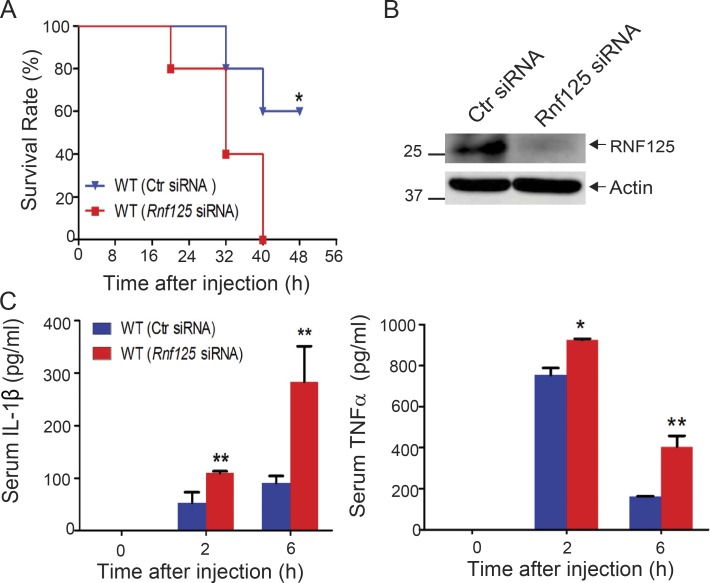
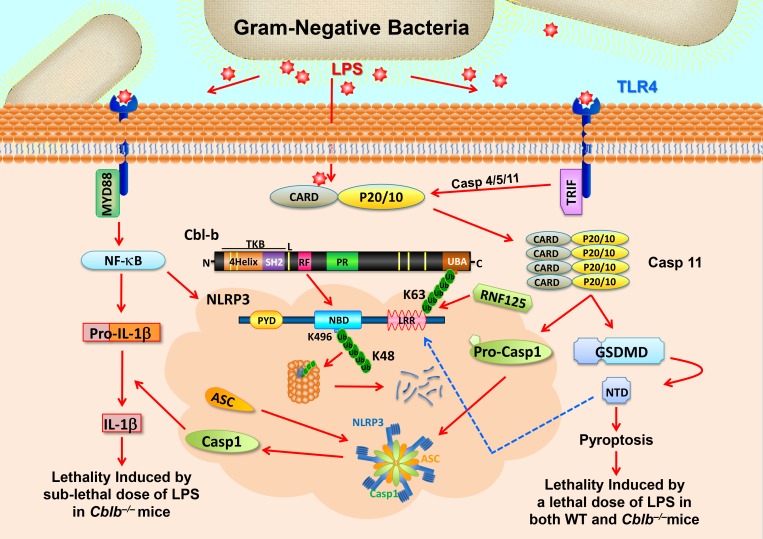
Aberrant NLRP3 inflammasome activation contributes to the development of endotoxemia. The importance of negative regulation of NLRP3 inflammasomes remains poorly understood. Here, we show that the E3 ubiquitin ligase Cbl-b is essential for preventing endotoxemia induced by a sub-lethal dose of LPS via a caspase-11/NLRP3-dependent manner. Further studies show that NLRP3 undergoes both K63- and K48-linked polyubiquitination. Cbl-b binds to the K63-ubiquitin chains attached to the NLRP3 leucine-rich repeat domain (LRR) via its ubiquitin-associated region (UBA) and then targets NLRP3 at K496 for K48-linked ubiquitination and proteasome-mediated degradation. We also identify RNF125 as an additional E3 ubiquitin ligase that initiates K63-linked ubiquitination of the NLRP3 LRR domain. Therefore, NLRP3 is sequentially ubiquitinated by K63- and K48-linked ubiquitination, thus keeping the NLRP3 inflammasomes in check and restraining endotoxemia.


Conflict of interest statement

Disclosures: The authors declare no competing interests exist.

Figures

Figure 1.
Figure 1.
Cbl-b selectively inhibits canonical and noncanonical NLRP3 inflammasomes. (A) TNF-α and IL-6 production by BMDMs from WT and Cblb−/− mice stimulated with TLR ligands for 24 h. Med, medium; CpG, CpG oligodeoxynucleotides. (B) Immunoblot analysis of TLR4, MyD88, and CBLB of WT and Cblb−/− BMDMs stimulated with LPS (500 ng/ml) at indicated time points. (C) Immunoblot analysis of phospho-IκBα, phospho-p65, NLRP3, pro–IL-1β, and NLRP3 of WT and Cblb−/− BMDMs stimulated with LPS at various time points. (D) IL-1β production by LPS-primed BMDMs stimulated with ATP (2.5 mM) for 30 min, nigericin (20 µM) for 3 h, CTB (40 µg/ml) for 16 h, anthrax LT (500 µg/ml) for 6 h, poly(dA:dT) (1 µg/106 cells) for 6 h, and flagellin (6.25 µg/106 cells) for 4 h. (E) Immunoblots of pro–Casp-1, pro–IL-1β, NLRP3, and CBLB expression in cell extracts and Casp-1 activation and IL-1β maturation in the supernatants of LPS-primed WT and Cblb−/− BMDMs stimulated with ATP (2.5 mM) for 30 min and CTB (40 µg/ml) for 16 h. CL, cell lysate; SN, supernatants. (F) IL-1β production by LPS-primed WT and Cblb−/− BMDMs after infection with EHEC (MOI = 25:1), P. aeruginosa (MOI = 30:1), and F. novicida (MOI = 100:1) for the indicated periods of time. (G) IL-1β production by LPS-primed BMDMs from WT, Cblb−/−, Nlrp3−/−, Cblb−/−Nlrp3−/−, Casp11−/−, and Cblb−/−Casp11−/− mice stimulated with ATP (2.5 mM) for 30 min or CTB (40 µg/ml) for 16 h or infected with EHEC (MOI = 25:1) for 12 h. (H) Lactate dehydrogenase (LDH) release from LPS-primed BMDMs from WT, Cblb−/−, Nlrp3−/−, Cblb−/−Nlrp3−/−, Casp11−/−, and Cblb−/Casp11−/ mice infected with EHEC (MOI = 25:1) for 12 h. Data are shown as mean ± SD. Data are representative of three independent experiments. **, P < 0.01; Student’s t test. p, phospho.
Figure S1.
Figure S1.
Silencing the CBLB gene in human macrophages leads to heightened IL-1β and TNF-α production upon LPS priming and stimulation with ATP, CTB, and EHEC. Related to Fig. 1. (A) ELISA analysis of IL-1β and TNF-α production by human MDMs transfected with control siRNA or CBLB-specific siRNA (200 nM) by using Lonza nucleofector reagent before priming with LPS (100 ng/ml) and stimulation with ATP (2.5 nM, 30 min), CTB (20 ng/ml, 6 h), and EHEC (MOI = 25:1, 8 h). Data are shown as mean ± SD. **, P < 0.01; Student’s t test. (B) Immunoblot analysis of CBLB in MDMs treated with control siRNA or CBLB-specific siRNA. Actin was used as a loading control. Data are representative of three independent experiments.
Figure 2.
Figure 2.
Loss of Cbl-b increases the susceptibility of mice to sub-lethal LPS-induced endotoxemia via a Casp-11/NLRP3–dependent manner. (A) Kaplan-Meier survival curve of WT and Cblb−/− mice injected with a sub-lethal dose of LPS (5 mg/kg) in the presence or absence of IL-1RA pretreatment. WT + LPS (n = 9), Cblb−/− + LPS (n = 10), and Cblb−/− + LPS/IL-1RA (25 mg/kg; n = 7). **, P < 0.01 (Cblb−/− + LPS vs. WT + LPS or Cblb−/− + LPS/IL-1RA); log-rank test. (B) ELISA of serum IL-1β, TNF-α, and IL-6 levels from WT and Cblb−/− mice injected with LPS (1 mg/kg) with or without IL-1RA pretreatment (n = 5). Data are shown as mean ± SD. **, P < 0.01 (WT + LPS vs. Cblb−/− + LPS); *, P < 0.05 (Cblb−/− + LPS vs. Cblb−/− + LPS/IL-1RA), Student’s t test. (C) Survival rate of WT and Cblb−/− mice undergoing sub-lethal CLP. CLP: WT (n = 8), Cblb−/− (n = 10); Sham: WT (n = 5), Cblb−/− (n = 5). **, P < 0.01 (WT CLP vs. Cblb−/− CLP); log-rank test. (D) Blood bacterial burden (CFU/ml) of WT (n = 5) and Cblb−/− mice (n = 5) undergoing sub-lethal CLP or Sham at 6 h after surgery. Data are represented as mean ± SEM. **, P < 0.01 (WT CLP vs. Cblb−/− CLP); by unpaired two-tailed Student’s t test. ELISA of serum IL-1β and IL-6 levels of WT and Cblb−/− mice undergoing sub-lethal CLP. Data are shown as mean ± SD. *, P < 0.05; **, P < 0.01; Student’s t test. (E) Kaplan-Meier survival rate of WT mice (n = 6) injected with LPS (5 mg/kg) or Cblb−/− mice (n = 6) pretreated with or without a neutralizing anti–TNF-α (50 µg/mouse) and then injected with LPS (5 mg/kg). *, P < 0.05; log-rank test. (F) ELISA of serum IL-1β, TNF-α, and IL-6 levels from WT mice (n = 6) injected with LPS (1 mg/kg) or Cblb−/− mice (n = 6) pretreated with or without a neutralizing anti–TNF-α (50 µg/mouse) and then injected with LPS (1 mg/kg). Data are shown as mean ± SD. *, P < 0.05; **, P < 0.01; Student’s t test. (G) Kaplan-Meier survival curve of WT, Cblb−/− and Nlrp3−/−, and Cblb−/−Nlrp3−/− mice injected with LPS (5 mg/kg; n = 5). **, P < 0.01 (Cblb−/− vs. Nlrp3−/− or Cblb−/−Nlrp3−/−); log-rank test. (H) ELISA of serum IL-1β, TNF-α, and IL-6 levels from WT, Cblb−/−, Nlrp3−/−, and Cblb−/−Nlrp3−/− mice injected with LPS (1 mg/kg) at 0, 2, 6, and 12 h (n = 5). Data are shown as mean ± SD. *, P < 0.05; **, P < 0.01 (Cblb−/−− vs. Nlrp3−/− or Cblb−/−Nlrp3−/−); Student’s t test. (I) Kaplan-Meier survival rate of WT (n = 5) and CblbC373A mice (n = 7) injected with LPS (5 mg/kg). **, P < 0.01; log-rank test. (J) Kaplan-Meier survival rate of WT, Cblb−/−, Nlrp3−/−−, Casp11−/− and Cblb−/−Nlrp3−/−, and Cblb−/−Casp11−/− mice (n = 5) injected with a lethal dose of LPS (54 mg/kg). **, P < 0.01 (Cblb−/− vs. Casp11−/− and Cblb−/−Casp11−/−); log-rank test. (K) Serum IL-1β levels detected after 20 mg/kg LPS injection in mice (n = 4) of the indicated genotypes at 12 h. Data are represented as mean ± SD. **, P < 0.01 (Cblb−/− vs. other groups); Student’s t test. Data are representative of three independent experiments (A–D and G, H, J, K) and representative of two independent experiments (E, F, and I). Ab, antibody.
Figure S2.
Figure S2.
Innate immune cells are essential for the hypersensitivity to a sub-lethal dose of LPS-induced endotoxemia in the absence of Cbl-b. Related to Fig. 2. (A) Survival rate of Rag1−/− and Rag1−/−Cblb−/− mice (n = 8 per group) after injection of LPS (2 mg/kg). **, P < 0.01; log-rank test. (B) Immunoblot analysis of lysates of T cells (T), B cells (B), and BMDMs (Mac) from LysM Cre (WT) and LysM Cre-Cblbf/f (KO) mice with antibodies against CBLB and actin. (C) Survival rate of LysM Cre and LysM Cre-Cblbf/f mice (n = 6 per group) after injection of LPS (5 mg/kg). **, P < 0.01; log-rank test. Data are representative of two independent experiments.
Figure 3.
Figure 3.
Cbl-b UBA region is required to form a complex with the NLRP3 LRR domain. (A) Immunoblot analysis of Flag immunoprecipitates (IP) of lysates from HEK293T cells transfected with Flag-tagged NLRP3 and HA-tagged Cbl-b. CL, cell lysate. (B) Immunoblot analysis of Cbl-b immunoprecipitates of lysates of RAW264.7 cells primed with LPS (100 ng/ml) for 4 h and stimulated with ATP (2.5 mM) for indicated time points. (C) Immunoblot analysis of NLRP3 immunoprecipitates of lysates of BMDMs primed with LPS and stimulated with ATP. (D) Immunoblot analysis of Flag or HA immunoprecipitates of lysates of HEK293T cells transfected with HA-tagged Cbl-b and Flag-tagged NLRP3 or NLRP3 mutants (NLRP3 ΔLRR, NBD, LRR, and PYD). (E) Immunoblot analysis of Flag or HA immunoprecipitates of lysates of HEK293T cells transfected with HA-tagged Cbl-b, Cbl-b N1/3, Cbl-b C2/3, or Cbl-b ΔUBA and Flag-tagged NLRP3. (F) Immunoblot analysis of Flag immunoprecipitates of lysates of HEK293T cells transfected with HA-tagged Cbl-b UBA together with NLRP3 LRR or NLRP3ΔLRR in the presence of MG132 (10 µM, overnight). (G) Immunoblot analysis of Flag immunoprecipitates of lysates of HEK293T cells transfected with HA-tagged Cbl-b together with Flag-tagged NLRP3 or NLRP3 LRR K/R mutant. (H) IL-1β production by Nlrp3−/− BMDMs reconstituted with Flag-tagged NLRP3 or NLRP3 LRR K/R mutant plasmid, primed with LPS, and stimulated with ATP for 30 min. n = 3 mice per group, each with three repeated wells. Error bars are mean ± SD. **, P < 0.01 (Nlrp3−/− BMDMs transfected with WT NLRP3 vs. with NLRP3 LRR K/R mutant) group; Student’s t test. Data are representative of three independent experiments. Actin was used as a loading control. CL, cell lysates from transfected HEK293T cells, WT BMDMs, or RAW264.7 cells.
Figure 4.
Figure 4.
Cbl-b targets NLRP3 for K48-linked polyubiquitination. (A) Anti-His immunoblot analysis of Flag immunoprecipitates (IP) of lysates from HEK293T cells transfected with Flag-tagged NLRP3, His-tagged ubiquitin, and HA-tagged Cbl-b or Cbl-b C373A. CL, cell lysate; ctr, control. (B) Anti-ubiquitin immunoblot analysis of NLRP3 immunoprecipitates of lysates from WT and CblbC373A BMDMs primed with LPS (100 ng/ml, 4 h) and stimulated with ATP (2.5 mM, 5 min) and reprobed with anti–K48-ubiquitin and anti–K63-ubiquitin. (C) Anti-His immunoblot analysis of Flag immunoprecipitates of lysates from HEK293T cells transfected with Flag-tagged NLRP3, HA-tagged Cbl-b together with His-tagged ubiquitin, His-tagged K48 ubiquitin, or His-tagged K63 ubiquitin. (D) NLRP3 immunoblot analysis of lysates from LPS-primed WT BMDMs pretreated with E-64 (10 µM) and MG-132 (5 µM) for 30 min and then stimulated with ATP or infected with EHEC for indicated time points. (E) NLRP3 and Cbl-b immunoblot analysis of lysates from WT and CblbC373A or Cblb−/− BMDMs primed with 100 ng/ml LPS for 4 h and then stimulated with ATP or infected with EHEC for various time points. Data are representative of three independent experiments.
Figure S3.
Figure S3.
Verification of Cbl-b as the E3 ubiquitin ligase that initiates K48-linked polyubiquitination of NLRP3. Related to Fig. 4. (A) Anti-His and anti-Flag immunoblot analysis of Flag immunoprecipitates (IP) of lysates from HEK293T cells transfected with Flag-tagged NLRP3, His-tagged ubiquitin, and HA-tagged Cbl-b or Cbl-b C373A under the denaturing condition by heating to 95°C for 10 min. CL, cell lysate. (B) Anti-ubiquitin and anti-NLRP3 immunoblot analysis of NLRP3 immunoprecipitates of lysates from WT and CblbC373A BMDMs primed with LPS (100 ng/ml, 4 h) and stimulated with ATP (2.5 mM, 5 min) and reprobed with anti–K48 ubiquitin and anti–K63 ubiquitin under the denaturing condition. (C) Anti-His and anti-Flag immunoblot analysis of Flag immunoprecipitates of lysates from HEK293T cells transfected with Flag-tagged NLRP3 and HA-tagged Cbl-b together with His-tagged ubiquitin, His-tagged K48 ubiquitin, or His-tagged K63 ubiquitin under the denaturing condition. Ctr, control. Data are representative of three independent experiments (A) and representative of two independent experiments (B and C).
Figure S4.
Figure S4.
Identification of E3 ubiquitin ligases that bind to NLRP3. Related to Fig. 5. (A) Silver staining of GST or GST-NLRP3–binding proteins eluted from lysates of B6 BMDMs primed with LPS and stimulated with ATP for 5 min. (B) LC-MS/MS analysis of GST-NLRP3–binding E3 ubiquitin ligases eluted from lysates of B6 BMDMs primed with LPS and stimulated with ATP, captured, and trypsin digested. The top six hits were selected from three independent experiments.
Figure 5.
Figure 5.
Identification of RNF125 as an additional E3 ubiquitin ligase that initiates K63-linked polyubiquitination of NLRP3. (A) Immunoblot analysis of NLRP3 immunoprecipitates (IP) and total cell lysates (CL) from WT BMDMs primed with LPS and stimulated with ATP (2.5 mM) for 5 and 15 min with antibodies against TRIM14, TRIM21, TRIM31, TRIM47, RNF125, RNF213, CBLB, and NLRP3. (B) IL-1β production by BMDMs from WT mice (n = 3) that were transfected with siRNAs specific for Trim14, Trim21, Trim31, Trim47, Rnf125, and Rnf213, primed with LPS, and stimulated with ATP. Data are represented as mean ± SD.P < 0.001 (Rnf125 siRNA-transfected BMDMs vs. other siRNA-transfected BMDMs); Student's t test. Cell lysates from the above BMDMs were blotted with antibodies against TRIM14, TRIM21, TRIM31, TRIM47, RNF125, RNF213, and actin. Ctr, control. (C) Anti-His immunoblot analysis of Flag immunoprecipitates of lysates from Rnf125 gene-silenced HEK293T cells transfected with Flag-tagged NLRP3 or NLRP3 LRR (K>R), Myc-tagged RNF125, or Myc-RNF125 RM mutant together with His-tagged K63 ubiquitin. (D) Anti-K63 ubiquitin immunoblot analysis of NLRP3 immunoprecipitates of lysates from WT BMDMs transfected with Rnf125 siRNA or a control siRNA, primed with LPS, and stimulated with ATP. (E) Anti-K63 and K48 immunoblot analysis of Flag immunoprecipitates of lysates from HEK293T cells transfected with Flag-tagged NLRP3, HA-tagged Cbl-b, Myc-RNF125, and His-tagged ubiquitin treated with or without AMSH. (F) Anti-Myc immunoblot analysis of Flag immunoprecipitates of lysates from HEK293T cells transfected with Myc-tagged RNF125, RNF125 (1–76), RNF125 (Δ1-76), or RNF126 (ZF), together with Flag-tagged NLRP3. (G) Anti-HA immunoblot analysis of Flag immunoprecipitates of lysates from HEK293T cells transfected with Flag-tagged NLRP3 LRR or NLRP3 LRR (K/R) mutant, HA-tagged Cbl-b UBA, Myc-RNF125 or RNF125 RM, and His-tagged K63 ubiquitin in the presence of MG132 (10 µM, overnight). (H) Anti–K48-ubiquitin immunoblot of Flag immunoprecipitates of lysates from HEK293T cells transfected with Flag-tagged NLRP3 or NLRP3 LRR (K/R) mutant, HA-tagged Cbl-b, Myc-RNF125, and His-tagged K63 ubiquitin. (I) Anti-RNF125 immunoblot analysis of NLRP3 immunoprecipitates of lysates from WT and Cblb−/− BMDMs that were primed with LPS and stimulated with ATP. (J) Anti-NLRP3 immunoblot analysis of Cbl-b immunoprecipitates of lysates from WT BMDMs transfected with Rnf125 siRNA or a control siRNA, primed with LPS, and stimulated with ATP. (K) Anti-NLRP3 and anti-RNF125 immunoblot analysis of lysates from WT BMDMs transfected with Rnf125 siRNA or a control siRNA, primed with LPS, and stimulated with ATP. (L) Anti-NLRP3 and anti–pro-IL-1β immunoblot analysis of WT BMDMs transfected with Rnf125 siRNA or a control siRNA, primed with LPS for 1, 2, and 4 h. Data are representative of three independent experiments. Actin was used as a loading control.
Figure S5.
Figure S5.
Verification of RNF125 as an additional E3 ubiquitin ligase to initiate K63-linked polyubiquitination of NLRP3 and confirmation of K496 as the ubiquitination site of NLRP3. Related to Figs. 5 and 6. (A) Anti-His and anti-Flag immunoblot analysis of Flag immunoprecipitates (IP) of lysates from Rnf125 gene–silenced HEK293T cells transfected with Flag-tagged NLRP3 or NLRP3 LRR (K>R), Myc-tagged RNF125, or Myc-RNF125 RM mutant together with His-tagged K63 ubiquitin under the denaturing condition. CL, cell lysate. (B) Anti-K63 ubiquitin and anti-NLRP3 immunoblot analysis of NLRP3 immunoprecipitates of lysates from WT BMDMs transfected with Rnf125 siRNA or a control (Ctr) siRNA, primed with LPS, and stimulated with ATP under the denaturing condition. (C) Anti–K48-ubiquitin and anti-Flag immunoblot of Flag immunoprecipitates of lysates from HEK293T cells transfected with Flag-tagged NLRP3 or NLRP3 LRR (K/R) mutant, HA-tagged Cbl-b, Myc-RNF125, and His-tagged K63 ubiquitin under the denaturing condition. (D) Anti-His and anti-Flag immunoblot analysis of Flag immunoprecipitates of lysates from HEK293T cells transfected with HA-tagged Cbl-b and His-tagged K48 ubiquitin together with Flag-tagged NLRP3 K/R mutants (K324R, K430R, K437R, K496R, and K510R) under the denaturing condition. (E) Anti–K48 ubiquitin and anti-NLRP3 immunoblot analysis of NLRP3 immunoprecipitates of lysates from Nlrp3−/− BMDMs reconstituted with pCMV6, Flag-tagged NLRP3, or NLRP3 K496R plasmid under the denaturing condition (upper panel). Anti-NLRP3 and anti-actin immunoblots of lysates from Nlrp3−/− BMDMs reconstituted with Flag-tagged NLRP3 or NLRP3 K496R plasmid, primed with LPS, and stimulated with ATP under the denaturing condition (lower panel). Data are representative of two independent experiments (A, B, C, and E) and representative of three independent experiments (D).
Figure 6.
Figure 6.
Lysine 496 is the site for the attachment of K48-linked ubiquitin chains to NLRP3. (A) Mass spectrometric analysis of Flag-tagged NLRP3 showed that K496 [491NHGLQK(GG)496ADVSAFLR504] was ubiquitinated. (B) Anti-His immunoblot analysis of Flag immunoprecipitates (IP) of lysates from HEK293T cells transfected with HA-tagged Cbl-b and His-tagged K48 ubiquitin together with Flag-tagged NLRP3 lysine (K)/arginine (R) mutants (K324R, K430R, K437R, K496R, and K510R). CL, cell lysate. (C) Anti-K48 ubiquitin immunoblot analysis of NLRP3 immunoprecipitates of lysates from Nlrp3−/− BMDMs reconstituted with pCMV6, Flag-tagged NLRP3, or NLRP3 K496R plasmid (upper panel). Anti-NLRP3 and anti-actin immunoblots of lysates from Nlrp3−/− BMDMs reconstituted with Flag-tagged NLRP3 or NLRP3 K496R plasmid, primed with LPS, and stimulated with ATP (lower panel). (D) IL-1β production by BMDMs from Nlrp3−/− mice (n = 3) reconstituted with Flag-tagged NLRP3 or NLRP3 K496R plasmid, primed with LPS, and stimulated with ATP for 30 min. Data are represented as mean ± SD. **, P < 0.01 (Nlrp3−/− BMDMs transfected with WT NLRP3 vs. with NLRP3 K496R); Student’s t test. Data are representative of two independent experiments (A) and representative of three independent experiments (B–D).
Figure 7.
Figure 7.
Systemic in vivo delivery of Rnf125-specific siRNA renders mice susceptible to endotoxemia induced by a sub-lethal dose of LPS. (A) Kaplan-Meier survival curve of C57BL/6 mice treated with in vivo–grade Rnf125-specific siRNA or a nonsense siRNA (2 mg/kg/mouse) via tail vein injection for 24 h before LPS injection (5 mg/kg). *, P < 0.05 by log-rank test. (B) Immunoblot analysis for RNF125 in spleen cells from C57BL/6 mice that were treated with the control siRNA or Rnf125-specific siRNA. Actin was used as a loading control (Ctr). (C) Serum IL-1β and TNF-α levels from C57BL/6 mice (five mice per group) that were treated with the control siRNA or Rnf125-specific siRNA before LPS injection (1 mg/kg). Data are shown as mean ± SD. *, P < 0.05; **, P < 0.01; Student’s t test. Data are representative of three independent experiments (A and C) and representative of two independent experiments (B).
Figure 8.
Figure 8.
Schematic model for RNF125 and Cbl-b in LPS-induced endotoxemia. When mice receive a sub-lethal dose of LPS, LPS triggers (1) TLR4 to initiate a MyD88-dependent signaling pathway, which activates NF-κB and induces the expression of NLRP3 and pro–IL-1β and (2) TRIF-dependent pathway that induces the expression of Casp-11. LPS also undergoes endocytosis and binds its cytosolic sensor Casp-11 to induce oligomerizations of Casp-11, which cleaves GSDMD to liberate its N-terminal domain (NTD). NTD may trigger the activation of the NLRP3 inflammasome, leading to the release of IL-1β without inducing pyroptosis. RNF125 targets the NLRP3 LRR domain for K63-linked polyubiquitination. The K63 ubiquitin chains attached to the NLRP3 LRR domain recruit Cbl-b by binding its UBA region. Cbl-b then ubiquitinates NLRP3 at K496 within its NBD and targets NLRP3 to the proteasome for degradation, thus keeping the NLRP3 inflammasome in check. In the absence or inactivation of Cbl-b, mice are highly susceptible to LPS-induced endotoxemia. However, when mice receive a lethal dose of LPS exposure, LPS binds to Casp-11 and mainly triggers Casp-11–mediated pyroptosis via GSDMD. Cbl-b is unable to control this noncanonical inflammasome-induced lethality. CARD, caspase recruitment domain; PYD, pyrin domain; TKB; protein tyrosine kinase-binding; L, linker region; RF, Ring finger; P, peptide; PR, proline-rich region; Toll/IL‐1R domain–containing adaptor‐inducing IFN‐β. Red arrows indicate activation or induction, whereas the blue dashed arrow indicates possible activation.

References

    1. Angus D.C., Linde-Zwirble W.T., Lidicker J., Clermont G., Carcillo J., and Pinsky M.R.. 2001. Epidemiology of severe sepsis in the United States: analysis of incidence, outcome, and associated costs of care. Crit. Care Med. 29:1303–1310. 10.1097/00003246-200107000-00002 - DOI - PubMed
    1. Bachmaier K., Krawczyk C., Kozieradzki I., Kong Y.Y., Sasaki T., Oliveira-dos-Santos A., Mariathasan S., Bouchard D., Wakeham A., Itie A., et al. . 2000. Negative regulation of lymphocyte activation and autoimmunity by the molecular adaptor Cbl-b. Nature. 403:211–216. 10.1038/35003228 - DOI - PubMed
    1. Bachmaier K., Toya S., Gao X., Triantafillou T., Garrean S., Park G.Y., Frey R.S., Vogel S., Minshall R., Christman J.W., et al. . 2007. E3 ubiquitin ligase Cblb regulates the acute inflammatory response underlying lung injury. Nat. Med. 13:920–926. 10.1038/nm1607 - DOI - PubMed
    1. Bell B.L., Mohapatra N.P., and Gunn J.S.. 2010. Regulation of virulence gene transcripts by the Francisella novicida orphan response regulator PmrA: role of phosphorylation and evidence of MglA/SspA interaction. Infect. Immun. 78:2189–2198. 10.1128/IAI.00021-10 - DOI - PMC - PubMed
    1. Bosmann M., and Ward P.A.. 2013. The inflammatory response in sepsis. Trends Immunol. 34:129–136. 10.1016/j.it.2012.09.004 - DOI - PMC - PubMed

Publication types

MeSH terms