. 2020 Mar 2;219(3):e201907013.
doi: 10.1083/jcb.201907013.

Spatiotemporal control of phosphatidic acid signaling with optogenetic, engineered phospholipase Ds

Affiliations

Spatiotemporal control of phosphatidic acid signaling with optogenetic, engineered phospholipase Ds

Reika Tei et al. J Cell Biol. .

Abstract

Phosphatidic acid (PA) is both a central phospholipid biosynthetic intermediate and a multifunctional lipid second messenger produced at several discrete subcellular locations. Organelle-specific PA pools are believed to play distinct physiological roles, but tools with high spatiotemporal control are lacking for unraveling these pleiotropic functions. Here, we present an approach to precisely generate PA on demand on specific organelle membranes. We exploited a microbial phospholipase D (PLD), which produces PA by phosphatidylcholine hydrolysis, and the CRY2-CIBN light-mediated heterodimerization system to create an optogenetic PLD (optoPLD). Directed evolution of PLD using yeast membrane display and IMPACT, a chemoenzymatic method for visualizing cellular PLD activity, yielded a panel of optoPLDs whose range of catalytic activities enables mimicry of endogenous, physiological PLD signaling. Finally, we applied optoPLD to elucidate that plasma membrane, but not intracellular, pools of PA can attenuate the oncogenic Hippo signaling pathway. OptoPLD represents a powerful and precise approach for revealing spatiotemporally defined physiological functions of PA.


Figures

Figure S1.
Figure S1.
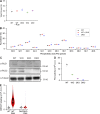
Characterization of PA levels, PLD levels, and PLD activity in PLD-deficient HEK 293T cells. (A and B) Quantification of PA levels in PLD-deficient HEK 293T cells. Lipid extracts from HEK 293T cells of the indicated genotype (DKO, PLD1/2 DKO; 1KO, PLD1 knockout; 2KO, PLD2 knockout) or WT cells treated with the PLD inhibitor (PLDi; 5-fluoro-2-indolyl des-chlorohalopemide, 750 nM for 1 h) were analyzed by electrospray ionization–time-of-flight MS, monitoring in negative mode, to determine levels of total PA (A) or individual PA species, indicated by number of carbons/number of double bonds in the combined acyl tails (B). Levels of total PA in each sample were normalized to phosphatidylinositol, which is a more abundant negatively charged lipid within the same sample. Horizontal bars indicate mean from three biological replicates, each of which was performed in technical triplicate. (C–E) Characterization of PLD levels and activity in PLD-knockout cell lines. (C) Western blot analysis of WT, PLD1 knockout (1KO), PLD2 knockout (2KO), and PLD1/2 DKO, probing for PLD1, PLD2, or tubulin as a loading control. (D) Quantification of PLD activity in the above cell lines using IMPACT. Cells were treated with 5 mM AzProp for 40 min, followed by lipid extraction and click chemistry tagging of azide-labeled transphosphatidylation products with BCN-BODIPY. The samples were analyzed by fluorescence-coupled HPLC. Horizontal bars indicate mean from three biological replicates. (E) Flow cytometry analysis of IMPACT-labeled WT or PLD DKO HEK 293T cells treated with or without PMA. Cells were treated with 1 mM AzProp with or without 750 nM PMA for 30 min and then tagged with BCN-BODIPY for 10 min. The cells were then trypsinized and analyzed by flow cytometry. Shown are violin plots of IMPACT-derived fluorescence, where white circles indicate mean and black boxes indicate 25 to 75% range. n = 6,000 cells analyzed per sample in the violin plot.
Figure 1.
Figure 1.
Design of an optoPLD for the spatiotemporal control of PA production. (A) Schematic depicting the design of optoPLD. A single plasmid encodes two chimeric proteins linked via a self-cleaving P2A peptide: (1) a fusion of CRY2, mCherry, and PLDPMF; and (2) a fusion of CIBN to an organelle targeting tag. Upon expression of optoPLD in cells, CRY2–CIBN heterodimerization induced by blue light (488 nm) causes recruitment of PLDPMF to the desired membrane. (B) Confocal images showing recruitment of optoPLD to different organelle membranes in HEK 293T cells. Shown is the CRY2-mCherry-PLDPMF localization before and after illumination with 488-nm light (five cycles of 2 s on, 2 s off). Scale bars: 10 µm. (C) Reversibility of optoPLD recruitment. HEK 293T cells were transfected with a version of optoPLD wherein PM-targeted CIBN is fused to iRFP, and colocalization of mCherry (PLDPMF) and iRFP (PM) fluorescence was analyzed by confocal microscopy, with the relative change in Pearson correlation coefficient (calculated as (rrmin)/(rmaxrmin), where r is the Pearson correlation coefficient) plotted against time. CRY2–CIBN heterodimerization was induced by brief illumination with 488-nm light (six cycles of 2 s on, 8 s off in the first minute), as indicated by the blue vertical lines, and the dissociation of PLDPMF from the PM in the absence of blue light was observed over 30 min. Black line indicates mean (n = 7) and gray area indicates standard deviation.
Figure S2.
Figure S2.
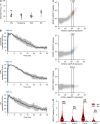
Characterization and optimization of optoPLD. (A and B) Characterization of optoPLD recruitment properties and association/dissociation kinetics in HEK 293T cells. (A) Percentage of optoPLD that is recruited to different organelle membranes in HEK 293T cells after illumination with 488 nm light (six cycles of 2 s on, 8 s off). HEK 293T cells were cotransfected with the indicated optoPLD and iRFP-tagged organelle marker, which were generated by fusing iRFP to the same organelle-targeting tag used for optoPLD; i.e., PM: iRFP-CAAX; Endosome: iRFP-2xFYVE; TGN: iRFP-sialyltransferase(transmembrane domain); ER: iRFP-Sac1(transmembrane domain). After confocal microscopy imaging, the percentage of mCherry fluorescence appearing in iRFP-positive pixels was determined in ImageJ. Black horizontal bars indicate mean (n = 6–8) and vertical error bars indicate standard deviation. (B) Reversibility of optoPLD recruitment. Cells from A were analyzed by confocal microscopy, with the relative change in Pearson correlation coefficient (calculated as (r rmin)/(rmax rmin), where r is Pearson correlation coefficient) plotted against time. CRY2–CIBN heterodimerization was induced by brief illumination with 488-nm light (six cycles of 2 s on, 8 s off), as indicated by blue vertical bars, and the dissociation of PLDPMF from the organelle membrane was observed over the following 30 min. Black lines indicate mean (n = 5–7), and gray areas indicate standard deviation. (C and D) Optimization of optoPLD constructs using two-color flow cytometry analysis. (C) Two-color flow cytometry analysis of PLD DKO HEK 293T cells expressing PM-targeted optoPLD (the CRY2-mCherry-PLDPMF version). Cells were labeled via IMPACT by incubation with AzProp (2 mM) in the presence or absence of blue light (5-s illumination every 2 min for 40 min), followed by rinsing and click chemistry tagging with BCN-BODIPY (1 µM; 10 min followed by 10-min rinse at 37°C) and analysis by two-color flow cytometry, with PLD activity quantified in the IMPACT (green) channel and total optoPLD levels in the mCherry (red) channel. The indicated subpopulations with similar mCherry levels (1–2 × 10³ fluorescence units, indicated by the black rectangle) were extracted for data analysis in all flow cytometry experiments to analyze PLD activity. (D) Comparison of IMPACT labeling intensities in PLD DKO HEK 293T cells transfected with PM-targeted optoPLD constructs containing either CRY2-mCherry-PLDPMF (C-m-P), mCherry-CRY2-PLDPMF (m-C-P), PLDPMF-mCherry-CRY2 (P-m-C), or mCherry-PLDPMF-CRY2 (m-P-C; and all expressing CIBN-CAAX separated by a P2A peptide), and labeled via IMPACT as described in C. Shown are violin plots of extracted cells with similar mCherry levels, where white circles indicate mean, black boxes indicate 25 to 75% range, and signal-to-noise (S/N) for ±488-nm light is indicated. Note that P-m-C exhibits the strongest labeling, but the signal-to-noise ratio was highest for C-m-P. n = 500–600 cells per experiment; shown is a representative biological experiment that was repeated three times.
Figure 2.
Figure 2.
A fluorescent PA biosensor reveals optoPLD-dependent PA production on different organelle membranes. HEK 293T cells cotransfected in serum-free media with a PA-binding probe (GFP-PASS) and either optoPLD (PLD, left) or the catalytically dead optodPLD (dPLD, right) targeted to the PM, endosomes, TGN, or ER were imaged via confocal microscopy after 30 min of intermittent 488-nm blue light illumination (5-s pulses every 2 min). Green, GFP-PASS; magenta, optoPLD fluorescence. Colocalization appears as white in the merged images. Scale bars: 10 µm.
Figure S3.
Figure S3.
Time course of changes in PA sensor localization induced by optoPLD activation and inactivation. Visualization of the kinetics of PA production by optoPLD in HEK 293T cells using a PA-binding probe (iRFP-PASS). Cells cotransfected in serum-free media with iRFP-PASS and the indicated optoPLD were incubated with 488-nm light (+ light; 5-s illumination every 2 min) for 0–20 min, and then, after the 20-min time point, kept in the dark (− light) for 0–3 h. At each of the indicated time points, iRFP (PA-binding probe) and mCherry (optoPLD) fluorescence were analyzed by confocal microscopy. Scale bars: 10 µm.
Figure 3.
Figure 3.
Visualization and quantification of optoPLD activity using IMPACT. (A) Schematic depicting IMPACT. Cells expressing PLDs are treated with AzProp to produce azido phosphatidyl alcohol lipids via transphosphatidylation. The lipids are then tagged with functional probes via a click chemistry reaction, which can be performed in lipid extracts with BCN-BODIPY or Alk-QA for, respectively, fluorescence-coupled HPLC or LC–MS analysis or in live cells for flow cytometry analysis. (B) Acyl chain compositions of individual phosphatidyl alcohol species produced by IMPACT of either endogenous, human PLDs in WT HEK 293T cells (black) or organelle-targeted optoPLDs in PLD1/2 DKO HEK 293T cells (red, PM; blue, endosomes; green, ER), analyzed by LC–MS. For analysis of endogenous PLD activity, WT HEK 293T cells were treated with AzProp (5 mM) for 40 min, followed by lipid extraction, click chemistry tagging with Alk-QA, and LC–MS analysis. For analysis of products of optoPLD activity, the same protocol was used except in PLD DKO HEK 293T cells expressing the indicated optoPLD and illuminated with 488-nm light during the AzProp labeling step (5-s illumination every 2 min for 40 min). Species with abundance <1% are not shown. Horizontal bars indicate mean from three biological replicates, each of which was performed in technical triplicate. (C) Flow cytometry analysis of IMPACT-labeled PLD DKO HEK 293T cells expressing optoPLDs targeted to different organelle membranes shows light-dependent PLD activity. Cells expressing the indicated optoPLD were treated with AzProp (2 mM) for 40 min either with or without blue light (5-s illumination every 2 min) and then tagged with BCN-BODIPY for 10 min. The cells were then trypsinized and analyzed by flow cytometry. Shown are violin plots of IMPACT-derived fluorescence from the population of cells expressing similar levels of optoPLD (based on mCherry fluorescence; see also Fig. S2 C; n = 550 cells analyzed per sample in the violin plot). Shown is a representative example biological experiment, which was repeated three times. ***, P < 0.001.
Figure 4.
Figure 4.
Directed evolution of a panel of optoPLDs with ranging activities. (A) Schematic depicting yeast membrane display-based directed evolution platform for discovery of PLD mutants (PLD#) with altered catalytic activities. PM-localized PLD# expression is induced by treatment of cells harboring a fusion of PLD# to 2xPLCδPH under an inducible promoter (PM-PLD#) with β-estradiol. Cells are fluorescently labeled using IMPACT via treatment with AzProp, fixation, and BCN-BODIPY tagging. Subsequent FACS selection is used to enrich cells expressing PM-PLD# with desired activities, followed by plasmid extraction and amplification of PLD# with further mutagenesis by error-prone PCR (EP-PCR) and cloning and transformation into yeast for subsequent rounds of selection. (B) IMPACT labeling of yeast expressing PM-PLD. Yeast cells harboring PM-PLD# were treated with or without β-estradiol for 3 h, treated with AzProp (10 mM) for 1 h, fixed with formaldehyde, tagged via click chemistry with BCN-BODIPY (1 µM) for 30 min, and imaged by confocal microscopy. Green shows IMPACT-derived fluorescence, and magenta shows PLD-derived fluorescence from its mCherry tag. Scale bars: 5 µm. (C) Flow cytometry analysis of IMPACT-labeled yeast expressing a catalytically dead PM-dPLD, PM-PLD, or a typical PM-PLD# library. n = 360 cells analyzed per sample in the violin plot. (D) PLD# mutants identified by directed evolution were cloned into PM-targeted optoPLD to generate optoPLD#s (violet) and expressed in PLD DKO HEK 293T cells. Their activities were quantified by IMPACT labeling followed by flow cytometry (performed as described in Fig. 3 C) and compared with WT optoPLD (red) and catalytically dead optodPLD (gray). As a comparison, the levels of endogenous, human PLD (hPLD) activity in WT HEK 293T cells are shown in the absence (basal) or presence (PMA) of strong stimulation with PMA (tan). See also Fig. S2 C for strategy to account for equal optoPLD expression levels. In this case, IMPACT was performed as in Fig. 3 C, except that the transphosphatidylation step involved treatment of cells with 2 mM AzProp in the absence of any 488-nm light illumination for 30 min in the presence of either DMSO control (basal) or 750 nM PMA stimulation. n = 820 cells analyzed per sample in the violin plot. Shown is a representative example biological experiment, which was repeated three times. *, P < 0.05; **, P < 0.01; ***, P < 0.001.
Figure S4.
Figure S4.
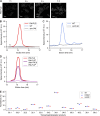
Characterization of PM-targeted PLD in yeast. (A) Live-cell confocal microscopy imaging of S. cerevisiae harboring a plasmid encoding PM-targeted PLD (PLDPMF-mCherry-2xPLCδPH) under the control of the chimeric transcriptional activator Gal4dbd.ER.VP16 (GEV) and treated with β-estradiol (200 nM) for the indicated time to induce PLD expression. Shown is mCherry fluorescence. Scale bars: 5 µm. (B and C) Use of IMPACT, followed by fluorescence-coupled HPLC analysis, to quantify endogenous PLD activity in yeast due to Spo14 and exogenous PLD activity due to expression of PM-PLD. The indicated yeast populations (PM-PLD indicates WT yeast expressing PM-PLD) were labeled by IMPACT by incubation with AzProp (50 mM) for 1 h followed by lipid extraction and click chemistry tagging with BCN-BODIPY (1 µM) and HPLC analysis of the transphosphatidylation products. The curve in C indicates the zoomed-in region in B to show the very low but detectable extent of endogenous PLD activity due to the yeast PLD, Spo14. (D) Verification that yeast membrane display directed evolution system enriches PLD variants with desired activity. Shown are representative HPLC traces from yeast populations expressing either PM-PLD (WT PLD), the PM-PLD# library of PLD variants generated by error-prone PCR before IMPACT labeling and FACS enrichment, or the subset of FACS-enriched members of the PM-PLD# library. Note the substantial increase in PLD activity of the enriched mixed PM-PLD# population afforded by the IMPACT-based FACS enrichment strategy. Samples for HPLC analysis were generated as in B and C. (E) Acyl chain compositions of individual phosphatidyl alcohol species produced by IMPACT of different optoPLD#s in PLD DKO HEK 293T cells (black, WT; blue, K294M; and red, G429D), analyzed by LC–MS. The cells were treated with AzProp (5 mM) for 40 min with 488-nm light (5-s illumination every 2 min for 40 min), followed by lipid extraction, click chemistry tagging with Alk-QA, and LC–MS analysis. Species with abundance <1% are not shown. Horizontal bars indicate mean from three biological replicates, each of which was performed in technical triplicate.
Figure 5.
Figure 5.
Visualization of PM and ER localization of optoPLD activity using a real-time variant of IMPACT. (A) Schematic of a real-time variant of IMPACT (RT-IMPACT) for visualizing subcellular localizations of PLD activity. Cells expressing or harboring PLD enzymes are treated with oxoTCO to produce oxoTCO-containing phosphatidyl alcohol lipids via transphosphatidylation. These lipids are then tagged with a fluorogenic Tz-BODIPY conjugate via tetrazine ligation click chemistry, whose reaction progress can be visualized in real-time (due to fluorescence turn-on) by confocal microscopy. (B) Live-cell imaging of IMPACT-labeled PLD DKO cells expressing either PM- or ER-targeted optoPLDs shows optoPLD-dependent labeling on PM. Cells transfected with the indicated optoPLD were treated with oxoTCO (3 mM) for 3 min with blue light illumination (5 s every 1 min), followed by real-time imaging of the tetrazine ligation click chemistry reaction by addition of Tz-BODIPY (0.33 µM) and time-lapse monitoring by confocal microscopy. A single time point (10 s after the addition of Tz-BODIPY) is displayed. Green, IMPACT; magenta, PLD. (C) Zoomed-in images from B. Scale bars: 10 µm (B), 2 µm (C).
Figure S5.
Figure S5.
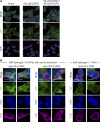
Effects of optoPLD on Hippo signaling depend on substrate stiffness. (A) Verification that application of exogenous PA to cells suppresses Hippo signaling. HEK 293T cells were serum starved for 20 h followed by addition of no reagent, control liposomes containing PC (DOPC), or liposomes containing 20% PA (dioleoylphosphatidic acid [DOPA]) and the balance as DOPC for 1 h. Cells were then fixed and immunostained for YAP, followed by confocal microscopy imaging. Note predominantly cytoplasmic localization of YAP under control conditions and nuclear localization of YAP when PA is added to cells, indicating a downregulation of Hippo signaling. (B) PM-targeting optoPLD downregulates the Hippo pathway in HEK 293T cells grown on stiff (∼40 kPa strength), but not soft (∼1 kPa), hydrogels. For experiments with high substrate stiffness (∼40 kPa), cells grown on stiff hydrogels were transfected with PM-targeting optoPLD or optodPLD, serum starved for 20 h to activate the Hippo pathway, illuminated with blue light for 30 min (5-s illumination every 2 min), fixed, and immunostained for YAP. Note that cells expressing optoPLD, but not optodPLD, exhibited nuclear localization of YAP, indicating a suppression of Hippo signaling by PM-targeted PA. For experiments with low substrate stiffness, cells grown on soft hydrogels (∼1 kPa) in full growth media were transfected with the PM-targeting optoPLD, illuminated with light for 30 min (5-s illumination every 2 min), fixed, and immunostained for YAP. Note that under these conditions, the low-stiffness substrate activates the Hippo pathway, which cannot be downregulated by optoPLD. Scale bars: 10 µm.
Figure 6.
Figure 6.
Application of optoPLD to understand role of spatially defined PA pools in controlling Hippo signaling. (A) IF staining of YAP in serum-starved HEK 293T cells expressing optoPLD on the indicated organelle membrane. All samples except the bottom row were illuminated with blue light (5 s every 2 min) for 30 min. Green, YAP; magenta, optoPLD; blue, DAPI (nuclei). Scale bars: 10 µm. (B) PM-targeted optoPLD has the strongest effect on downregulating the Hippo pathway. Shown are violin plots to quantify, from IF images, the percentage of YAP IF signal in the nucleus (n = 200 cells from five biological replicates) in cells expressing optoPLD targeted to different organelles. (C) Members of the optoPLD# collection (violet) exhibit varying effects, when targeted to the PM, on causing nuclear translocation of YAP. Also included in the analysis are WT optoPLD (red) and catalytic-dead optodPLD (gray). Shown are violin plots to quantify, from IF images, percentage of YAP IF signal in the nucleus (n = 60 cells from three biological replicates). **, P < 0.01; ***, P < 0.001; ****, P < 0.0001. (D) Plot depicting the relationship between the PA-synthesizing enzymatic activity of a given PM-targeted optoPLD#, measured by IMPACT (x axis, data from Fig. 4 D) and its ability to cause nuclear translocation of YAP (y axis, data from C). The coefficient of determination (R2) is 0.97.

Similar articles

Cited by

References

    1. Adachi Y., Itoh K., Yamada T., Cerveny K.L., Suzuki T.L., Macdonald P., Frohman M.A., Ramachandran R., Iijima M., and Sesaki H.. 2016. Coincident Phosphatidic Acid Interaction Restrains Drp1 in Mitochondrial Division. Mol. Cell. 63:1034–1043. 10.1016/j.molcel.2016.08.013 - DOI - PMC - PubMed
    1. Alamudi S.H., Satapathy R., Kim J., Su D., Ren H., Das R., Hu L., Alvarado-Martínez E., Lee J.Y., Hoppmann C., et al. . 2016. Development of background-free tame fluorescent probes for intracellular live cell imaging. Nat. Commun. 7:11964 10.1038/ncomms11964 - DOI - PMC - PubMed
    1. Angelini A., Chen T.F., de Picciotto S., Yang N.J., Tzeng A., Santos M.S., Van Deventer J.A., Traxlmayr M.W., and Wittrup K.D.. 2015. Protein Engineering and Selection Using Yeast Surface Display. In Yeast Surface Display: Methods, Protocols, and Applications. B. Liu, editor. Springer, New York. 3–36. 10.1007/978-1-4939-2748-7_1 - DOI - PubMed
    1. Antonescu C.N., Danuser G., and Schmid S.L.. 2010. Phosphatidic acid plays a regulatory role in clathrin-mediated endocytosis. Mol. Biol. Cell. 21:2944–2952. 10.1091/mbc.e10-05-0421 - DOI - PMC - PubMed
    1. Benedetti L., Barentine A.E.S., Messa M., Wheeler H., Bewersdorf J., and De Camilli P.. 2018. Light-activated protein interaction with high spatial subcellular confinement. Proc. Natl. Acad. Sci. USA. 115:E2238–E2245. 10.1073/pnas.1713845115 - DOI - PMC - PubMed

Publication types

MeSH terms