Shell-Free Copper Indium Sulfide Quantum Dots Induce Toxicity in Vitro and in Vivo
- PMID: 31999467
- PMCID: PMC7210713
- DOI: 10.1021/acs.nanolett.9b05259
Shell-Free Copper Indium Sulfide Quantum Dots Induce Toxicity in Vitro and in Vivo
Abstract
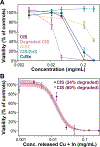
Semiconductor quantum dots (QDs) are attractive fluorescent contrast agents for in vivo imaging due to their superior photophysical properties, but traditional QDs comprise toxic materials such as cadmium or lead. Copper indium sulfide (CuInS2, CIS) QDs have been posited as a nontoxic and potentially clinically translatable alternative; however, previous in vivo studies utilized particles with a passivating zinc sulfide (ZnS) shell, limiting direct evidence of the biocompatibility of the underlying CIS. For the first time, we assess the biodistribution and toxicity of unshelled CIS and partially zinc-alloyed CISZ QDs in a murine model. We show that bare CIS QDs breakdown quickly, inducing significant toxicity as seen in organ weight, blood chemistry, and histology. CISZ demonstrates significant, but lower, toxicity compared to bare CIS, while our measurements of core/shell CIS/ZnS are consistent with literature reports of general biocompatibility. In vitro cytotoxicity is dose-dependent on the amount of metal released due to particle degradation, linking degradation to toxicity. These results challenge the assumption that removing heavy metals necessarily reduces toxicity: indeed, we find comparable in vitro cytotoxicity between CIS and CdSe QDs, while CIS caused severe toxicity in vivo compared to CdSe. In addition to highlighting the complexity of nanotoxicity and the differences between the in vitro and in vivo outcomes, these unexpected results serve as a reminder of the importance of assessing the biocompatibility of core QDs absent the protective ZnS shell when making specific claims of compositional biocompatibility.
Keywords: CIS; CuInS2; QDs; biodegradable; fluorescent contrast agent; in vivo imaging; nanomedicine; nanotoxicity.
Conflict of interest statement
The authors declare no competing financial interest.
Figures


Similar articles
-
Amino Acid-Capped Water-Soluble Near-Infrared Region CuInS2/ZnS Quantum Dots for Selective Cadmium Ion Determination and Multicolor Cell Imaging.Anal Chem. 2019 Jul 16;91(14):8987-8993. doi: 10.1021/acs.analchem.9b01183. Epub 2019 Jul 2. Anal Chem. 2019. PMID: 31265249
-
In vitro and in vivo immunotoxicity of PEGylated Cd-free CuInS2/ZnS quantum dots.Nanotoxicology. 2020 Apr;14(3):372-387. doi: 10.1080/17435390.2019.1708495. Epub 2020 Jan 7. Nanotoxicology. 2020. PMID: 31909648
-
In Vivo Toxicity Evaluation of PEGylated CuInS2/ZnS Quantum Dots in BALB/c Mice.Front Pharmacol. 2019 Apr 25;10:437. doi: 10.3389/fphar.2019.00437. eCollection 2019. Front Pharmacol. 2019. PMID: 31080414 Free PMC article.
-
Luminescent copper indium sulfide (CIS) quantum dots for bioimaging applications.Nanoscale Horiz. 2021 Sep 1;6(9):676-695. doi: 10.1039/d1nh00260k. Epub 2021 Jul 15. Nanoscale Horiz. 2021. PMID: 34264247 Review.
-
Copper indium sulfide quantum dots in photocatalysis.J Colloid Interface Sci. 2023 May 15;638:193-219. doi: 10.1016/j.jcis.2023.01.107. Epub 2023 Jan 25. J Colloid Interface Sci. 2023. PMID: 36738544 Review.
Cited by
-
Multiplexed Shortwave Infrared Imaging Highlights Anatomical Structures in Mice.Angew Chem Int Ed Engl. 2024 Oct 21;63(43):e202410936. doi: 10.1002/anie.202410936. Epub 2024 Sep 12. Angew Chem Int Ed Engl. 2024. PMID: 39014295
-
Controlled Synthesis and Exploration of CuxFeS4 Bornite Nanocrystals.Chem Mater. 2021 Sep 28;33(18):7408-7416. doi: 10.1021/acs.chemmater.1c02029. Epub 2021 Sep 8. Chem Mater. 2021. PMID: 35221488 Free PMC article.
-
Multimodal Temperature Readout Boosts the Performance of CuInS2/ZnS Quantum Dot Nanothermometers.ACS Appl Mater Interfaces. 2024 Nov 6;16(44):60008-60017. doi: 10.1021/acsami.4c14541. Epub 2024 Oct 22. ACS Appl Mater Interfaces. 2024. PMID: 39437320 Free PMC article.
-
Red CdSe/ZnS QDs' Intracellular Trafficking and Its Impact on Yeast Polarization and Actin Filament.Cells. 2023 Feb 2;12(3):484. doi: 10.3390/cells12030484. Cells. 2023. PMID: 36766825 Free PMC article.
-
NIR-quantum dots in biomedical imaging and their future.iScience. 2021 Feb 15;24(3):102189. doi: 10.1016/j.isci.2021.102189. eCollection 2021 Mar 19. iScience. 2021. PMID: 33718839 Free PMC article. Review.
References
-
- Hong G; Antaris AL; Dai H Near-Infrared Fluorophores for Biomedical Imaging. Nat. Biomed. Eng 2017, 1(1). 10.1038/s41551-016-0010. - DOI
Publication types
MeSH terms
Substances
Grants and funding
LinkOut - more resources
Full Text Sources

