. 2020 May 1;130(5):2408-2421.
doi: 10.1172/JCI128161.

Dysfunctional polycomb transcriptional repression contributes to lamin A/C-dependent muscular dystrophy

Affiliations

Dysfunctional polycomb transcriptional repression contributes to lamin A/C-dependent muscular dystrophy

Andrea Bianchi et al. J Clin Invest. .

Abstract

Lamin A is a component of the inner nuclear membrane that, together with epigenetic factors, organizes the genome in higher order structures required for transcriptional control. Mutations in the lamin A/C gene cause several diseases belonging to the class of laminopathies, including muscular dystrophies. Nevertheless, molecular mechanisms involved in the pathogenesis of lamin A-dependent dystrophies are still largely unknown. The polycomb group (PcG) of proteins are epigenetic repressors and lamin A interactors, primarily involved in the maintenance of cell identity. Using a murine model of Emery-Dreifuss muscular dystrophy (EDMD), we show here that lamin A loss deregulated PcG positioning in muscle satellite stem cells, leading to derepression of non-muscle-specific genes and p16INK4a, a senescence driver encoded in the Cdkn2a locus. This aberrant transcriptional program caused impairment in self-renewal, loss of cell identity, and premature exhaustion of the quiescent satellite cell pool. Genetic ablation of the Cdkn2a locus restored muscle stem cell properties in lamin A/C-null dystrophic mice. Our findings establish a direct link between lamin A and PcG epigenetic silencing and indicate that lamin A-dependent muscular dystrophy can be ascribed to intrinsic epigenetic dysfunctions of muscle stem cells.

Keywords: Epigenetics; Mouse stem cells; Muscle Biology; Skeletal muscle; Stem cells.


Conflict of interest statement

Conflict of interest: The authors have declared that no conflict of interest exists.

Figures

Figure 1
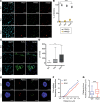
Figure 1. Lamin A regulates MuSC self-renewal.
(A) Immunohistochemical staining in LmnaΔ8–11 mice of PAX7 and MYOD markers at the indicated days of postnatal growth (d10–d19). Basement membrane of muscle fibers was stained with anti-laminin. Activated, ASC (PAX7+MYOD+) and self-renewing, QSC (PAX7+MYOD) MuSCs are shown. Scale bars: 50 μm. (B) Quantification of MuSC pool composition in A; n = 3–6 animals per genotype (C) Quantification of myofiber size during postnatal growth, evaluated by the cross-sectional area (CSA). n > 350 fibers, n = 3–4 animals per genotype. Horizontal lines within the boxes represent the medians, upper and lower bounds of the boxes represent quartiles Q3 (75th percentile) and Q1 (25th percentile), respectively, and the whiskers min to max. (D) Immunohistochemical staining of single myofibers extracted from LmnaΔ8–11 mice at d19 and cultured 96 hours. Activated (PAX7+MYOD+), self-renewing (PAX7+MYOD), and differentiating (PAX7MYOD+) cells are shown. Scale bars: 20 μm. (E) Quantification of MuSC pool composition in D; n > 50 muscle fibers/genotype, n = 5–8 animals per genotype. (F) Immunohistochemical staining of single myofibers as in D. PAX7+MYOG+, PAX7+MYOG, and PAX7MYOG+ cells are shown. Scale bars: 20 μm. (G) Quantification of MuSC pool composition in F; n > 50 muscle fibers/group, n = 3–5 animals per genotype. Data in B, E, and G are the mean ± SEM. *P < 0.05; **P < 0.01; ***P < 0.001 by 1-way (C) or 2-way (B, E, and G) ANOVA with multiple comparisons. WT = LmnaΔ8–11+/+; het = LmnaΔ8–11+/–; hom = LmnaΔ8–11–/–.
Figure 2
Figure 2. Lamin A levels influence muscle regeneration.
(A) Immunohistochemical staining of PAX7 and MYOD markers in adult, injured LmnaΔ8–11 mice. Basement membrane of muscle fibers was stained with anti-laminin. Activated, ASC (PAX7+MYOD+) and self-renewing, QSC (PAX7+MYOD) MuSCs are shown. Scale bars: 100 μm. (B) Quantification of MuSC pool composition in A; n = 3–6 animals per group. (C) Number of Pax7+ MuSCs on 100 fibers for the experiment shown in A. Data in B and C are the mean ± SEM. Statistics by 1-way (C) or 2-way (B) ANOVA with multiple comparisons. Statistical comparisons between controls and injured (B and C) are not shown. **P < 0.01; WT = LmnaΔ8–11+/+; het = LmnaΔ8–11+/–.
Figure 3
Figure 3. LmnaΔ8–11–/– dystrophic MuSCs display PcG displacement.
(A) Heatmap reporting log2 ratios of observed over expected (colored bar) number of genes in the intersections between H3K27me3 targets identified in LmnaΔ8–11+/+ mice and the upregulated genes in LmnaΔ8–11–/– mice. Fisher’s exact test P = 2.38 × 10⁻⁵. (BD) Average profile of H3K27me3 ChIP-seq signal calculated as the IP/input ratio over annotated mouse genes. (B) Average profile of H3K27me3 signal around the TSS. (C) Average profile of H3K27me3 signal along the gene body. TES, annotated transcript end. (D) Average profile of H3K27me3 signal in regions outside H3K27me3 peaks and outside annotated genes. (E) Normalized expression distribution of genes stratified using WT expression level in the 3 biological replicates (see Supplemental Methods). Distribution of average log2 transcripts per million (TPM + 0.1) values is plotted for WT and hom. Data in the boxes extend from the 25th to the 75th percentiles with the median indicated. The upper whisker extends from the hinge to the highest value that is within 1.5 × IQR of the hinge, where IQR is the interquartile range, or distance between the first and third quartiles. The lower whisker extends from the hinge to the lowest value within 1.5 × IQR of the hinge. Data beyond the end of the whiskers are outliers and plotted as points. (F) Average profile of H3K27me3 signal (IP/input) along the gene body using gene categories as in E. WT = LmnaΔ8–11+/+; hom = LmnaΔ8–11–/–.
Figure 4
Figure 4. Lamin A–PcG–mediated transcriptional repression preserves MuSC identity.
(A) Heatmap reporting log2 ratios of observed over expected number of genes (colored bar) in the intersections between bivalent promoters identified in WT satellite cells and the upregulated genes in LmnaΔ8–11–/– mice. Fisher’s exact test P = 4.57 × 10⁻⁷. (B) Semantic similarity analysis of GO terms enriched in upregulated genes in hom versus WT comparison (FDR < 0.05) with macrocategories identified using the REVIGO web tool (http://revigo.irb.hr/). (C) Heatmap reporting log2 ratios of observed over expected number of genes (colored bar) in the intersections between upregulated genes in LmnaΔ8–11–/– mice in Pparg-related GO terms and the bivalent genes identified as above. Fisher’s exact test P = 6.73 × 10⁻⁶. WT = LmnaΔ8–11+/+; hom = LmnaΔ8–11–/–.
Figure 5
Figure 5. Deregulation of Pparg locus in LmnaΔ8–11–/– MuSCs.
(A) Immunohistochemical staining of PAX7 and PPARγ markers in LmnaΔ8–11 mice at 19 days of postnatal growth (d19). Scale bars: 50 μm. (B) Quantification of PPARγ+ MuSCs in A; n = 4–5 animals per genotype. Data are the mean ± SEM. (C) Immunohistochemical staining of perilipin (PLIN) in LmnaΔ8–11 muscles at d19. Nuclei of muscle fibers were stained with DAPI. Scale bars: 25 μm. (D) Quantification of perilipin staining in C; n = 5 animals per genotype. (E) Representative image of FISH analysis of fixed and sorted MuSCs from LmnaΔ8–11 mice at d19 with probes indicated in Supplemental Figure 10. Scale bars: 2 μm. (F) Quantification of FISH probe (represented in Supplemental Figure 10) distances (x axis) versus cumulative frequency distributions (y axis). Only probes with distances of 0.5 μm or less are reported. n = 1–2 animals per genotype. (G) Quantification of FISH probe position with respect to the nuclear envelope. In the box-and-whisker plots in D and G, horizontal lines within the boxes represent the medians, upper and lower bounds of the boxes represent quartiles Q3 (75th percentile) and Q1 (25th percentile), respectively, and whiskers min to max. *P < 0.05; ***P < 0.001 by 2-way ANOVA with multiple comparisons (B and D) or Kolmogorov-Smirnov test (F and G). WT = LmnaΔ8–11+/+; het = LmnaΔ8–11+/–; hom = LmnaΔ8–11–/–.
Figure 6
Figure 6. LmnaΔ8–11–/– MuSCs acquire senescence transcriptional traits.
(A) Representative image of myofiber-derived MuSCs from LmnaΔ8–11 mice at d19 immunostained for p-p38 and PAX7 after 48 hours of culture. Scale bars: 25 μm. (B) Quantification of asymmetric and symmetric divisions assessed by p-p38 distribution as shown in A. (C) Quantification of asymmetric apico-basal division versus symmetric planar divisions. n = 46 ± 6 doublets of MuSCs per genotype, n = 7–9 mice per group. Data in B and C are the mean ± SEM. (D) GSEA of expression data from old and young mouse quiescent satellite cells (25). Upregulated (log[fold change] > 1) genes in hom versus WT comparison added to Biocarta mouse pathways from the gskb R package were used as gene sets (NES = 4.70, FDR < 1 × 10⁻⁴). (E) ChIP-seq of H3K27me3 mark and RNA-seq signal tracks on the Cdkn1a/p21 locus. Promoter regions are highlighted by light blue rectangles. Statistics by 2-way ANOVA with multiple comparisons. **P < 0.01; ***P < 0.001. WT = LmnaΔ8–11 /+; het = LmnaΔ8–11+/–; hom = LmnaΔ8–11–/–.
Figure 7
Figure 7. Cdkn2a genetic ablation restores regenerative capacity of LmnaΔ8–11–/– dystrophic mice.
(A) Transcriptional analysis of p16INK4 and p19ARF at the Cdkn2a locus in LmnaΔ8–11 mouse MuSCs (left graph) at d19 and d26 and whole muscles (right graph) at d26. Values were normalized to Gapdh and compared with the average of WT amplification. nd, not detected. n = 3–10 animals per genotype. (B) Immunohistochemical staining of PAX7 and MYOD markers in Cdkn2a/LmnaΔ8–11 mice at d19. Basement membrane of muscle fibers was stained with anti-laminin. Activated, ASC (PAX7+/MYOD+) and self-renewing, QSC (PAX7+MYOD) MuSCs are shown. Scale bars: 50 μm. (C) Quantification of MuSC pool composition in B. n = 4–5 animals per genotype. Data in A and C are the mean ± SEM. (D) Quantification of myofiber size, evaluated by the cross-sectional area (CSA). n = 600 muscle fibers. n = 4–5 animals per genotype. The horizontal lines within the boxes represent the medians, upper and lower bounds of the boxes represent quartiles Q3 (75th percentile) and Q1 (25th percentile), respectively, and whiskers min to max. *P < 0.05; **P < 0.01; ***P < 0.001 by unpaired t test (A) or by 1-way (D) or 2-way (C) ANOVA with multiple comparisons. WT = LmnaΔ8–11+/+; hom = LmnaΔ8–11–/–.
Figure 8
Figure 8. Lamin A/C–polycomb crosstalk in lamin-dependent muscular dystrophy.
In WT MuSCs the lamin A–PcG interplay sustains the chromatin higher order structure at differentiation loci, ensuring proper spatio-temporal gene regulation during muscle differentiation. The absence of lamin A/C determines PcG displacement and relaxation of PcG-mediated higher-order chromatin structure. In LmnaΔ8–11–/– MuSCs lamin A/C–PcG dysfunctional crosstalk causes a lack of cellular identity and premature senescence, finally leading to an exhaustion of the stem cell niche and infiltration of adipogenic cells. WT = LmnaΔ8–11+/+; hom = LmnaΔ8–11–/–.

References

    1. Shimi T, et al. Structural organization of nuclear lamins A, C, B1, and B2 revealed by superresolution microscopy. Mol Biol Cell. 2015;26(22):4075–4086. doi: 10.1091/mbc.E15-07-0461. - DOI - PMC - PubMed
    1. Turgay Y, et al. The molecular architecture of lamins in somatic cells. Nature. 2017;543(7644):261–264. doi: 10.1038/nature21382. - DOI - PMC - PubMed
    1. van Steensel B, Belmont AS. Lamina-associated domains: links with chromosome architecture, heterochromatin, and gene repression. Cell. 2017;169(5):780–791. doi: 10.1016/j.cell.2017.04.022. - DOI - PMC - PubMed
    1. Zaremba-Czogalla M, Dubińska-Magiera M, Rzepecki R. Laminopathies: the molecular background of the disease and the prospects for its treatment. Cell Mol Biol Lett. 2011;16(1):114–148. - PMC - PubMed
    1. Kolb T, Maass K, Hergt M, Aebi U, Herrmann H. Lamin A and lamin C form homodimers and coexist in higher complex forms both in the nucleoplasmic fraction and in the lamina of cultured human cells. Nucleus. 2011;2(5):425–433. doi: 10.4161/nucl.2.5.17765. - DOI - PubMed

Publication types

MeSH terms