Comparative Study
. 2020 Jan 30;20(1):14.
doi: 10.1186/s40644-020-0293-6.

Role of whole-body MRI for treatment response assessment in multiple myeloma: comparison between clinical response and imaging response

Affiliations
Comparative Study

Role of whole-body MRI for treatment response assessment in multiple myeloma: comparison between clinical response and imaging response

Ho Young Park et al. Cancer Imaging. .

Abstract

Background: Whole-body MRI (WB-MRI) including diffusion-weighted image (DWI) have been widely used in patients with multiple myeloma. However, evidence for the value of WB-MRI in the evaluation of treatment response remains sparse. Therefore, we evaluated the role of WB-MRI in the response assessment.

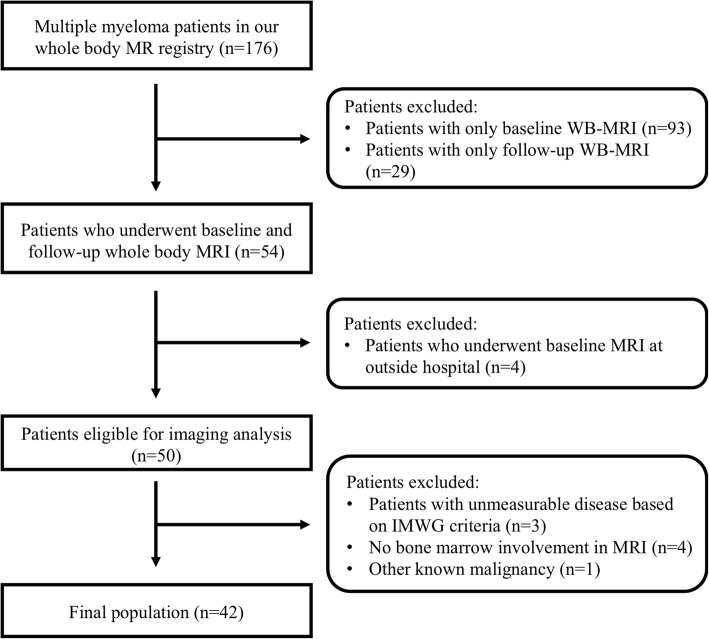
Methods: In our WB-MRI registry, we searched multiple myeloma patients treated with chemotherapy who underwent both baseline and follow-up WB-MRI scans. Clinical responses were categorized as complete response (CR), partial response (PR), stable disease (SD), or progressive disease (PD), using IMWG criteria. Using RECIST 1.1, MD Anderson (MDA) criteria, and MDA-DWI criteria, imaging responses on WB-MRI were rated as CR, PR, SD, or PD by two radiologists independently. Then, discrepancy cases were resolved by consensus. Weighted Kappa analysis was performed to evaluate agreement between the imaging and clinical responses. The diagnostic accuracy of image responses in the evaluation of clinical CR, objective response (CR and PR), and PD was calculated.

Results: Forty-two eligible patients were included. There was moderate agreement between imaging and clinical responses (κ = 0.54 for RECIST 1.1, κ = 0.58 for MDA criteria, κ = 0.69 for MDA-DWI criteria). WB-MRI showed excellent diagnostic accuracy in assessment of clinical PD (sensitivity 88.9%, specificity 94.7%, positive predictive value [PPV] 84.2%, negative predictive value [NPV] 96.4% in all three imaging criteria). By contrast, WB-MRI showed low accuracy in assessment of clinical CR (sensitivity 4.5%, specificity 98.1%, PPV 50.0%, NPV 71.2% in all three imaging criteria). As to the clinical objective response, the diagnostic accuracy was higher in MDA-DWI criteria than RECIST 1.1 and MDA criteria (sensitivity/specificity/PPV/NPV, 84.2%/94.4%/98.0%/65.4, 54.4%/100%/100%/40.9, and 61.4%/94.4%/97.2%/43.6%, respectively).

Conclusions: In the imaging response assessment of multiple myeloma, WB-MRI showed excellent performance in the evaluation of PD, but not in the assessment of CR or objective response. When adding DWI to imaging response criteria, diagnostic accuracy for objective response was improved and agreement between imaging and clinical responses was increased.

Keywords: Magnetic resonance imaging; Multiple myeloma; Response assessment; Whole-body imaging.


Conflict of interest statement

The authors declare that they have no competing interests.

Figures

Fig. 1
Fig. 1
Flow chart of patient enrollment
Fig. 2
Fig. 2
A 70-year-old male with multiple myeloma demonstrating a discrepancy between imaging response and clinical response. MRI taken before chemotherapy (a) shows a nodular bone marrow lesion in the left ilium with T2 hyperintensity (upper right) and contrast enhancement (middle right). It shows diffusion restriction on ADC map (mean ADC value: 0.93 × 10− 3 mm2/s) (lower right). Follow-up MRI at 3 months (b) and 8 months (c) show gradual increase in the size of the bone marrow lesion with extraosseous soft tissue extension involving the left iliacus and gluteus medius. Aggravation of diffusion restriction was noted on follow-up ADC maps (mean ADC value: 0.70 ~ 0.78 × 10− 3 mm2/s). Clinical markers improved over the same period (serum M-protein: 2.1 ➔ 0 g/dl); however, despite the improvement in the laboratory markers, the treatment regimen was changed according to the disease progression on the imaging response
Fig. 3
Fig. 3
A 56-year-old male with multiple myeloma showing disease progression. Coronal T2WI (left) taken before chemotherapy (a) shows diffuse high signal intensity in the bone marrow (arrows). Sagittal CE T1WI (upper right) shows diffuse enhancement of bone marrow in the whole spine. Coronal enhanced T1WI (lower right) shows multifocal bone marrow enhancement in the calvarium. MRI at 14 months after initiation of chemotherapy and ASCT (b) shows a further increase in the signal intensity and extent of diffuse bone marrow lesions (arrows) on coronal T2WI (left) and sagittal T1WI (upper right). Axial T1WI (lower right) shows enlarged focal lesions in the calvarium, indicative of disease progression
Fig. 4
Fig. 4
A 56-year-old male with multiple myeloma demonstrating additional benefit of DWI in the evaluation of clinical objective response. MRI taken before chemotherapy (a) shows a 4.0 × 3.1 cm enhancing mass at posterior arc of left 9th rib. Axial DWI (b = 900) and ADC map show marked diffusion restriction in the lesion (mean ADC value: 0.54 × 10− 3 mm2/s). Coronal diffusion MIP image (b = 900) shows diffuse high signal intensity involving whole axial skeletons, suggesting diffuse bone marrow involvement. After 4 cycles of chemotherapy, follow-up MRI (b) shows equivocal change in the tumor size (3.7 × 2.3 cm) in the left 9th rib. Axial DWI (b = 900) and ADC map show marked improvement of diffusion restriction in the lesion (mean ADC value: 1.54 × 10− 3 mm2/s). Coronal diffusion MIP image (b = 900) demonstrates decreased signal intensity in the axial skeletons, suggesting good response to the treatment. Based on RECIST 1.1 or MDA criteria, this patient is classified as imaging SD. However, when DWI findings are considered in MDA-DWI criteria, this patient is classified into imaging PR

References

    1. Kumar S, Paiva B, Anderson KC, et al. International myeloma working group consensus criteria for response and minimal residual disease assessment in multiple myeloma. Lancet Oncol. 2016;17(8):e328–ee46. doi: 10.1016/S1470-2045(16)30206-6. - DOI - PubMed
    1. Hillengass J, Usmani S, Rajkumar SV, et al. International myeloma working group consensus recommendations on imaging in monoclonal plasma cell disorders. Lancet Oncol. 2019;20(6):e302–ee12. doi: 10.1016/S1470-2045(19)30309-2. - DOI - PubMed
    1. Dimopoulos M, Terpos E, Comenzo RL, et al. International myeloma working group consensus statement and guidelines regarding the current role of imaging techniques in the diagnosis and monitoring of multiple myeloma. Leukemia. 2009;23(9):1545–1556. doi: 10.1038/leu.2009.89. - DOI - PubMed
    1. Rajkumar SV, Dimopoulos MA, Palumbo A, et al. International myeloma working group updated criteria for the diagnosis of multiple myeloma. Lancet Oncol. 2014;15(12):e538–ee48. doi: 10.1016/S1470-2045(14)70442-5. - DOI - PubMed
    1. Dimopoulos MA, Hillengass J, Usmani S, et al. Role of magnetic resonance imaging in the management of patients with multiple myeloma: a consensus statement. J Clin Oncol. 2015;33(6):657–664. doi: 10.1200/JCO.2014.57.9961. - DOI - PubMed