Review
. 2020 Feb 20;77(4):688-708.
doi: 10.1016/j.molcel.2019.12.021. Epub 2020 Jan 27.

Chromosome Conformation Capture and Beyond: Toward an Integrative View of Chromosome Structure and Function

Affiliations
Review

Chromosome Conformation Capture and Beyond: Toward an Integrative View of Chromosome Structure and Function

Rachel Patton McCord et al. Mol Cell. .

Abstract

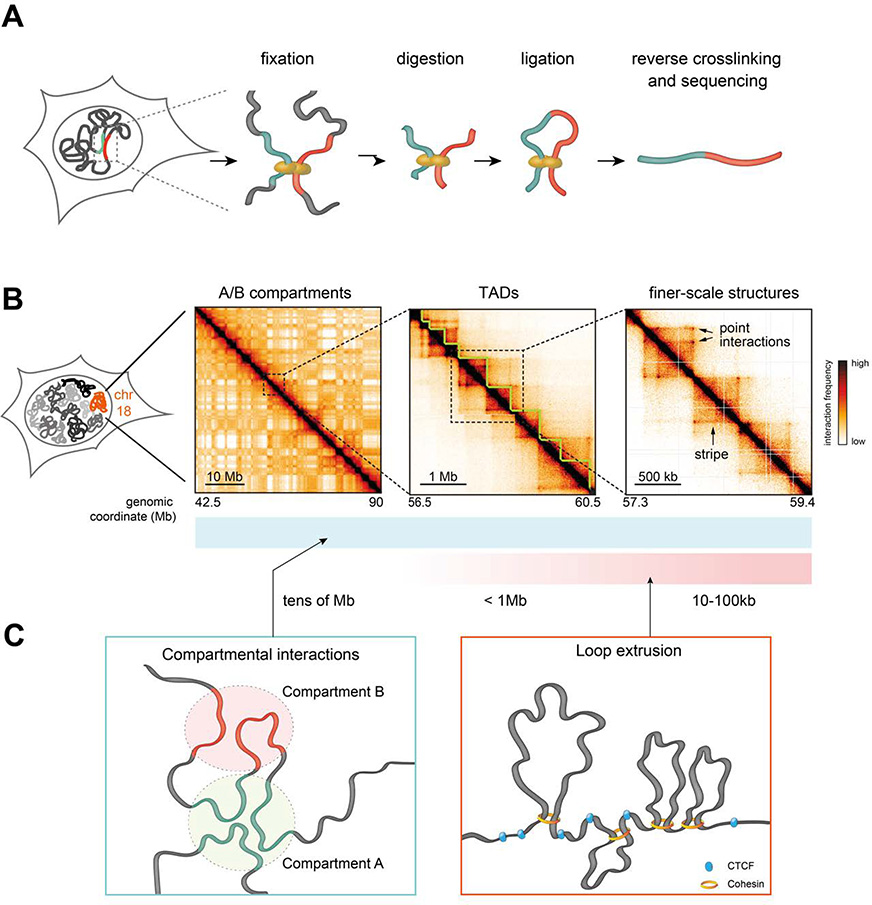
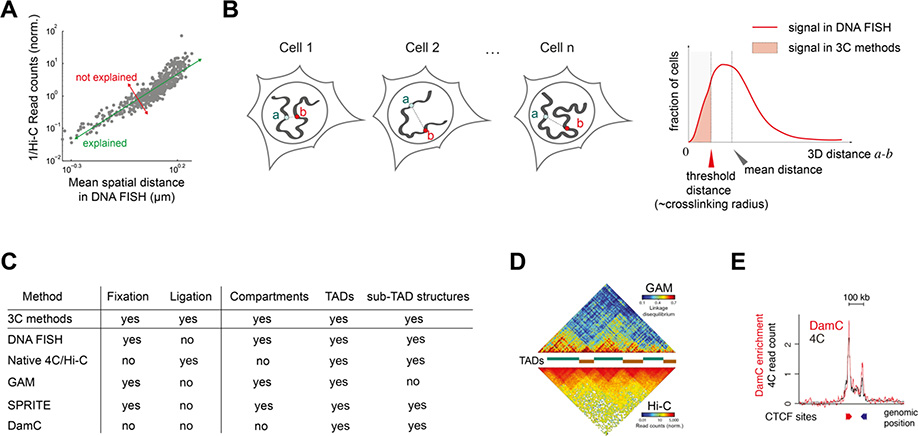
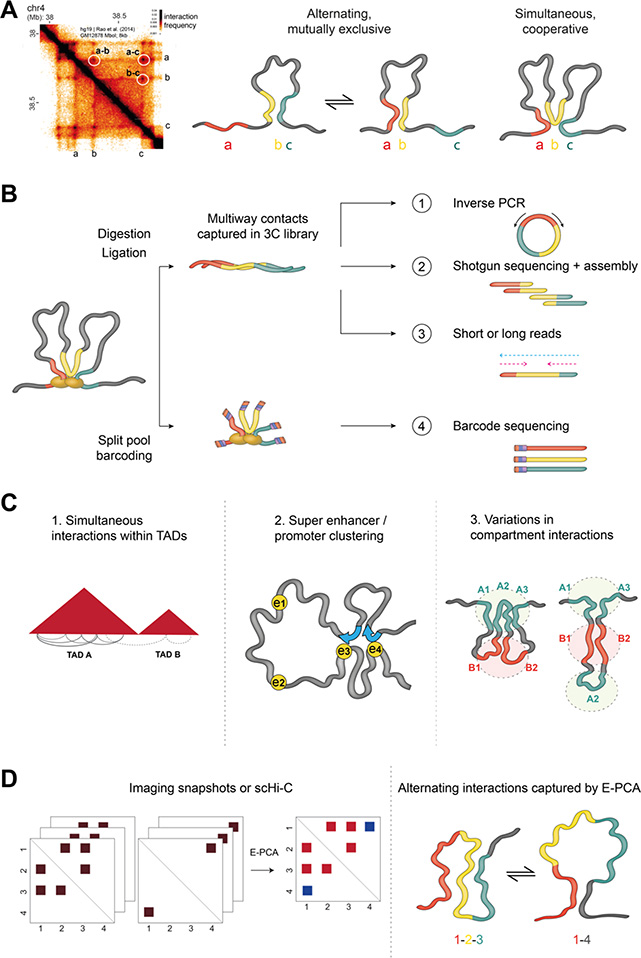
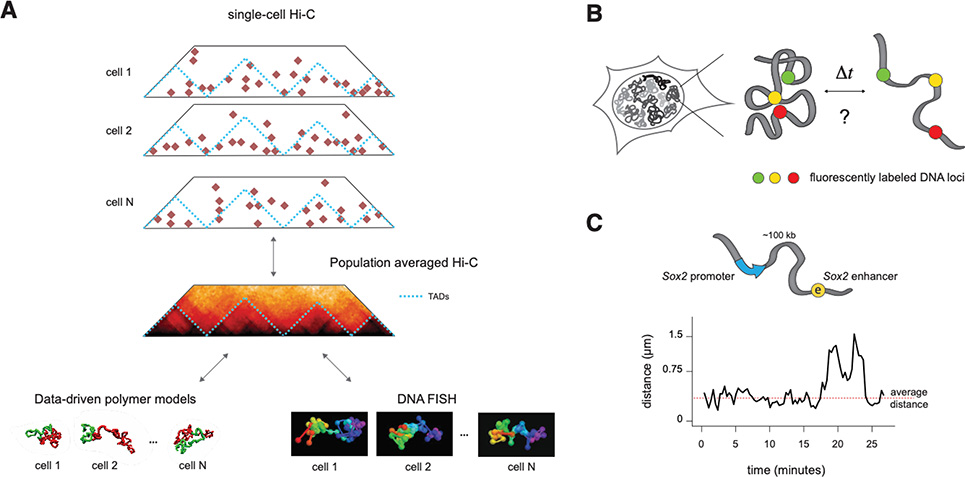
Rapidly developing technologies have recently fueled an exciting era of discovery in the field of chromosome structure and nuclear organization. In addition to chromosome conformation capture (3C) methods, new alternative techniques have emerged to study genome architecture and biological processes in the nucleus, often in single or living cells. This sets an unprecedented stage for exploring the mechanisms that link chromosome structure and biological function. Here we review popular as well as emerging approaches to study chromosome organization, focusing on the contribution of complementary methodologies to our understanding of structures revealed by 3C methods and their biological implications, and discuss the next technical and conceptual frontiers.


Figures

Figure 1.
Figure 1.
A. Scheme of the core steps in chromosome conformation capture (3C) methods. Chromatin is crosslinked in cell nuclei and digested with a restriction enzyme (or endonuclease in the case of Micro-C), followed by ligation and decrosslinking. This results in the formation of hybrid DNA molecules that can be identified by high-throughput sequencing. B. Hi-C contact maps illustrating that mammalian chromosomes are folded into checkerboard-like A/B compartments (left panel), TADs (middle panel), and shorter-scale structures. Sub-TAD structures include CTCF-related point interactions and stripes, as well as other interactions e.g. compartmental and polycomb-associated interactions (not shown in this example). Hi-C data were obtained mouse embryonic stem cells, from Ref. (Redolfi et al. 2019). Colormap saturation and scaling were modified across the three examples to emphasize structural features. C. Hierarchies observed in chromosome folding are mainly driven by compartmental interactions involving attractions between active and inactive chromatin regions, manifesting at all genomic length scales; and CTCF/cohesin-mediated interactions likely originating from the loop extrusion activity of cohesin that is arrested by CTCF bound to DNA in defined orientations.
Figure 2.
Figure 2.
A. 3C-based counts (Hi-C in this case) and spatial distances between loci measured in DNA FISH are generally well correlated, with a fraction of the variability that cannot be explained in terms of each other technique. Adapted from Ref. (Wang et al. 2016). B. DNA FISH measures 3D distances between genomic loci (a and b here) and their distribution across the cell population. Signals in 3C methods arise from the fraction of cells where a and b can be crosslinked, which is usually (but not always) correlated with their average distance. C. A summary of recently developed methods that are orthogonal to 3C and FISH and the structures they detected. D. Ligation-free Genome Architecture Mapping (GAM) detects TADs and compartments in agreement with Hi-C. Adapted from Ref. (Beagrie et al. 2017) E. Crosslinking and ligation-free DamC detects TAD boundaries and loops between convergent CTCF sites, in agreement with 4C-seq. Adapted from Ref. (Redolfi et al. 2019).
Figure 3.
Figure 3.
A. Hi-C contacts between pairs of genomic loci (e.g. a, b and c here) can either correspond to mutually exclusive or to simultaneous (and possibly cooperative) interactions in single cells. B. Simultaneous multi-way interactions can be identified using modified 3C methods that implement alternative strategies to sequence concatamers that exist in all 3C libraries, such as inverse PCR in MC-4C (scheme 1), shotgun sequencing and assembly in C-walks (2) or short-read sequencing as in Tri-C and similar methods (3). Multi-way contacts are also retrieved in SPRITE (4) using split-pool barcoding followed by sequencing of barcodes to identify genomic regions that were captured in the same cluster. C. Multi-way chromosome conformation capture methods, as well as SPRITE and GAM, have shown overall that simultaneous contacts occur more frequently within TADs than across TAD boundaries (left), simultaneous interactions can occur between promoters and clusters of super-enhancers (middle), and that different subsets of A and B compartments cluster together in different subsets of cells (right). D. E-PCA uses sets of contact matrices and reports patterns of correlated or anticorrelated contacts. Left: simplistic example where two possible contact patterns are found across single cells. Middle: The E-PCA result reports that the red set of interactions occur together and in opposition to the blue interactions, as in the schematic on Right.
Figure 4.
Figure 4.
A. Single-cell Hi-C (top), polymer simulations (bottom left) and super-resolution DNA FISH (bottom right) show that population-averaged signals in 3C methods arise from highly variable structures that occur simultaneously in single cells. B. To measure the temporal dynamics of chromosome structures, experiments are needed where the spatial positions of two or more chromosomal locations in cis can be measured in time, in living cells. C. Simultaneous live-cell imaging of genomic locations flanking the Sox2 promoter and its (super-) enhancer in mESC shows that their distances fluctuate around average values over an experimental timescale of two hours, with sporadic stochastic larger changes. Adapted from. (Alexander et al. 2019).
Figure 5.
Figure 5.
A. Data-driven polymer models use parameter fitting to determine consensus 3D structures that satisfy contact or distance constrains inferred from Hi-C maps. They can result in either single consensus structures, or more realistic structural ensembles reflecting to some extent the cell-to-cell variability observed experimentally. Adapted from (Fudenberg et al. 2017). B. Mechanistic polymer models implement specific hypotheses concerning the mechanisms that drive 3D folding, and result in ensembles of structures that can be used to predict the outcome of virtual Hi-C experiments.
Figure 6.
Figure 6.
A. Example of a 1Mb-by-1Mb region in a Hi-C matrix illustrating various potentially ‘significant’ (A-E). Blue cross: viewpoint used for panel B. B. Blue line: Relative contact frequencies measured from the blue cross viewpoint are shown as a virtual 4C plot derived from the Hi-C matrix shown in A. Red line: background model derived from the same map by genome-wide averaging Hi-C counts from pairs of loci separated by the same genomic distances. Algorithms that determine ‘significant’ or ‘specific’ interactions would typically identify interactions with A, D and E (indicated with an asterisk) because they stand over background, but not B and C. However, B and C interact as frequently with the viewpoint as A, D and E, as indicated by the dashed line.
Figure 7.
Figure 7.
A. Transcription of RNA could either occur together with, or follow, or be completely unrelated to enhancer-promoter interactions. This could possibly depend on the specific enhancer-promoter pair, or the stability of their interactions. B. Sub-micrometer sized phase-separated compartments could alternatively lead to functional communication and RNA production without the need of actual physical interactions between an enhancer and its target promoter.

Similar articles

Cited by

References

    1. Abbas A, He X, Niu J, Zhou B, Zhu G, Ma T, Song J, Gao J, Zhang MQ, Zeng J. 2019. Integrating Hi-C and FISH data for modeling of the 3D organization of chromosomes. Nat Commun 10: 1–14. - PMC - PubMed
    1. Akhtar W, de Jong J, Pindyurin AV, Pagie L, Meuleman W, de Ridder J, Berns A, Wessels LFA, van Lohuizen M, van Steensel B. 2013. Chromatin Position Effects Assayed by Thousands of Reporters Integrated in Parallel. Cell 154: 914–927. - PubMed
    1. Alexander JM, Guan J, Li B, Maliskova L, Song M, Shen Y, Huang B, Lomvardas S, Weiner OD. 2019. Live-cell imaging reveals enhancer-dependent Sox2 transcription in the absence of enhancer proximity. eLife. https://elifesciences.org/articles/41769 (Accessed September 10, 2019). - PMC - PubMed
    1. Allahyar A, Vermeulen C, Bouwman BAM, Krijger PHL, Verstegen MJAM, Geeven G, van Kranenburg M, Pieterse M, Straver R, Haarhuis JHI, et al. 2018. Enhancer hubs and loop collisions identified from single-allele topologies. Nature Genetics 50: 1151. - PubMed
    1. Amano T, Sagai T, Tanabe H, Mizushina Y, Nakazawa H, Shiroishi T. 2009. Chromosomal Dynamics at the Shh Locus: Limb Bud-Specific Differential Regulation of Competence and Active Transcription. Developmental Cell 16: 47–57. - PubMed

Publication types

LinkOut - more resources