. 2020 Apr 8;106(1):188-198.e5.
doi: 10.1016/j.neuron.2019.12.032. Epub 2020 Jan 27.

Neural Correlates of Reinforcement Learning in Mid-lateral Cerebellum

Affiliations

Neural Correlates of Reinforcement Learning in Mid-lateral Cerebellum

Naveen Sendhilnathan et al. Neuron. .

Erratum in

Abstract

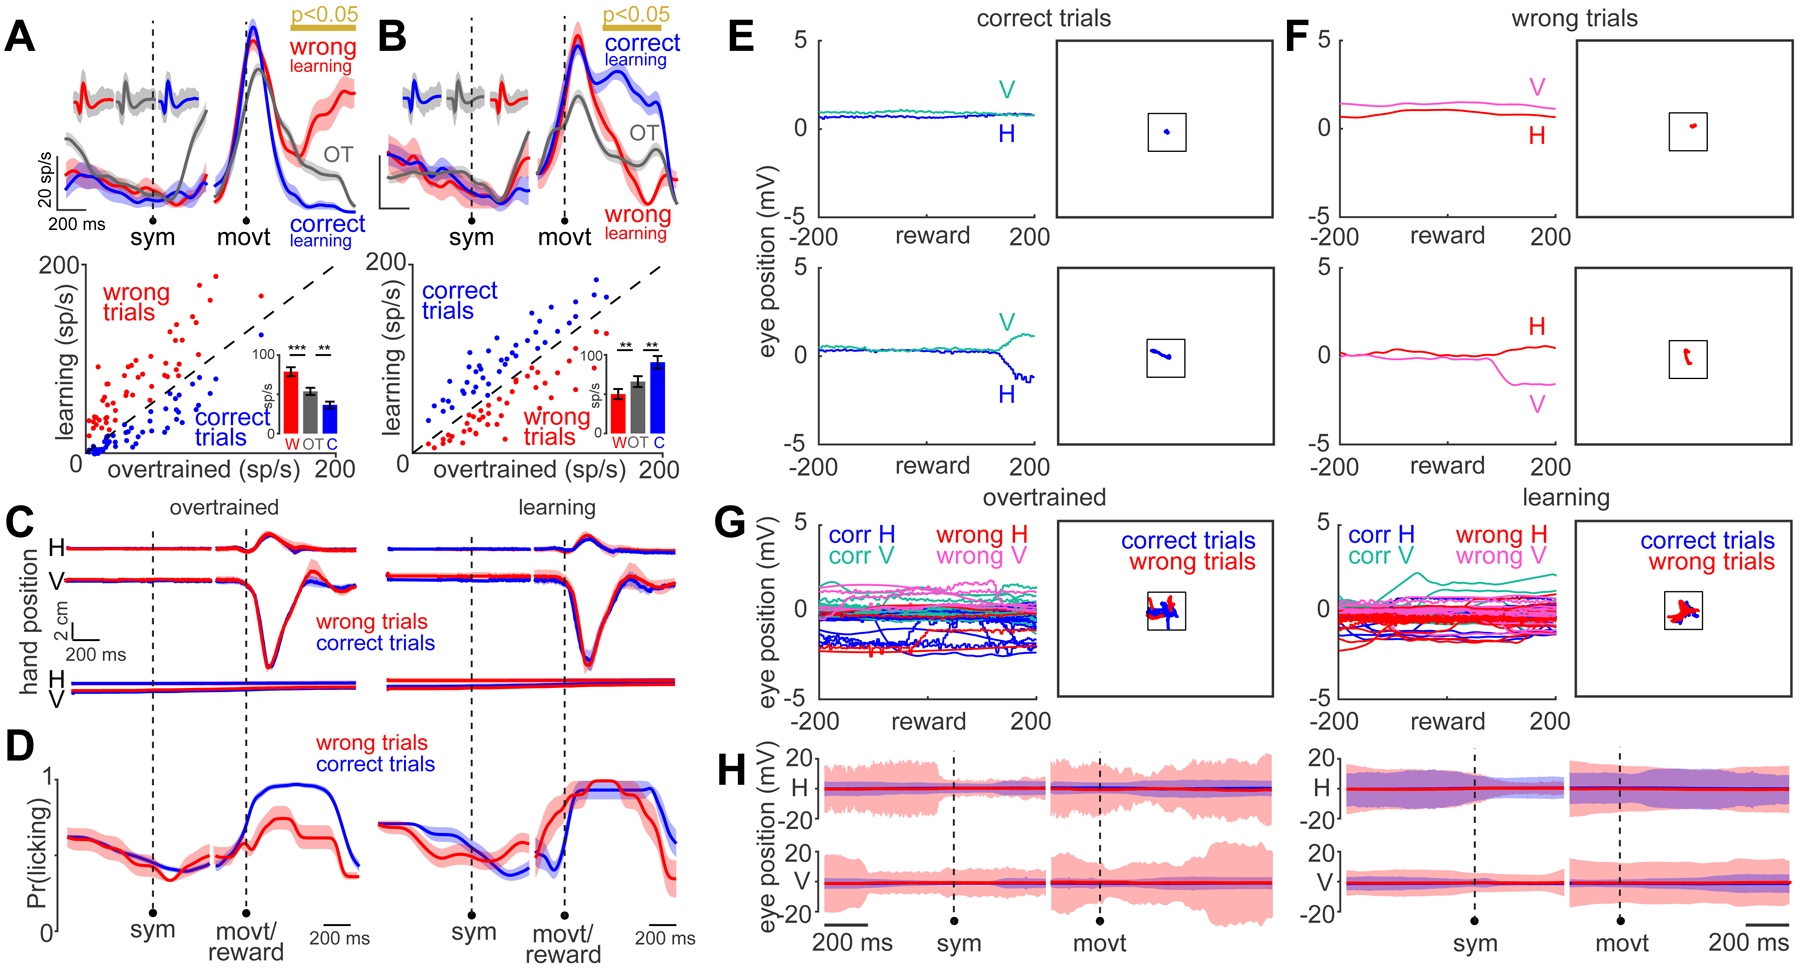
The role of the cerebellum in non-motor learning is poorly understood. Here, we investigated the activity of Purkinje cells (P-cells) in the mid-lateral cerebellum as the monkey learned to associate one arbitrary symbol with the movement of the left hand and another with the movement of the right hand. During learning, but not when the monkey had learned the association, the simple spike responses of P-cells reported the outcome of the animal's most recent decision without concomitant changes in other sensorimotor parameters such as hand movement, licking, or eye movement. At the population level, P-cells collectively maintained a memory of the most recent decision throughout the entire trial. As the monkeys learned the association, the magnitude of this reward-related error signal approached zero. Our results provide a major departure from the current understanding of cerebellar processing and have critical implications for cerebellum's role in cognitive control.

Keywords: Purkinje cell; cerebellum; cognition; complex spike; crus I; crus II; learning; reinforcement learning; simple spike; visuomotor association learning.


Conflict of interest statement

Declaration of Interests The authors declare no competing interests.

Figures

Figure 1:
Figure 1:. Mid-lateral cerebellum and visuomotor association A.
Two-alternative forced-choice discrimination task (top) and parameters (bottom): The monkeys pressed each bar with a hand, and a white square appeared that served as the cue for the start of the trial. Then one of the two visual symbols appeared briefly. The monkey lifted the hand associated with the presented symbol to earn an immediate reward. The correct symbol-choice associations are shown for the overtrained task (Green symbol – left hand; Pink symbol – right hand). B. Mean learning curve of both monkeys while they learned a new visuomotor association from an overtrained (OT) one. Inset shows the strategy of learning at the start and the end of learning. The horizontal broken line is the chance level. See also Fig S1 for behavior separated by monkeys. C. Schematic of a simple reinforcement learning rule. The value function V(t) is updated at every iteration (t) with a learning rate η, if the action was rewarded. This happens until it reaches a steady state value (V). If the action was not rewarded, the value function will not be updated. D. T1 MRI of the cerebellum recording locations (yellow markers) in both monkeys. The first panel is the coronal slice showing the chamber location and the burr-hole tract (yellow). Inset shows the chamber and the burr-hole location from bird’s eye view. The next four panels are sagittal reconstructions showing recording locations (yellow markers). E. Representative raw neural recording from a P-cell showing simple spikes (black) and a complex spike (pink). F. Leftmost panel: average traces of simple spikes (SS) and complex spikes (CS) from the cell shown in Fig 1e. Left-center panel: Probability of SS interspike interval distribution for the same cell. Right-center panel: Probability of CS interspike interval distribution for the same cell. Rightmost panel: A plot of probability of SS occurring at time = t, given a CS occurred at time = 0 (pink line), probability of SS occurring at time t, given a SS occurred at time = 0 (black line) and probability of SS occurring at time t, given a CS occurred at a random time = × (pale pink line). G. Each row shows the z-scored trial-averaged spike response of a single P-cell aligned on the symbol onset (sym) and bar-release hand movement onset (movt).
Figure 2:
Figure 2:. Learning contingent error signal
A. Top: Spike density functions of a representative P-cell for one wrong trial (red) and 30 correct trials in the overtrained condition (blue) aligned to movement onset. Bottom: Activity in the wrong trials plotted against the activity in the correct trials of the overtrained condition. B. Top: Spike density functions for no-reward (grey), small reward (gold) and large reward (brown) trials in the overtrained condition, aligned to movement onset. Bottom: A violin plot showing the activity across the population of n = 25 neurons in the three trial types for the overtrained condition. Horizontal black line indicates the mean for each group. ns means not significant (no-small: P = 0.9125; small-large: P = 0.8605; no-large: P= 0.9898 Mann-Whitney U-test). C. Stimulus-reward association task: A red square (cue for the start of the trial) appeared in the center of the screen for a fixed duration of 800 ms and then disappeared as the monkeys received a liquid reward if they made no hand movement. D. Top: The monkeys started licking the juice spout in the same way during the reward anticipation task (grey) as well as the visuomotor association task (gold). Bottom: A representative P-cell showing a movement related increase in activity during the hand movement in the visuomotor association task while showing no significant modulation in activity during a stimulus-reward association task. E. Baseline activity plotted against the peak firing rate in the movement epoch during the visuomotor association task (gold) and the stimulus-reward association task (grey) for all 25 P-cell. Inset shows the mean difference in peak activity from baseline firing for the two conditions. *** means P = 10−7, Mann-Whitney U-test. F. RMS distance between spike density functions of real vs shuffled correct and wrong trials for all the recorded neurons. Green: P-cells that showed significant difference (P>0.05; Mann-Whitney U Test) in the N-1 condition; Black: P-cells that did not show a significant difference (P<0.05; Mann-Whitney U Test) in the N-1 condition. MRD (mean rms distance) from all the cells between the real and shuffled cases was significant for only the N-1 condition (P values: 3-N = 0.6411; N-2 = 0.8025; N-1 = 2.359e-4; N+1 = 0.2680; N+2 = 0.9574; Mann-Whitney U Test).
Figure 3:
Figure 3:. Performance monitoring during learning independent of sensorimotor origin
A. Top: Spike density function of a representative wP-cell for wrong trials during learning (red), correct trials during learning (blue) and all trials in the overtrained condition (grey) aligned to movement onset. The gold bar on the top indicates the continuous time-period when the activity in the wrong trials and the correct trials were significantly different from each other (P<0.05; t-test. The inset on the left shows the spike waveforms for all the simple spikes isolated for three conditions. Bottom: Mean neural activity in the delta epoch of all trials in the overtrained condition (before; abscissa) plotted against the mean neural activity in the delta epoch of correct trials during learning (blue) and wrong trials during learning (red) for wP-cells. Broken diagonal line is the line of unity. (wP-cells: W-OT: P = 10−6, Mann-Whitney U Test; OT-C: P = 0.0025, Mann-Whitney U Test) B. Top: Same as a, but for a representative cP-cell. Bottom: Same as a, but for all cP-cells (W-OT: P = 0.0034, Mann-Whitney U Test; OT-C: P = 0.0021, Mann-Whitney U Test). C. Top: The horizontal (H) and vertical (V) hand movements for correct and wrong trials for the hand that was used to report the choice in the overtrained (left) and learning (right) conditions. Bottom: The hand movements for correct and wrong trials for the hand that was not used to report the choice in the overtrained (left) and learning (right) conditions. Note that ‘movt’ here represents the time at which the other hand movement was initiated. D. Licking behavior for correct and wrong trials in overtrained (left) and learning (right) conditions. E. Two representative correct trials where the monkeys either simply fixated (top) or made a task non-relevant eye movement sometime in the trial (bottom). H and V are the horizontal and vertical eye positions. The left panel plots the decomposed eye positions with respect to time and the right panel plots the eye position in space. F. Same as above, for two representative wrong trials. G. Since the monkey’s eye movements were not constrained in any way, they made reward independent, task-non-relevant free eye movements and therefore, their eye movements did not have a consistent pattern for correct (blue) or wrong trials (red) in overtrained (left) or learning condition (right). Nonetheless they tended to keep their eyes near the center of the screen H. Left: Average horizontal eye positions (top) and average vertical eye positions (bottom) aligned to symbol onset and hand movement onset for overtrained condition. Right: same as left, but for learning condition
Figure 4:
Figure 4:. P-cells collectively encoded one-back memory
A. A schematic illustration of trial structure with two consecutive trials (solid lines) separated by the inter-trial interval (ITI, broken line) highlighting various epochs. RIL: reward information latency, the time taken for the reward information to reach the P-cell after reward delivery. From one RIL to the next RIL, the P-cells maintain the memory of the most recent, one-back, decision as explained below. B. Representative wP-cells whose activities were higher after a wrong trial (red) relative to a correct trial (blue). The top gold line indicates the time when the difference in activity was continuously significant (P<0.05 t-test). The heat map in the bottom indicates the difference between wrong and correct traces. Leftmost neuron is aligned to movement onset with the delta epoch after RIL. The left-center neuron is aligned to symbol onset of next trial with the delta epoch in the cue epoch. The right-center neuron is aligned to symbol onset of next trial with the delta epoch in the symbol epoch. The rightmost neuron is aligned to movement onset of the next trial with the delta epoch in the movement epoch. Note that the reward was delivered 1 ms after the correct movement onset. C. Representative cP-cells whose activities were higher after a correct trial (blue) relative to a wrong trial (red). Same convention as b. D. Each row shows the difference in neural activities between trials following wrong and correct trials of a single P-cell aligned on the symbol onset (sym) and bar-release hand movement onset (movt) arranged in the increasing order of the time of peak differences for wP-cells (top) and cP-cells (bottom). RIL: Reward Information Latency.
Figure 5:
Figure 5:. Reinforcement learning related changes in neural activity
A. Difference between wrong and correct trials before learning (OT), in the first, middle and last 33% of learning for wP-cells (red; first *** means P = 4.3e-5; second *** means 0.0021; * means P = 0.0414) and cP-cells (blue; first *** means P = 0.0091; second *** means 0.0111; n.s means P = 0.0633). B. Top: average learning error from all sessions (grey). Bottom: Average magnitude of the error (|wrong – correct|) calculated in the delta epoch (yellow) and from a random sample of 200 epochs per neuron (green) for all neurons as a function of learning. The shaded region in the delta epoch case is s.e.m, but the shaded region in the random epoch condition is 2 × st. dev. C.
Figure 6:
Figure 6:. Drift diffusion reinforcement learning model
A. Schematic of the model, a1 and a2 are the two action choices that are modeled as accumulators with rates υa1 and υa2 respectively, racing to threshold (bound). The winner takes all and consequences of the chosen action ach is evaluated by the activity of P-cells in the delta epoch given by Δ. This is used to update the rates of the accumulator on a trial by trial basis. B. Evolution of the action choice rates for each symbol-action pair. C. The profile of neural activity in the delta epoch with learning from experimental data (left) and the model (right). D. Learning curves of each symbol-action associative learning from experimental data (left) and the model (right). E. Strategy used by the monkey during learning (left) and the model (right).
Figure 7:
Figure 7:. Time of complex spike activity was unrelated to time of delta epoch
a. Top: Representative wP-cell simple spike activity during learning for correct (blue) and wrong (red) trials. Shaded region is the delta epoch. Bottom: CS activity from the same P-cell during OT condition (black) and learning (pink). Shaded region is the epoch in which CS was modulated significantly. b. Same as Fig 7A, but for a cP-cell. c. Polar plot (of the entire trial period) of time of significant CS modulation during learning relative to the time of beginning (left), center (middle) or end (right) of the delta epoch for each cell during learning for all wP-cells. Each line on the plot represents time of significant modulation of CS (in ms) relative to the trigger (beginning, center or end of delta epoch for the appropriate plot). d. Same as Fig 7C, for cP-cells.

Comment in

References

    1. ALBUS JS 1971. A theory of cerebellar function. Mathematical Biosciences, 10, 25–61.
    1. BECKER EB & STOODLEY CJ 2013. Autism spectrum disorder and the cerebellum. International review of neurobiology. Elsevier. - PubMed
    1. BOSTAN AC, DUM RP & STRICK PL 2013. Cerebellar networks with the cerebral cortex and basal ganglia. Trends in cognitive sciences, 17, 241–254. - PMC - PubMed
    1. BUCKNER RL 2013. The cerebellum and cognitive function: 25 years of insight from anatomy and neuroimaging. Neuron, 80, 807–815. - PubMed
    1. CALIGIORE D, PEZZULO G, BALDASSARRE G, BOSTAN AC, STRICK PL, DOYA K, HELMICH RC, DIRKX M, HOUK J, JÖRNTELL H, LAGO-RODRIGUEZ A, GALEA JM, MIALL RC, POPA T, KISHORE A, VERSCHURE PF, ZUCCA R & HERREROS I 2017. Consensus Paper: Towards a Systems-Level View of Cerebellar Function: the Interplay Between Cerebellum, Basal Ganglia, and Cortex. Cerebellum (London, England), 16, 203–229. - PMC - PubMed

Publication types