. 2020 Apr;32(4):1240-1269.
doi: 10.1105/tpc.19.00628. Epub 2020 Jan 30.

Chlamydomonas CHT7 Is Required for an Effective Quiescent State by Regulating Nutrient-Responsive Cell Cycle Gene Expression

Affiliations

Chlamydomonas CHT7 Is Required for an Effective Quiescent State by Regulating Nutrient-Responsive Cell Cycle Gene Expression

Tomomi Takeuchi et al. Plant Cell. 2020 Apr.

Abstract

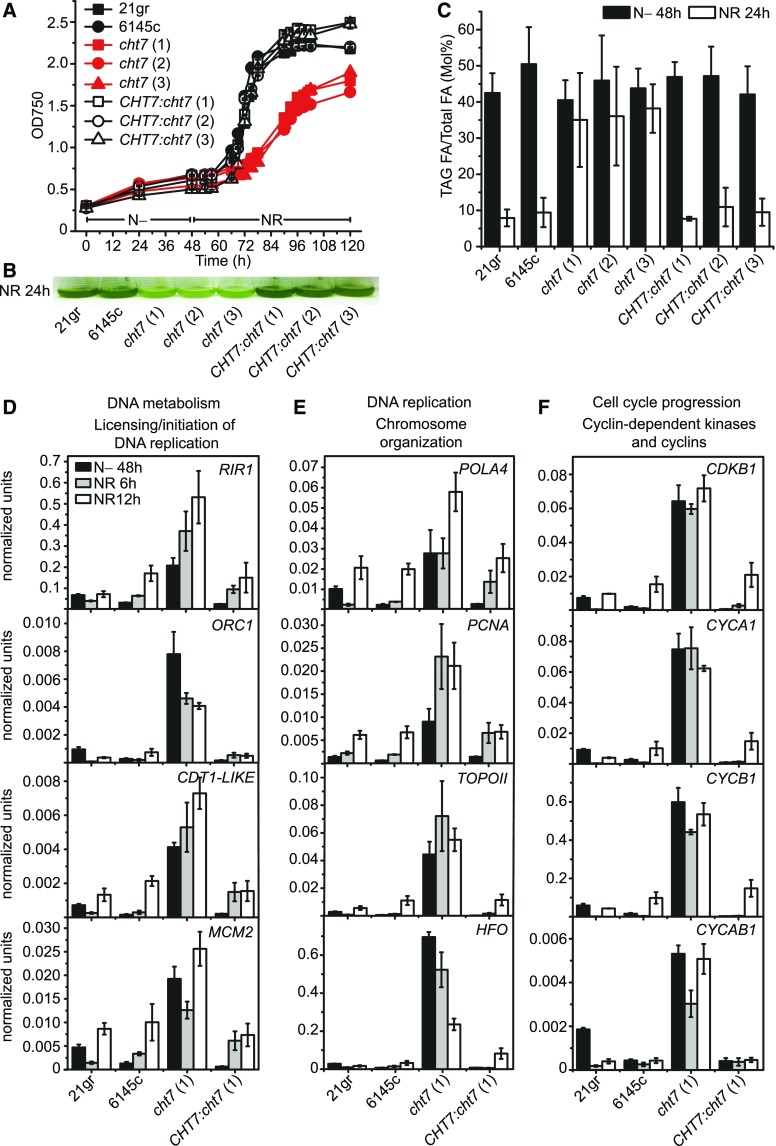
COMPROMISED HYDROLYSIS OF TRIACYLGLYCEROLS7 (CHT7) in Chlamydomonas (Chlamydomonas reinhardtii) was previously shown to affect the transcription of a subset of genes during nitrogen (N)-replete growth and following N refeeding. Here, we show that an extensive derepression of genes involved in DNA metabolism and cell cycle-related processes, as well as downregulation of genes encoding oxidoreductases and nutrient transporters, occurs in the cht7 mutant during N deprivation. Cellular mutant phenotypes are consistent with the observed transcriptome misregulation, as cht7 cells fail to properly arrest growth, nuclear replication, and cell division following N deprivation. Reduction in cht7 colony formation following N refeeding is explained by its compromised viability during N deprivation and by the occurrence of abortive divisions during N refeeding. Surprisingly, the largely unstructured C-terminal half of CHT7 with predicted protein binding domains, but not the canonical CXC DNA binding domain, is essential for the ability of CHT7 to form stable complexes and reverse the cellular phenotypes and transcription levels in the cht7 mutant. Hence, although lacking the presumed DNA binding domain, CHT7 modulates the expression of cell cycle genes in response to N availability, which is essential for establishing an effective quiescent state and the coordinated resumption of growth following N refeeding.


Figures

Figure 1.
Figure 1.
Transcriptomes of PL and the cht7 Mutant following N Deprivation. (A) to (D) Coexpression networks of significantly down- or upregulated genes in N− PL/N+ PL (see [A] and [B]) and N− cht7/N− PL comparisons (see [C] and [D]) using a twofold expression change cutoff and an adjusted P-value of <0.05. Each node represents a gene, and two nodes are connected by an edge if the corresponding genes show significant coexpression (defined by the absolute Pearson’s correlation coefficient > 0.90) across different physiological conditions integrated into ChlamyNET. Nodes are colored according to the cluster to which they belong, and the GO-terms enriched within each cluster, as described by Romero-Campero et al. (2016), are listed to the right. N−, N deprived; N+, N replete. (E) and (F) GO-slim terms enriched among the down- (968) and upregulated (2753) genes in N− cht7/N− PL comparison using the Fisher’s exact test and P < 0.05. The whole Chlamydomonas genome was used as a reference set, and the same criteria as above were used to define significant differential expression in the test set. GO IDs and p- and q-values for the GO-slim terms shown are provided in Supplemental Data Set 1.
Figure 2.
Figure 2.
Derepression of S/M Phase Genes in the cht7 Mutant Becomes More Apparent during N Deprivation. Log2 FC values of 108 curated genes involved in the synthesis, licensing, initiation, and replication of DNA, chromosome organization and segregation, cell cycle progression, and chloroplast division are shown for different comparisons across various N conditions. Columns 1, 4, 5, and 6 show relative differences in gene expression under the same growth conditions when the cht7 mutant is compared to the PL line during N-replete growth (1) and following N deprivation for 48 h (4) and N resupply for 6 h (5) or 12 h (6). In column 2, PL following N deprivation is compared to PL during N-replete growth, and in column 3, cht7 following N deprivation is compared to cht7 during N-replete growth. Boxes are grayed out when log2 FC values were absent from the RNA-seq data sets. Gene model IDs, log2 FC expression, and adjusted P-values, in addition to the reads per kilobase of transcript per million mapped reads values for the genes shown are provided in Supplemental Data Set 2. N−, N deprived; N+, N replete; NR, N resupply.
Figure 3.
Figure 3.
Phenotypes of cht7 and RT-qPCR Analyses of Genes Involved in DNA Replication and Cell Cycle–Related Processes following N Deprivation and N Resupply. (A) Growth of the wild types (21gr and 6145c), cell-walled cht7 (1 to 3), and their CHT7:cht7 (1 to 3) complemented lines during N deprivation followed by N resupply. Values represent the averages and the sds of two biological replicates. (B) Photo of these cultures after 24 h of N resupply following 48 h of N deprivation. (C) Degradation of TAG after 24 h of N resupply following 48 h of N deprivation. Values represent the averages and sds of three biological replicates. FA, fatty acids. (D) to (F) Expression levels of representative genes were assessed by RT-qPCR in the wild types, cht7 (1), and CHT7:cht7 (1) after 48 h of N deprivation and following N resupply for 6 and 12 h. These include genes involved in deoxyribonucleotide synthesis and licensing/initiation of DNA replication (D), DNA replication and chromosome organization (E), and the regulation of cell cycle progression (F). Values represent the averages and the ses of three biological replicates. Target gene expression was normalized to the CBLP gene. Full names of the genes tested are given in the main text. In (A), (C), and (D) to (F), biological replicates refer to respective lines in separate flasks.
Figure 4.
Figure 4.
Abnormal Cytology of cht7 following N Deprivation and upon N Resupply. (A) and (C) Confocal microscopy images of the wild types (21gr and 6145c), cht7 (1), and CHT7:cht7 (1) complemented line after 48 h of N deprivation (A) or after 24 h of N resupply following 48 h of N deprivation (C). The white arrowheads point to the presence of multiple nuclei (A) or a terminated daughter cell enclosed within the mother cell wall (C) in cht7 (1). DAPI signals indicating nuclei are shown in blue, whereas chlorophyll autofluorescence (Chl) is shown in red. Bars = 10 μm. BF, bright field. (B) and (D) Quantification of the observed phenotypes in the confocal images of the wild-type (21gr and 6145c), cht7 (1 to 3), and CHT7:cht7 (1 to 3) cells following 48 h of N deprivation (B) or after 24 h of N refeeding following 48 h of N deprivation (D). Whereas the percentages of population with multiple nuclei (per cell or per dividing mother cell) were assessed in (B), the percentages of population that underwent abnormal division (defined as the presence of one or more terminated daughter cell(s) enclosed within the mother cell wall) were quantified in (C). For each independent line, ∼50 to 150 cells were assessed.
Figure 5.
Figure 5.
Viability Assessments of cht7 (1 to 3) Mutants following N Deprivation. (A) Percent colony formation assessed for the wild types (21gr and 6145c), cht7 (1 to 3), and CHT7:cht7 (1 to 3) complemented lines after growth for 7 d on N-replete TAP plates. Prior to plating, the cultures were N deprived for the times indicated on the x axis. Values represent the averages and sds of two biological replicates. (B) Viability assessment of the same set of lines by SYTOX Green stain during N deprivation. Values represent the averages and the sds of two to four biological replicates. In both (A) and (B), biological replicates refer to respective lines cultured in separate flasks across two to four independent experiments.
Figure 6.
Figure 6.
Single Cell Tracking of the cht7 Mutant during N Resupply following 48 h of N Deprivation. Cells were N deprived in liquid culture for 48 h and then grown for the times indicated on N-replete TAP agar plates. (A) Colony size differences between the wild type 6145c, cht7 (1), and CHT7:cht7 (1) complemented line during growth on N-replete TAP agar plates following 48 h of N deprivation. Bars = 50 μm. (B) Percentage of 6145c, cht7 (1), and CHT7:cht7 (1) cells during growth on N-replete TAP agar plates following 48 h of N deprivation that divide normally (class 1; >64 cells on day 2), divide slowly (class 2; divide normally but contain 32 or fewer cells on day 2), enlarge but division aborts (class 3), or are nonresponsive to nitrogen (class 4; no swelling or division). Approximately 100 to 150 cells of each line were assessed in total. NR, N resupply. (C) Overview of cht7 (1) cells at 0 h (day 0) and 48 h (day 2) of growth on N-replete TAP agar plates following 48 h of N deprivation. (D) Detailed view of individual cht7 (1) cells shown in (C). cht7 (1) cells labeled 1 to 4 were scored as class 4, while cells labeled 5 to 8 were scored as class 3. Bars in (C) and (D) = 20 μm.
Figure 7.
Figure 7.
Deletion of the CHT7 CXC Domain Does Not Disrupt CHT7 Function. (A) Schematic representation of the full-length and deletion clones (N1, N2, ΔCXC) of CHT7-HA. CXC domain, red box. Deletions are indicated by a thin solid line. D, predicted DNA binding site; P1 to P4, predicted protein interacting regions. (B) Immunoblot of independent cht7 (1) transformants expressing the CHT7-HA deletion constructs shown in (A) probed with HA-antibody and later stained with Coomassie Brilliant Blue. (C) to (E) Growth of the wild type 6145c, cht7 (1), empty vector control (pSL18), CHT7-HA complemented line, and N-terminal and CXC domain deletion mutants in cht7 (1) background during N refeeding following 48 h of N deprivation. Photo (D) and TAG degradation of the respective lines after 24 h of N resupply following 48 h of N deprivation (E). For (C) and (E), values represent the averages and the sds of three to seven biological replicates, where they refer to respective lines or independent isolates shown in (B) cultured in separate flasks. FA, fatty acids.
Figure 8.
Figure 8.
Stepwise C-Terminal Deletions of CHT7 Result in a Progressive Decline of Its Functionality. (A) Schematic representation of the full-length and stop-codon insertion mutants (STOP1, STOP2, STOP3, STOP4) of HA-CHT7. CXC domain, red box. Deletions are indicated by a thin solid line. D, predicted DNA binding site; P1 to P4, predicted protein interacting regions. (B) Immunoblot of independent cht7 (1) transformants expressing the HA-CHT7 constructs with prematurely inserted stop codon(s) shown in (A) probed with HA-antibody and later stained with Coomassie Brilliant Blue. (C) Growth of the wild type 6145c, cht7 (1), HA-CHT7 complemented line, and HA-CHT7 STOP mutant lines in the cht7 (1) background during N refeeding following 48 h of N deprivation. (D) TAG content of the respective lines after 24 h of N resupply following 48 h of N deprivation. FA, fatty acids. (E) Visual comparison of CHT7-HA N-terminal/CXC domain deletion lines (N1, N2, ΔCXC) and HA-CHT7 C-terminal stop-codon insertion lines (STOP1, STOP2, STOP3, STOP4) with their respective wild type, mutant, and complemented controls after 24 h of N resupply following 48 h of N deprivation. (F) Box plot distributions of percent colony formation assessed for CHT7-HA N-terminal/CXC domain deletion (N1, N2, ΔCXC) lines and HA-CHT7 C-terminal stop-codon insertion (STOP1, STOP2, STOP3, STOP4) lines with their respective controls during N-replete growth (gray boxes) or following 48 h of N deprivation (red boxes) after 7 d of growth on N-replete TAP plates. For (C) and (D), values represent the averages and the sds of three to seven biological replicates, where they refer to respective lines or independent isolates shown in (B) cultured in separate flasks. For (F), box plot distributions represent percent colony formation calculated from 9 to 12 platings of respective lines or isolates performed across three to four independent experiments.
Figure 9.
Figure 9.
The Deletion of Amino Acid Residues within the P3 Region Alone Leads to a Near Complete Loss of CHT7 Function. (A) Schematic representation of the full-length and ΔP2, ΔP3, and ΔP4 deletion mutants of HA-CHT7. CXC domain, red box. Deletions are indicated by a thin solid line. D, predicted DNA binding site; P1 to P4, predicted protein interacting regions. (B) Immunoblot of independent cht7 (1) transformants expressing the HA-CHT7 ΔP2, ΔP3, or ΔP4 deletion constructs shown in (A) probed with HA-antibody and later stained with Coomassie Brilliant Blue. (C) Growth of the wild type 6145c, cht7 (1), HA-CHT7 complemented line, and HA-CHT7 ΔP2, ΔP3, and ΔP4 deletion lines in the cht7 (1) background during N refeeding following 48 h of N deprivation. (D) TAG content of the same lines after 24 h of N resupply following 48 h of N deprivation. FA, fatty acids. (E) Visual comparison of the wild type, cht7 (1), HA-CHT7 complemented line, and HA-CHT7 ΔP2, ΔP3, and ΔP4 deletion lines after 24 h of N resupply following 48 h of N deprivation. (F) Box plot distributions of percent colony formation assessed for HA-CHT7 ΔP2, ΔP3, and ΔP4 deletion lines and their respective controls during N-replete growth (gray boxes) or following 48 h of N deprivation (red boxes) after 7 d of growth on N-replete TAP plates. For (C) and (D), values represent the averages and the sds of three to seven biological replicates, where they refer to respective lines or independent isolates shown in (B) cultured in separate flasks. For (F), box plot distributions represent percent colony formation calculated from 9 to 45 platings of respective lines or isolates performed across three independent experiments.
Figure 10.
Figure 10.
RT-qPCR Analyses of Representative Cell Cycle Marker Genes in cht7 (1) Transformants Producing Various Mutated HA-Tagged Versions of CHT7. (A) and (B) Expression levels of (A) CDKB1, CYCA1 and CYCB1 and (B) CYCAB1, ORC1, and CDC45 genes in the wild type 6145c, cht7 (1), CHT7-HA N terminus and CXC domain deletion lines (N1, N2, ΔCXC), HA-CHT7 C terminus truncation lines (via stop-codon insertions; STOP1, STOP2, STOP3, STOP4), P2 to P4 deletion lines (ΔP2, ΔP3, ΔP4), and the respective full-length complemented HA-tagged CHT7 lines in the cht7 (1) background following 48 h of N deprivation. Values represent the averages and the ses of three to five biological replicates, where they refer to representative isolates cultured in separate flasks sampled across two independent experiments. Target gene expression was normalized to the CBLP gene. Full names of the genes tested are given in the main text.
Figure 11.
Figure 11.
Assessment of Protein Complex Formation and Abundance in Various HA-Tagged Mutated CHT7:cht7 Lines. (A) and (B) Total protein extracts of N-replete CHT7-HA:cht7, cht7 (1), and respective N-terminal and CXC deletion CHT7-HA cells prepared under native conditions were separated on BN-PAGE (A) or denatured and then separated on SDS-PAGE (B) and subjected to immunoblotting. Twenty-five micrograms of total protein was loaded per lane, and blots were probed with HA-antibody. (C) Quantification of CHT7 protein and complex abundance in the respective lines. Signals from the BN-PAGE and SDS-PAGE immunoblots were first normalized against loading (i.e., intensity from a lane or band from the Coomassie Brilliant Blue–stained membrane) and then normalized to the respective HA-tagged CHT7:cht7 complemented lines. (D) to (F) Similar BN-PAGE (D), SDS-PAGE (E), and quantification (F) analyses were performed using HA-CHT7:cht7, cht7 (1), HA-CHT7 C-terminal truncation lines (STOP1, STOP2, STOP3, STOP4) and P2, P3, and P4 deletion lines. For (C) and (F), values represent the averages and sds of three to four independent experiments. For (A) and (B) and (D) and (E), representative blots from one experimental set are shown.
Figure 12.
Figure 12.
Model of CHT7 Function in Response to N Availability. (A) Hypothesized role of CHT7 in mediating repression of the S/M phase–related genes in response to N starvation. CHT7 and unknown component(s) X represent the most abundant CHT7 complex (CHT7-C) that is observed by BN-PAGE during N-replete growth and following N deprivation that do not change in size (Tsai et al., 2014). In response to signals that promote quiescence (left diagram), some fraction of CHT7-C is postulated to form a repressor complex with transcription factor(s) to repress S/M phase gene expression. The dotted double-sided arrows indicate signals that are hypothesized to either directly or indirectly affect CHT7. When the conditions for mitotic entry are met (right diagram), the repression of S/M phase genes is lifted. This is depicted by the changes in CHT7-C status and the absence of transcription factor(s) for simplicity. TF, transcription factor(s). (B) Wild-type CHT7-containing repressor complex coordinates an appropriate entry into and exit from the quiescent state in response to changing N availability by repressing S/M phase genes until cells reach an appropriate stage of the cell division cycle. Entry into and exit out of the quiescence cycle is depicted by the left circle, and one round of division that the postcommitment wild-type cells go through after N starvation before exiting the cell division cycle is represented by the right circle: C, commitment point; G0PM, postmitotic resting state; G0Q, N deprivation–induced quiescence. (C) In the absence of CHT7, the repressor complex does not form, and the cht7 mutant cells therefore lose their ability to mediate the orderly and cell cycle–stage appropriate repression of S/M phase genes when presented with cues to cease growth and cell division. This compromised state of quiescence in the mutant is represented by G0QΔ, where the constitutive expression of S/M phase genes that occurs despite the absence of external N likely leads to the abnormal cell division cycle exit or arrest and contributes to the reduced viability of cht7 cells both during N deprivation and N refeeding.
None

Comment in

Similar articles

Cited by

References

    1. Aoki K., Ogata Y., Shibata D.(2007). Approaches for extracting practical information from gene co-expression networks in plant biology. Plant Cell Physiol. 48: 381–390. - PubMed
    1. Aoki Y., Okamura Y., Ohta H., Kinoshita K., Obayashi T.(2016). ALCOdb: Gene coexpression database for microalgae. Plant Cell Physiol. 57: e3. - PMC - PubMed
    1. Atkins K.C., Cross F.R.(2018). Interregulation of CDKA/CDK1 and the plant-specific cyclin-dependent kinase CDKB in control of the Chlamydomonas cell cycle. Plant Cell 30: 429–446. - PMC - PubMed
    1. Bassel G.W., Lan H., Glaab E., Gibbs D.J., Gerjets T., Krasnogor N., Bonner A.J., Holdsworth M.J., Provart N.J.(2011). Genome-wide network model capturing seed germination reveals coordinated regulation of plant cellular phase transitions. Proc. Natl. Acad. Sci. USA 108: 9709–9714. - PMC - PubMed
    1. Beall E.L., Manak J.R., Zhou S., Bell M., Lipsick J.S., Botchan M.R.(2002). Role for a Drosophila Myb-containing protein complex in site-specific DNA replication. Nature 420: 833–837. - PubMed

Publication types

MeSH terms