. 2020 Mar 13;367(6483):eaax7171.
doi: 10.1126/science.aax7171. Epub 2020 Jan 30.

Cerebrospinal fluid influx drives acute ischemic tissue swelling

Affiliations

Cerebrospinal fluid influx drives acute ischemic tissue swelling

Humberto Mestre et al. Science. .

Abstract

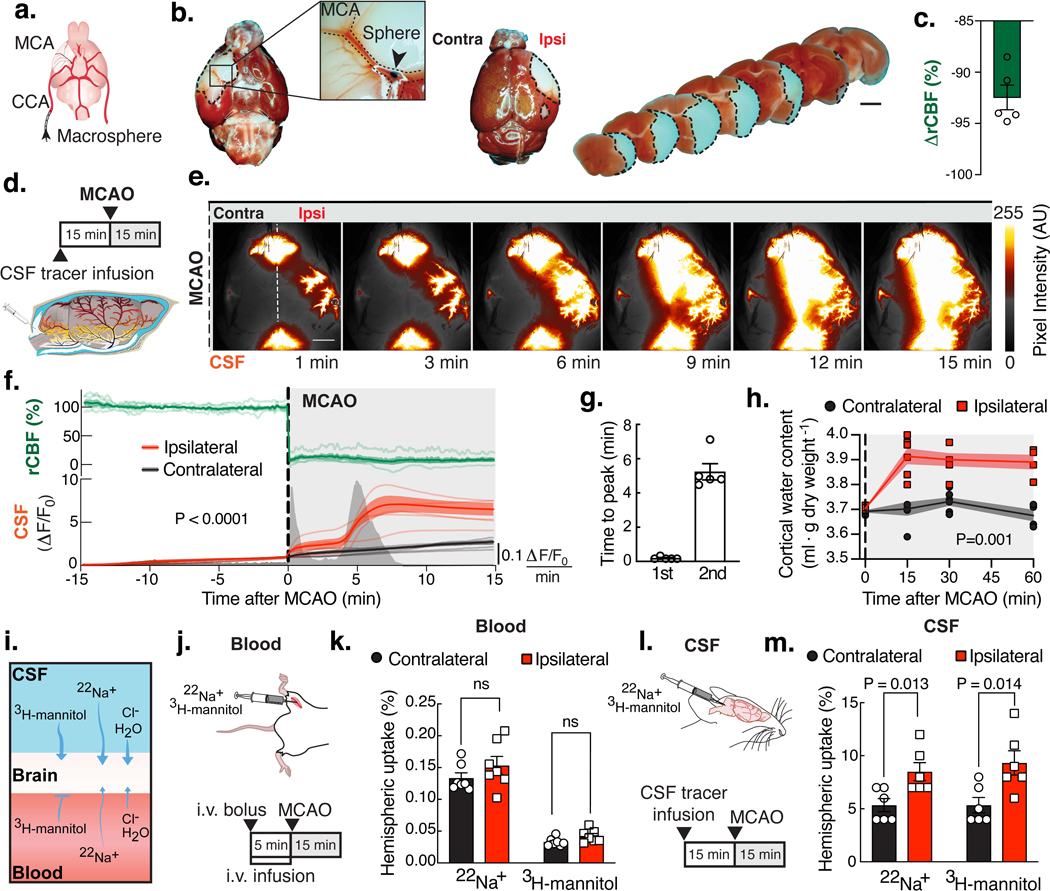
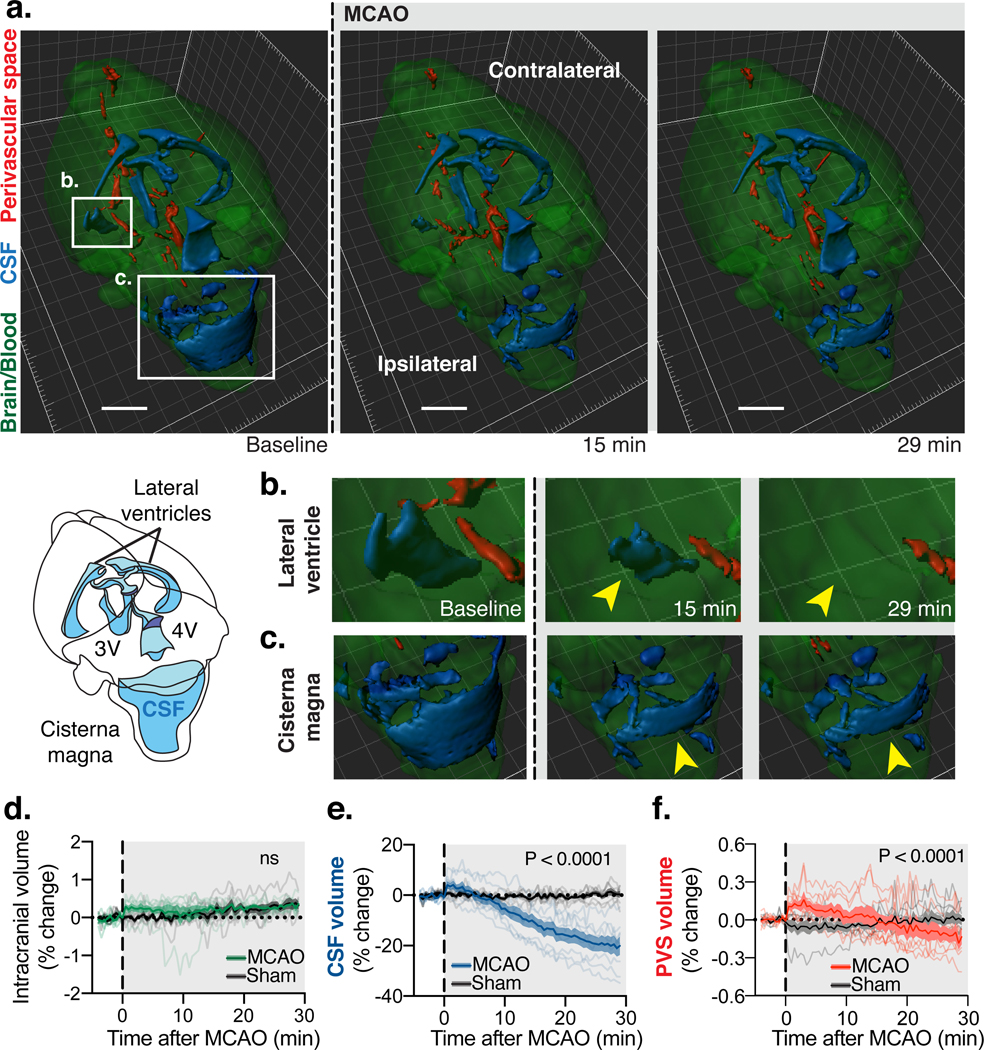
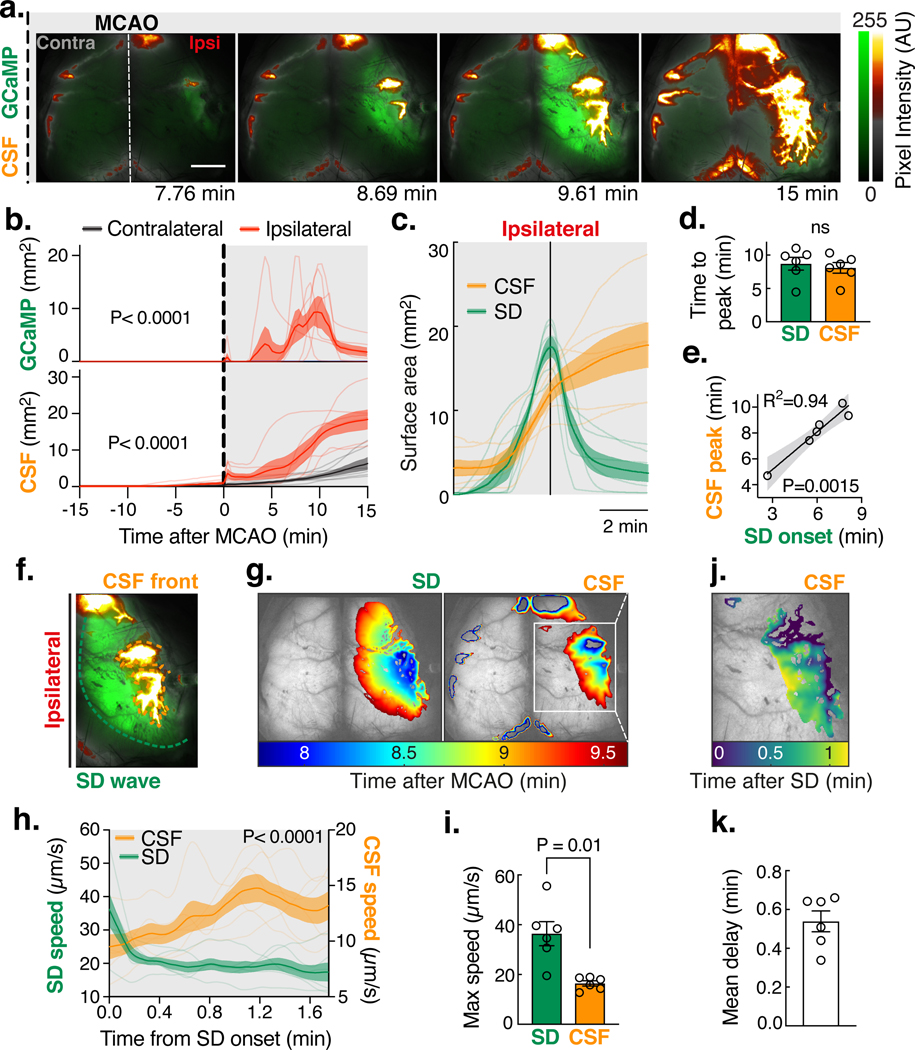
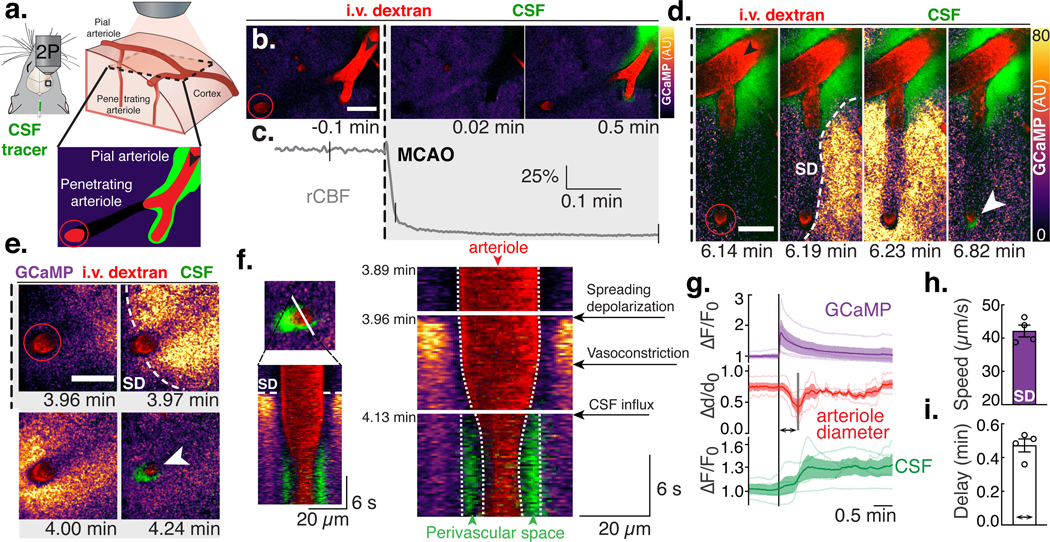
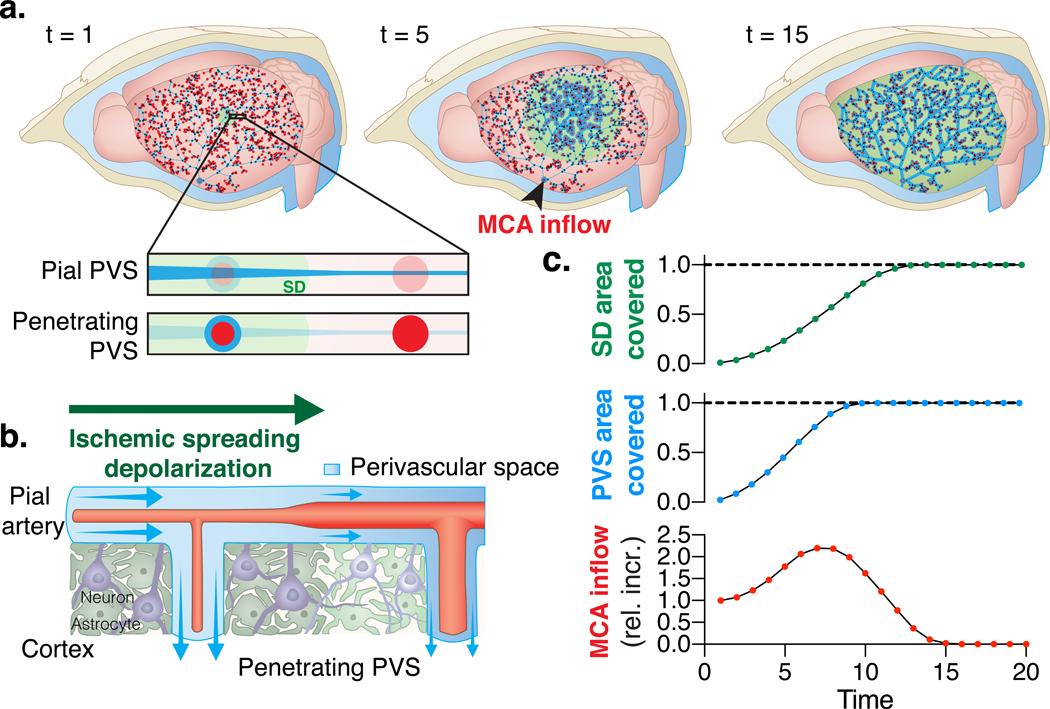
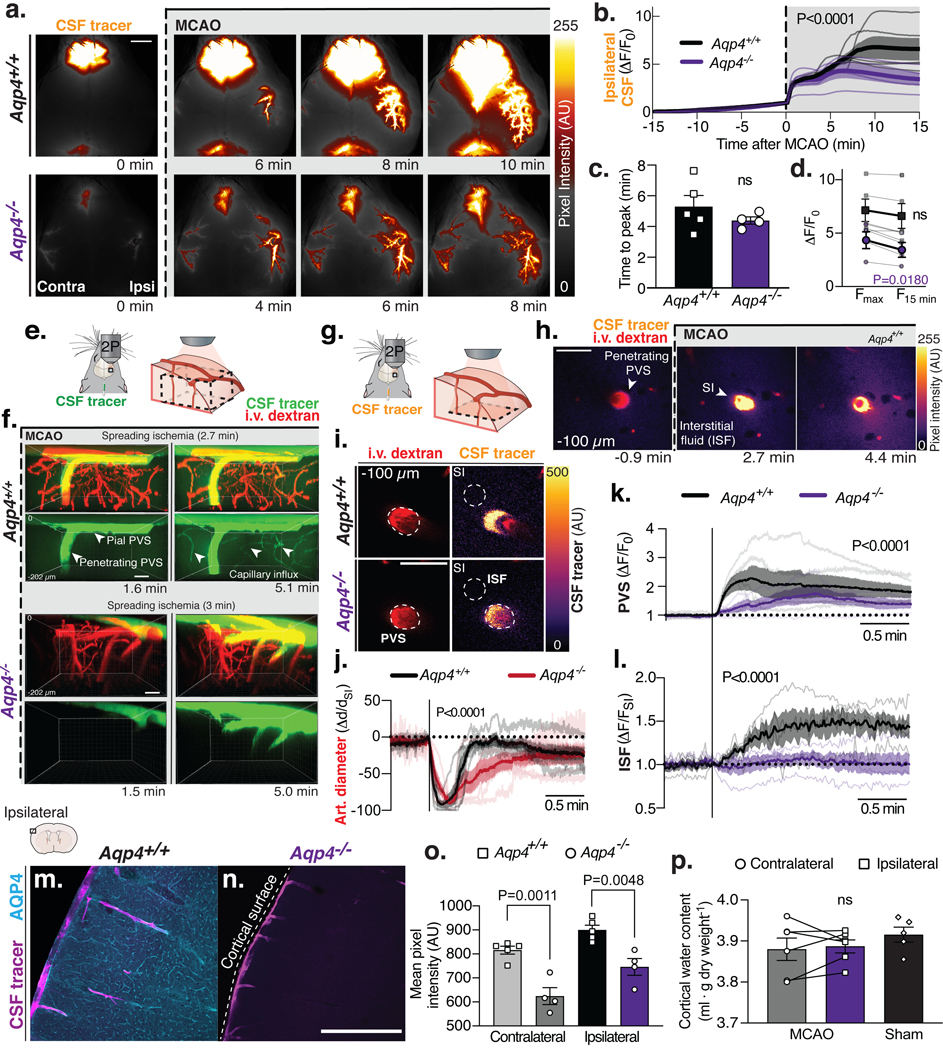
Stroke affects millions each year. Poststroke brain edema predicts the severity of eventual stroke damage, yet our concept of how edema develops is incomplete and treatment options remain limited. In early stages, fluid accumulation occurs owing to a net gain of ions, widely thought to enter from the vascular compartment. Here, we used magnetic resonance imaging, radiolabeled tracers, and multiphoton imaging in rodents to show instead that cerebrospinal fluid surrounding the brain enters the tissue within minutes of an ischemic insult along perivascular flow channels. This process was initiated by ischemic spreading depolarizations along with subsequent vasoconstriction, which in turn enlarged the perivascular spaces and doubled glymphatic inflow speeds. Thus, our understanding of poststroke edema needs to be revised, and these findings could provide a conceptual basis for development of alternative treatment strategies.


Figures

Fig. 1.
Fig. 1.. CSF rapidly enters the brain after stroke resulting in edema.
(A) Macrospheres (arrow) were infused into the common carotid artery (CCA), occluding the middle cerebral artery (MCA). (B) TTC staining after MCA occlusion (MCAO). (C) Ipsilateral relative cerebral blood flow (rCBF) after MCAO. (D) Intracisternal BSA-647 was infused 15min prior to MCAO. (E) Ipsilateral (Ipsi) and contralateral (Contra) tracer influx was imaged while measuring rCBF (white line: sagittal suture and fiber optic probe), arbitrary units (AU). (F) Time series of rCBF and fluorescence intensity (ΔF/F0) in each hemisphere. Peaks are mean rate of change in fluorescence intensity over time. Repeated measures two-way ANOVA, interaction P value; n=5 mice. (G) Timing of the 1st and 2nd peak. (H) Water content of the cortex. Mixed-effects repeated measures two-way ANOVA with Sidak’s multiple comparisons test; n=4–7 mice/time point. (I) The source of the edema fluid was identified by labeling either the blood or CSF compartment. (J) 22Na+ and 3H-mannitol were delivered intravenously (i.v.). (K) Percent of the total injected radiation found in each hemisphere after i.v. delivery. T-tests with Holm-Sidak correction; n=7 mice. (L) Isotopes were delivered into CSF. (M) Percent of the total injected radiation in each hemisphere after intracisternal delivery. T-tests with Holm-Sidak correction; n=6 mice. Scale bars: 2mm.
Fig. 2.
Fig. 2.. After MCAO, CSF shifts into other intracranial compartments.
(A) 3D-fast imaging employing steady-state acquisition (FIESTA) shows three main compartments: 1) Intraventricular CSF in the lateral, 3rd (3V) and 4th (4V) ventricles and cisternal CSF in the cisterna magna (blue); 2) free fluid in the perivascular spaces (PVS; red) of the Circle of Willis along the anterior, middle, posterior cerebral, and the basilar arteries; 3) Intracranial content primarily composed of brain tissue and cerebral blood volume (green). 3D-FIESTA at baseline before MCAO and 15 and 29 min later. Scale bar: 2 mm. Insets of (A) of the (B) ventral anterior horn of the ipsilateral lateral ventricle and the (C) cisterna magna demonstrate the loss of free water at 15 min and 29 min after MCAO most notably in the lateral ventricles and the cisternal magna (yellow arrows). (D) Percent change of intracranial volume after MCAO and in sham animals. Repeated measures two-way ANOVA; interaction P value. (E) Percent change of CSF volume after MCAO. Repeated measures two-way ANOVA; interaction P value. (F) Percent change of PVS volume after MCAO. Repeated measures two-way ANOVA; interaction P value; Time-lapse measurements from n= 7 mice in Sham and 8 mice in MCAO group.
Fig. 3.
Fig. 3.. CSF influx is triggered by spreading depolarizations (SD) after focal ischemia.
(A) A fluorescent CSF tracer (BSA-594) was delivered into the cisterna magna of Glt1-GCaMP7 mice 15 min before MCAO and imaged using a dual channel macroscope for 15 min as done in Fig. 1d. Pixel intensity in arbitrary units (AU). Scale bar: 2 mm. (B) Area covered by GCaMP and CSF tracer fluorescence. Repeated measures two-way ANOVA with Sidak’s multiple comparisons test; interaction P value; n=6 mice. (C) CSF tracer surface area aligned to the SD (GCaMP) peak. (D) Time to peak influx rate for the SD (GCaMP) and the CSF tracer. Paired t-test. (E) Linear regression of CSF peak influx and SD onset time with 95% confidence intervals. (F) The fronts of the ipsilateral SD wave and the CSF tracer were tracked. (G) Area covered by the SD (left panel) and the CSF tracer (right panel) over time. (H) Front speed of the SD wave and the CSF front. Repeated measures two-way ANOVA with Sidak’s multiple comparisons test; interaction P value. (I) Maximum speed of the SD and CSF front. Paired t-test. (J) Delay time between the SD wave and the CSF tracer front. (K) Mean delay between the SD and CSF front.
Fig. 4.
Fig. 4.. Spreading ischemia after spreading depolarization drives perivascular CSF influx.
(A) Pial (black arrows) and penetrating arterioles (red circles, 40–50 μm below surface), branches of the ipsilateral MCA were imaged using two-photon (2P) microscopy. (B) Pial and penetrating arteriole (i.v. dextran) in a Glt1-GCaMP7 mouse after receiving an intracisternal tracer injection (BSA-647) during MCAO. Scale bars (B-E): 50 μm. (C) Relative cerebral blood flow (rCBF) measurements; ticks align with images in (B). (D) Spreading depolarization (SD) after MCAO. Normalized GCaMP fluorescence (ΔF-Faverage) is color-coded for pixel intensity and displayed in arbitrary units (AU). (E) Constriction of penetrating arteries after SD causes tracer influx into brain (white arrow). (F) Line scan over the penetrating arteriole in (E) depicting the appearance of the SD, the subsequent vasoconstriction and the CSF tracer influx filling the perivascular space left by the constricted arteriole. (G) Quantification of GCaMP and CSF tracer fluorescence (ΔF/F0) and arteriole diameter (Δd/d0) aligned to the onset of the SD; n=4 mice. (H) SD wave speed. (I) Delay time between SD onset and minimum arteriolar diameter.
Fig. 5.
Fig. 5.. Topological glymphatic network model of perivascular spaces around the mouse middle cerebral artery (MCA).
(A) Network model representing a system of interconnected perivascular spaces (PVS) surrounding the mouse pial MCA at different time points (t) during an ischemic spreading depolarization (SD; green). Pial PVS are depicted as blue lines that get wider during spreading ischemia. Penetrating arteries are depicted as red circles and the blue circle surrounding it signifies an increase in the area of the penetrating PVS as the arteriole constricts after SD. The simulation evaluated the relative increase (rel. incr.) in baseline flow at the inlet of the MCA (MCA inflow; black arrow). (B) Pial and penetrating PVS area increases as the arteries constrict due to the passage of a SD, thus increasing the fluid volume in the network. Conservation of mass controls the resulting MCA inflow, (C) resulting in a net increase in fluid volume in the network. Dashed line represents the tissue border of the cortical surface. The SD travels over the entire cortex spanning an area larger than that covered by the MCA network.
Fig. 6.
Fig. 6.. CSF-mediated edema after MCAO is dependent on aquaporin-4 (AQP4) expression.
(A) Transcranial imaging after intracisternal tracer injection (BSA-647) in Aqp4+/+ and Aqp4−/− mice. (B) Quantification of ipsilateral CSF tracer influx (ΔF/F0). Two-way repeated measures ANOVA, P value from interaction term; n=4–5 mice/genotype. (C) Time of CSF influx peak. Unpaired t-test. (D) Change in maximum ΔF/F0 (Fmax) to 15 min after MCAO (F15 min). Paired t-test. (E-F) Volumetric two-photon imaging shows CSF tracer (3kDa dextran) entering brain via surface and penetrating perivascular spaces (PVS) in Aqp4+/+ and Aqp4−/− mice. After spreading ischemia (SI) the tracers were also found surrounding capillaries only in Aqp4+/+. (G) Time-lapse 2-photon imaging of a penetrating arteriole 100 μm below the cortical surface. (H) Tracer enters the interstitial fluid (ISF) after SI. (I) CSF tracer entered the penetrating PVS of both Aqp4+/+ and Aqp4−/− mice. (J) Penetrating arteriolar (art.) diameter changes after MCAO. Tracer influx was quantified in the (K) penetrating PVS and the (L) ISF neighboring the same PVS; 1 PVS/mouse; n=4–5 mice/genotype. (M) Immunohistochemical labeling for AQP4 from ipsilateral dorsal cortex of Aqp4+/+ and (N) Aqp4−/− after CSF tracer injection. (O) Mean pixel intensity from 6 coronal sections from 4–5 mice/genotype. (P) Cortical water content 15 min after MCAO or bilateral cortices from sham-treated Aqp4−/− mice; paired t-test; n=5–6 mice/group; ns: not significant. Scale bars: (A) 2mm, (F-I) 50μm, (M-N) 500μm.

Comment in

References

    1. Benjamin EJ et al., Heart Disease and Stroke Statistics-2019 Update: A Report From the American Heart Association. Circulation 5; 139, e56–e528 (2019). - PubMed
    1. Feigin VL et al., Update on the Global Burden of Ischemic and Hemorrhagic Stroke in 1990–2013: The GBD 2013 Study. Neuroepidemiology 45, 161–176 (2015). - PMC - PubMed
    1. Iadecola C, Anrather J, Stroke research at a crossroad: asking the brain for directions. Nat Neurosci 14, 1363–1368 (2011). - PMC - PubMed
    1. Rungta RL et al., The cellular mechanisms of neuronal swelling underlying cytotoxic edema. Cell 161, 610–621 (2015). - PubMed
    1. Simard JM, Kent TA, Chen M, Tarasov KV, Gerzanich V, Brain oedema in focal ischaemia: molecular pathophysiology and theoretical implications. Lancet Neurol 6, 258–268 (2007). - PMC - PubMed

Publication types