. 2020 Jan 30;11(1):75.
doi: 10.1038/s41419-020-2228-3.

Two faces of bivalent domain regulate VEGFA responsiveness and angiogenesis

Affiliations

Two faces of bivalent domain regulate VEGFA responsiveness and angiogenesis

Jiahuan Chen et al. Cell Death Dis. .

Abstract

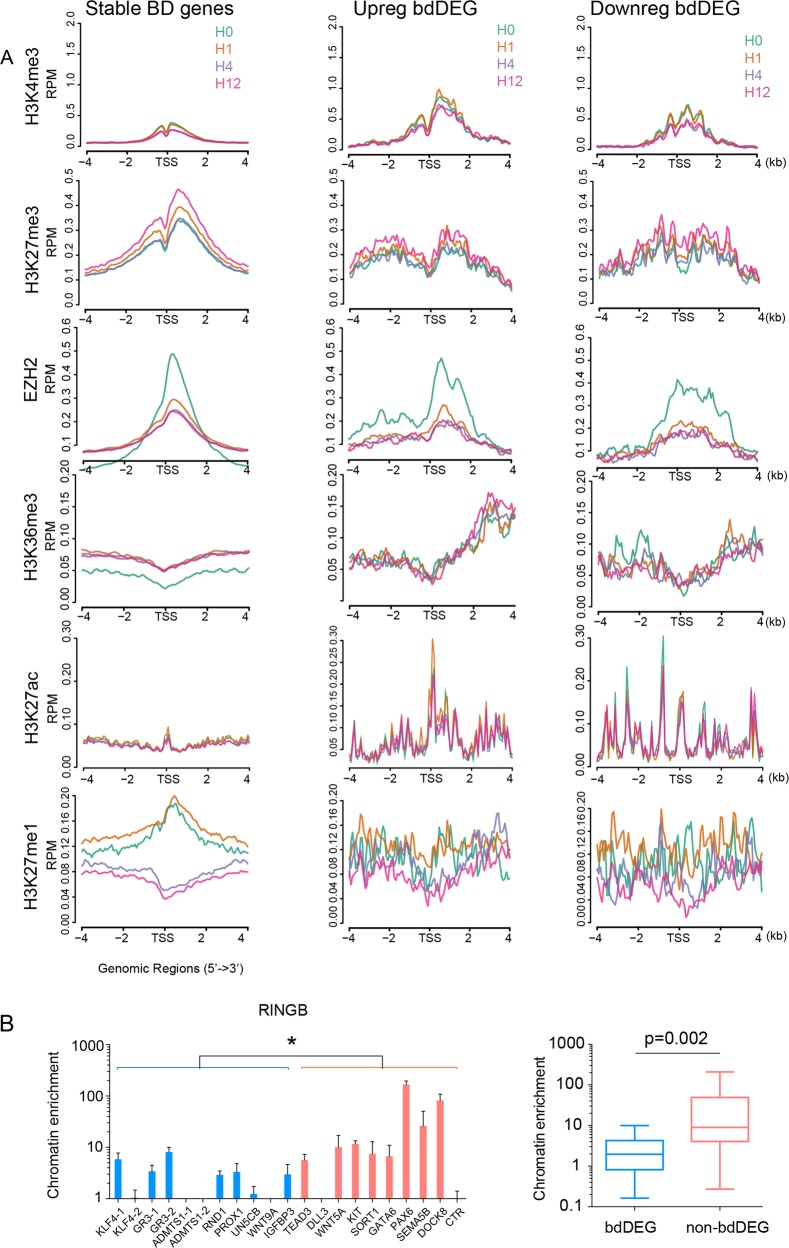
The bivalent domain (BD) at promoter region is an unique epigenetic feature poised for activation or repression during cell differentiation in embryonic stem cell. However, the function of BDs in already differentiated cells remains exclusive. By profiling the epigenetic landscape of endothelial cells during VEGFA (vascular endothelial growth factor A) stimulation, we discovered that BDs are widespread in endothelial cells and preferentially marked genes responsive to VEGFA. The BDs responsive to VEGFA have more permissive chromatin environment comparing to other BDs. The initial activation of bivalent genes depends on RNAPII pausing release induced by EZH1 rather than removal of H3K27me3. The later suppression of bivalent gene expression depended on KDM5A recruitment by its interaction with PRC2. Importantly, EZH1 promoted both in vitro and in vivo angiogenesis by upregulating EGR3, whereas KDM5A dampened angiogenesis. Collectively, this study demonstrates a novel dual function of BDs in endothelial cells to control VEGF responsiveness and angiogenesis.


Conflict of interest statement

The authors declare that they have no conflict of interests.

Figures

Fig. 1
Fig. 1. DEGs were enriched at BDs.
a The correlation between histone clusters and DEG. The left heatmap is the K-means clusters of four different histone marks (H3K4me3, H3K4me2, H3K27ac, and H3K27me3). The middle and the right heatmaps represent the enrichment of DEGs in the set of all genes and BD genes, respectively, at divergent histone clusters by Fisher’s exact test. The text on the right side described the number of TSS, DEG, and bdDEG within each cluster. b Tag heatmaps of H3K4me3 and H3K27me3 at all BDs called by H3K27me3 and H3K4me3 peak overlap. c Venn diagram showing the overlap between DEGs and BD genes. We found 69 DEGs were marked by BD, a highly significant enrichment compared to expectations of randomness. Chi-squared test: P < 0.05 indicated significance. d Heatmap of bdDEGs from RNA-seq, grouped into three clusters: downregulated genes (blue), early-upregulated genes (red), and late-upregulated genes (jasper). Representative genes within each cluster are listed on the right. e Snapshot of Integrative Genomics Viewer of histone marks, RNAPII, and transcribed RNA near EGR3, a bdDEG that was rapidly and transiently upregulated by VEGFA.
Fig. 2
Fig. 2. Chromatin features of bdDEG at TSS.
a Aggregation plots of histone modifications near promoters of all BD genes (left) and upregulated (middle) or downregulated (right) bdDEGs. b RINGB chromatin occupancy at BD genes that were (bdDEG, blue) or were not (non-bdDEG, megenta) differentially expressed, as measured by ChIP-qPCR. Box plot on the right summarizes the chromatin enrichment of RINGB at each class of genes; n = 4 for each gene loci, Mann–Whitney U test.
Fig. 3
Fig. 3. VEGFA treatment increased the occupancy of EZH1 complex at upregulated bdDEG.
a, b UTX a and JMJD3 b chromatin occupancy at bdDEG, as measured by ChIP-qPCR. The box plot summarizes the chromatin enrichment of UTX and JMJD3 at each time point; n = 4, *P < 0.05, **P < 0.01. Mann–Whitney U test in summary panels. c Aggregation plot of EZH1 near proximal promoters of all BD genes separated into stable, upregulated, and downregulated groups. d Inhibitory effect of EZH1 siRNA on bdDEGs activation as measured by RT-qPCR. EZH1 in HUVEC was suppressed by EZH1 siRNA and then treated with VEGFA for 1–4 h. EZH1 knockdown abolished the activation of six genes activated by VEGF. Plots show mean ± SD; n = 4, two-tailed Student’s t-test: *P < 0.05 compared to control at the same time point. e EZH1 upregulated bdDEG expression in HUVECs measured by RT-qPCR. Bar plots: mean ± SD, two-tailed Student’s t-test, n = 4, **P < 0.01, ***P < 0.001.
Fig. 4
Fig. 4. EZH1-induced RNAPII pausing release was required for the activation of bdDEG.
a Metagene plot showing RNAPII occupancy of upregulated bdDEG at 0, 1, 4, or 12 h of VEGFA treatment. VEGFA treatment stimulated release of paused RNAPII at 1 h. b The RNAPII PI of downregulated bdDEG (red) and upregulated bdDEG (blue) at hour 0, 1, 4, and 12. c Effect of inhibition of RNAPII pausing release or PRC2 methyltransferase activity on VEGFA activation of bdDEGs, as measured by RT-qPCR. HUVECs were treated with VEGFA and/or small molecule inhibitors (JQ1, flavopiridol, and DZNep) or vehicle (DMSO). Inhibition of RNAPII pause release (JQ1 and flavopiridol) but not PRC2 methyltransferase activity (DZNep) suppressed VEGFA-driven transcriptional activation of the six tested bdDEGs. Plots show mean ± SD; n = 4, two-tailed Student’s t-test: *P < 0.05 compared to control at the same time point. d RNAPII pausing status with or without EZH1 knockdown upon VEGF treatment for 0 or 1 h, as measured by RNAPII ChiP-qPCR. EZH1 siRNA significantly abolished VEGF-induced RNAPII pausing release at four tested genes: IGFBP3, ADAMTS1, DLL4, and EGR3. Plots show mean ± SEM; n = 4.
Fig. 5
Fig. 5. KDM5A facilitated the turning-off of bdDEG.
a KDM5A occupancy of upregulated bdDEG promoters. VEGFA increased KDM5A binding near the TSS of upregulated bdDEG. The right box plot summarizes the change of in chromatin occupancy at each time point for all of the loci probed in the bar graphs to the left. Bars show mean ± SEM; n = 4, unpaired two-tailed Student’s t-test in left panel: *P < 0.05; **P < 0.01. Mann–Whitney U test in the right panel P < 0.05 indicated significant. b Effect of KDM5A or KDM5B inhibition on VEGFA activation of bdDEGs. HUVECs were treated with siRNA against KDM5A or KDM5B, or negative control siRNA (siNC) and then stimulated with VEGFA. Gene expression of four rapidly activated bdDEGs was measured at the indicated time points by RT-qPCR. KDM5A but not KDM5B siRNA sustained bdDEG expression at 4 h after VEGFA treatment, when expression of these genes has normally returned to baseline. Plots show mean ± SEM; n = 4, unpaired two-tailed Student’s t-test: *P < 0.05 compared to siNC at the same time point. c Effect of knockdown of KDM5A or KDM5B on H3K4me3 promoter signal of BD genes rapidly and transiently upregulated by VEGFA. Knockdown of KDM5A but not KDM5B significantly attenuated removal of H3K4me3 at four tested genes at H4. Data are plotted as the mean ± SEM; n = 4, unpaired two-tailed Student’s t-test: *P < 0.05. d Effect of SUZ12 knockdown on KDM5A recruitment to the promoters of BD genes rapidly and transiently upregulated by VEGFA. Knockdown SUZ12 reduced KDM5A enrichment. Data are plotted as the mean ± SEM; n = 4, unpaired two-tailed Student’s t-test: *P < 0.05.
Fig. 6
Fig. 6. The effects of EZH1, EGR3, and KDM5A on neovascularization.
a, b Transwell assay showing EZH1 promoted HUVEC cell migration in culture conditions with or without VEGF, which was abolished by knocking down EGR3. a Migrated HUVECs on the transwell membrane revealed by crystal violet staining. b Calculation of migrated cells per field. Plots: mean ± SD, **P < 0.01; ***P < 0.001; n = 6, unpaired two-tailed Student’s t-test. c Proliferation of HUVECs measured by the CCK8 method. The suppression of EZH1 abolished VEGF-induced HUVEC cell proliferation, which was reversed by addition of EGR3. Suppression of KDM5A enhanced cell proliferation. Bar plots: mean ± SD; n = 5, unpaired two-tailed Student’s t-test, ns no significance, *P < 0.01; **P < 0.01; ***P < 0.001. d Tube formation of HUVECs on Matrigel coat. EZH1 siRNA dampened VEGF-induced tube formation of HUVECs, which was ameliorated by ectopic expression of EGR3; KDM5A suppression augmented VEGF-induced tube formation. Calculation of tube length in each tested group. Bar plots: mean ± SD, n = 4, unpaired two-tailed Student’s t-test, **P < 0.01, ***P < 0.001. e, f Matrigel assay evaluating the in vivo angiogenesis. e Representative images of neovasculature within transplanted Matrigel. UEAI-positive cells (magenta) indicating the wiring vasculature. f Dot plots of vascular density of UEAI-positive vasculature; mean ± SD, n = 5, unpaired two-tailed Student’s t-test, **P < 0.01, ***P < 0.001. g Mechanistic model of BD’s regulation of VEGFA responsiveness.

References

    1. Allis CD, Jenuwein T. The molecular hallmarks of epigenetic control. Nat. Rev. Genet. 2016;17:487–500. doi: 10.1038/nrg.2016.59. - DOI - PubMed
    1. Rice JC, Allis CD. Histone methylation versus histone acetylation: new insights into epigenetic regulation. Curr. Opin. Cell Biol. 2001;13:263–273. doi: 10.1016/S0955-0674(00)00208-8. - DOI - PubMed
    1. Bernstein BE, et al. A bivalent chromatin structure marks key developmental genes in embryonic stem cells. Cell. 2006;125:315–326. doi: 10.1016/j.cell.2006.02.041. - DOI - PubMed
    1. Voigt P, Tee WW, Reinberg D. A double take on bivalent promoters. Genes Dev. 2013;27:1318–1338. doi: 10.1101/gad.219626.113. - DOI - PMC - PubMed
    1. Schuettengruber B, Bourbon HM, Di Croce L, Cavalli G. Genome regulation by Polycomb and Trithorax: 70 years and counting. Cell. 2017;171:34–57. doi: 10.1016/j.cell.2017.08.002. - DOI - PubMed

Publication types

MeSH terms