. 2020 Jan 30;11(1):619.
doi: 10.1038/s41467-020-14373-2.

Cerebrospinal fluid lipocalin 2 as a novel biomarker for the differential diagnosis of vascular dementia

Affiliations

Cerebrospinal fluid lipocalin 2 as a novel biomarker for the differential diagnosis of vascular dementia

Franc Llorens et al. Nat Commun. .

Abstract

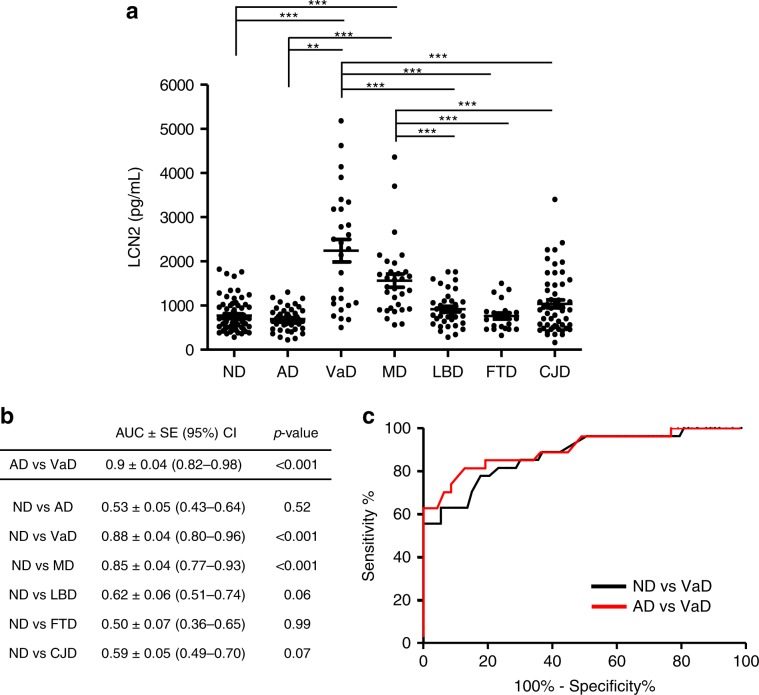
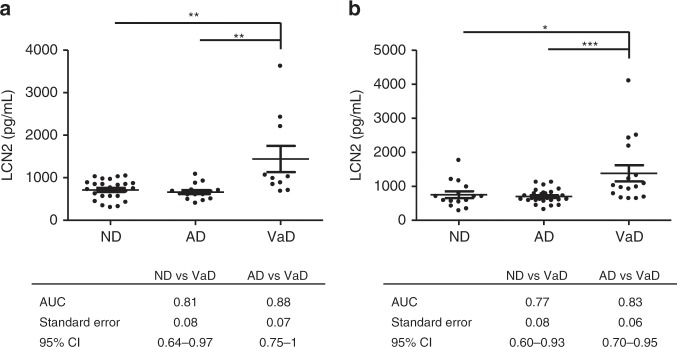
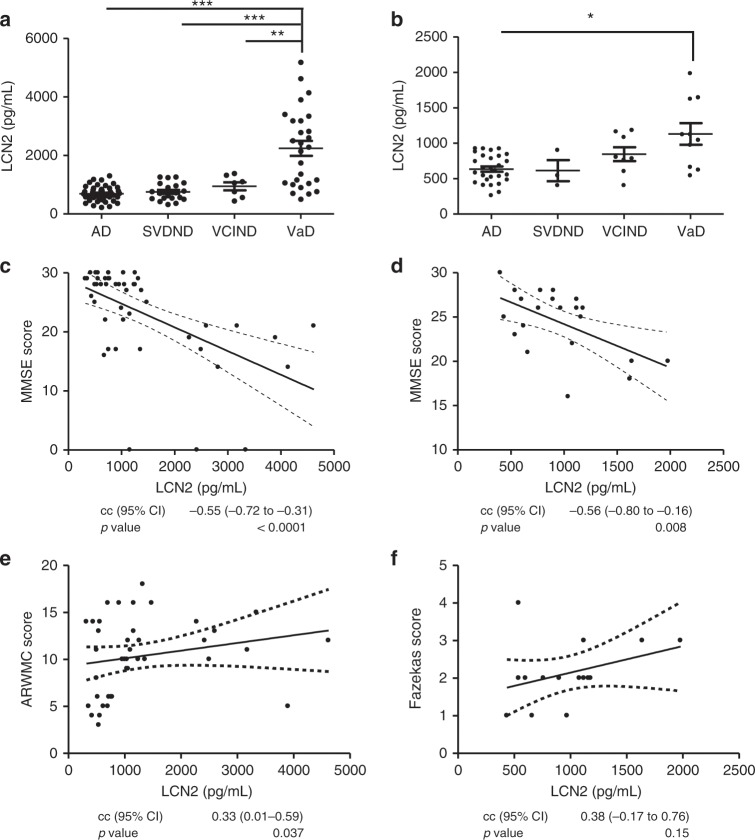
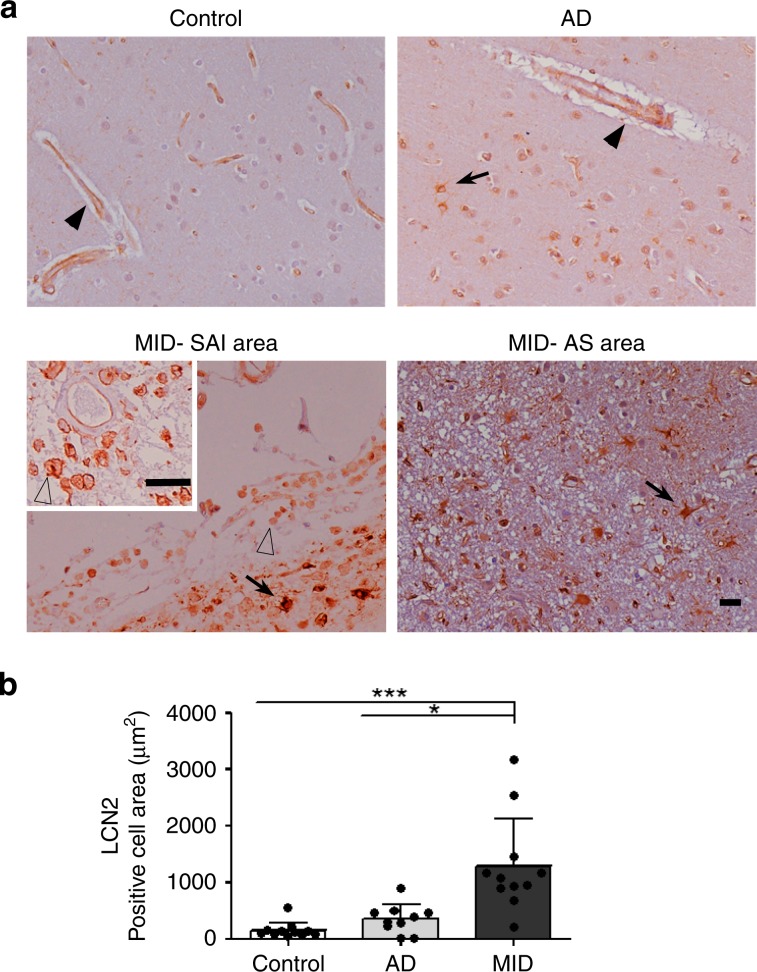
The clinical diagnosis of vascular dementia (VaD) is based on imaging criteria, and specific biochemical markers are not available. Here, we investigated the potential of cerebrospinal fluid (CSF) lipocalin 2 (LCN2), a secreted glycoprotein that has been suggested as mediating neuronal damage in vascular brain injuries. The study included four independent cohorts with a total n = 472 samples. LCN2 was significantly elevated in VaD compared to controls, Alzheimer's disease (AD), other neurodegenerative dementias, and cognitively unimpaired patients with cerebrovascular disease. LCN2 discriminated VaD from AD without coexisting VaD with high accuracy. The main findings were consistent over all cohorts. Neuropathology disclosed a high percentage of macrophages linked to subacute infarcts, reactive astrocytes, and damaged blood vessels in multi-infarct dementia when compared to AD. We conclude that CSF LCN2 is a promising candidate biochemical marker in the differential diagnosis of VaD and neurodegenerative dementias.


Conflict of interest statement

K.B. has served as a consultant or on the advisory boards for Alzheon, BioArctic, Biogen, Eli Lilly, Fujirebio Europe, IBL International, Merck, Novartis, Pfizer, and Roche Diagnostics, all un-related to the data presented in the present paper. O.H. has acquired research support (for the institution) from Roche, GE Healthcare, Biogen, AVID Radiopharmaceuticals, Fujirebio, and Euroimmun. In the past 2 years, he has received consultancy/speaker fees (paid to the institution) from Biogen, Roche, and Fujirebio. H.Z. has served on scientific advisory boards for Eli Lilly, Roche Diagnostics, CogRx, Samumed, and Wave, has received travel support from Teva and is a co-founder of Brain Biomarker Solutions in Gothenburg AB, a GU Ventures-based platform company at the University of Gothenburg. C.P. is member of the International Advisory Boards of Lilly, is consultant of Fujiribio, ALZOHIS, NEUROIMMUNE, and GILEAD and is involved as investigator in several clinical trials for Roche, Esai, Lilly, Biogen, Astra-Zeneca, Lundbeck, and Neuroimmune. J.D. is an investigator in several passive anti-amyloid immunotherapies and other clinical trials for Roche, Eisai, Lilly, Biogen, Astra-Zeneca, Lundbeck. The remaining authors report no biomedical financial interests or potential conflicts of interest.

Figures

Fig. 1
Fig. 1. CSF LCN2 in the differential diagnosis of dementia (cohort 1).
a LCN2 in non-primarily neurodegenerative and non-ischemic neuropsychiatric diseases (ND, n = 73), Alzheimer’s disease (AD, n = 47), vascular dementia (VaD, n = 27), mixed Alzheimer’s and vascular dementia (MD, n = 31), Lewy body dementias (LBD, n = 36), frontotemporal dementia (FTD, n = 21), and sporadic Creutzfeldt-Jakob disease (CJD, n = 54). Results are shown as mean ± SD for each condition. b Area under the curve (AUC) derived from receiver operating characteristic (ROC) curves, Standard Error (SE), 95% Confidence interval (95% CI) for LCN2 in the comparative analyses. c ROC curves of differentiating ND and VaD as well as AD and VaD. Differences between groups were analysed with Tukey contrasts using linear regression models controlled for age and sex. *p < 0.05, **p < 0.01, ***p < 0.001.
Fig. 2
Fig. 2. Diagnostic accuracy of CSF LCN2 in the discrimination of VaD and AD (cohorts 2 and 3).
a Cohort 2: LCN2 concentrations in non-primarily neurodegenerative and non-ischemic neuropsychiatric diseases (ND, n = 24), Alzheimer’s disease (AD, n = 15), and vascular dementia (VaD, n = 10). Area under the curve (AUC) derived from receiver operating characteristic (ROC) curves, Standard Error, and 95% CI in the comparative analysis of VaD versus ND and AD. b Cohort 3: LCN2 concentrations in ND (n = 15), AD (n = 27), and VaD (n = 16). AUC derived from ROC curves, Standard Error, 95% CI in the comparative analysis of VaD versus ND and AD. Differences between groups were analysed with Tukey contrasts using linear regression models controlled for age and sex. *p < 0.05, **p < 0.01, ***p < 0.001.
Fig. 3
Fig. 3. Associations of CSF LCN2, cognitive status, and white matter changes (cohorts 1 and 4).
a Cohort 1: LCN2 levels in Alzheimer’s disease (AD, n = 47), small vessel disease no dementia (SVDND, n = 20), vascular cognitive impairment no dementia (VCIND, n = 7), and vascular dementia (VaD, n = 27). b Cohort 4: LCN2 levels in AD (n = 28), SVDND (n = 3), VCIND (n = 8), and VaD (n = 10). Differences between groups were analysed with Tukey contrasts using linear regression models controlled for age and sex. *p < 0.05, **p < 0.01, ***p < 0.001. a, b Mean ± SD is represented in the graphs. c, d Correlation analysis of LCN2 and Mini Mental Status Examination (MMSE) scores in SVDND, VCIND, and VaD in cohort 1 (n = 48) (c) and cohort 4 (n = 21) (d). Spearman correlation test, correlation coefficients (cc) and associated two-tailed p values. e CSF LCN2 and age-related white matter changes (ARWMC) in SVDND, VCIND, and VaD in cohort 1 (n = 50). Spearman correlation test, correlation coefficients (cc), and associated two-tailed p values. f LCN2 and Fazekas scale in SVDND, VCIND, and VaD in cohort 4 (n = 21). Spearman correlation test, correlation coefficients (cc), and associated two-tailed p values.
Fig. 4
Fig. 4. LCN2 expression in control, AD, and MID brain tissue.
a LCN2 immunohistochemistry in the cerebral cortex of control, Alzheimer’s disease (AD), and Multi-Infarct Chronic Encephalopathy (MID) cases, including subacute infarct areas (MID-SAI area) and astrocytic scar areas (MID-AS area). LCN2 staining is observed in intact blood vessels in controls, AD and MID cases (arrow-heads). Increased LCN2 expression is observed in reactive astrocytes in AD and MID (arrows) and in monocyte/macrophage cells of the MID-SAI area (empty arrow-heads). Paraffin sections counterstained with hematoxylin. Bar: 25 µm; insert-bar 50 µm. b Quantification of LCN2 positive cells area in cerebral cortex and striatum in µm2. Significant increase of LCN2 positive cells area in MID cases with respect to controls (***p < 0.001) and AD cases (*p < 0.05). Shown results are means (±SD) of controls (n = 11), AD (n = 10), and MID (n = 11) cases. In MID cases, area of subacute infraction (n = 6) and chronic infarcts (n = 11) were analysed. Results were analysed by Kruskal-Wallis followed by Dunn's Multiple Comparison test.
Fig. 5
Fig. 5. LCN2 expression in brain tissue and association with glial markers.
a LCN2 and GFAP double-immunostaining in the cerebral cortex of control, AD, and MID cases. LCN2 co-localises with GFAP immunoreactive astrocytes (arrows) in AD, with surrounding plaque like structures, and in MID in astrocytic scar area (MID-AS). Abundant LCN2+GFAP- cells are observed in MID at the subacute infarction area (MID-SAI; arrow-heads), where there is little astrocyte presence. Bar = 50 µm. b LCN2 and Iba1 double-immunostaining in the cerebral cortex of control, AD, and MID cases. LCN2 co-localises with Iba1 immunoreactive microglia in AD and MID-AS (middle panels, arrows). In MID-SAI, predominant Iba1 positive staining was observed, displaying almost entire colocalisation with LCN2+ cells (bottom panel, arrows). LCN2+Iba1- cells are observed in MID-AS slices (arrow-heads). Bar = 50 µm. c, d Quantification of (c) LCN2 and GFAP, and (d) LCN2 and Iba1 double-immunostainings. Tables show single- and double-stained area (µm2), percentage of cells and Pearson’s colocalisation coefficient in Control, AD, and MID (total and divided in MID-SAI and MID-AS). e Graphic representation of double-stained area (left panel) and percentage of double-stained cells (right panel) in control, AD, MID-SAI, and MID-AS. Data are shown as mean ± SD of control (n = 4), AD (n = 4), and MID (n = 10). MID-AS areas were quantified in 10 cases and MID-SAI areas in 6 cases. Mean ± SD is included for each graph. Two-way ANOVA followed by Bonferroni’s post hoc test were used to analyse results *p < 0.05, **p < 0.01, ***p < 0.001.

References

    1. Ferrer I. Cognitive impairment of vascular origin: Neuropathology of cognitive impairment of vascular origin. J. Neurol. Sci. 2010;299:139–149. doi: 10.1016/j.jns.2010.08.039. - DOI - PubMed
    1. Román GC, et al. Vascular dementia: diagnostic criteria for research studies. Report of the NINDS-AIREN International Workshop. Neurology. 1993;43:250–260. doi: 10.1212/WNL.43.2.250. - DOI - PubMed
    1. Pohjasvaara T, Mantyla R, Ylikoski R, Kaste M, Erkinjuntti T. Comparison of Different Clinical Criteria (DSM-III, ADDTC, ICD-10, NINDS-AIREN, DSM-IV) for the Diagnosis of Vascular Dementia. Stroke. 2000;31:2952–2957. doi: 10.1161/01.STR.31.12.2952. - DOI - PubMed
    1. Perneczky, R. et al. Is the time ripe for new diagnostic criteria of cognitive impairment due to cerebrovascular disease? Consensus report of the International Congress on Vascular Dementia working group. BMC Med. 14, 162 (2016). - PMC - PubMed
    1. Jellinger, K. A. Pathology and pathogenesis of vascular cognitive impairment-a critical update. Front. Aging Neurosci. 5, 17 (2013). - PMC - PubMed

Publication types