

Associations between adipose tissue volume and small molecules in plasma and urine among asymptomatic subjects from the general population
- PMID: 32001750
- PMCID: PMC6992585
- DOI: 10.1038/s41598-020-58430-8
Associations between adipose tissue volume and small molecules in plasma and urine among asymptomatic subjects from the general population
Abstract
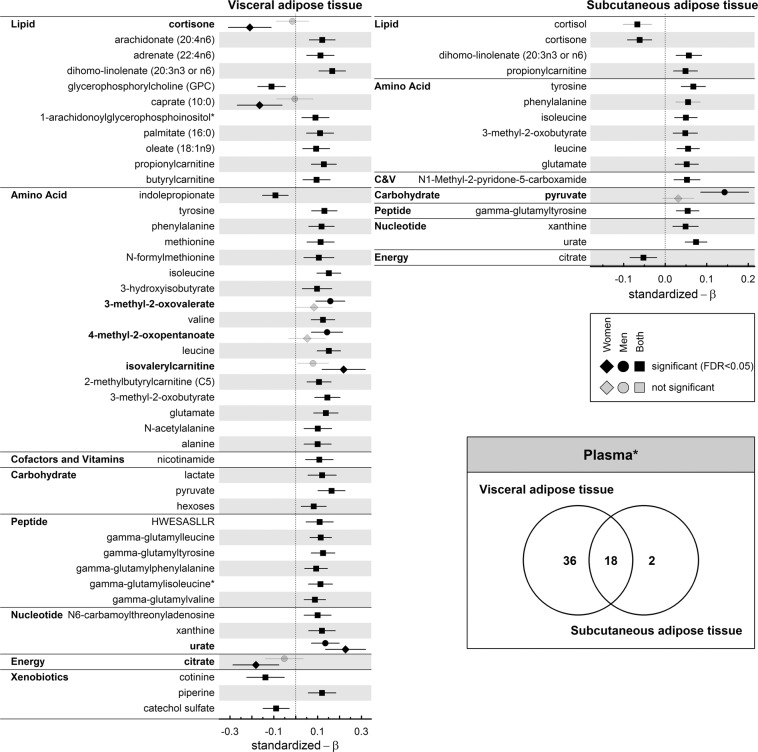
Obesity is one of the major risk factor for cardiovascular and metabolic diseases. A disproportional accumulation of fat at visceral (VAT) compared to subcutaneous sites (SAT) has been suspected as a key detrimental event. We used non-targeted metabolomics profiling to reveal metabolic pathways associated with higher VAT or SAT amount among subjects free of metabolic diseases to identify possible contributing metabolic pathways. The study population comprised 491 subjects [mean (standard deviation): age 44.6 yrs (13.0), body mass index 25.4 kg/m² (3.6), 60.1% females] without diabetes, hypertension, dyslipidemia, the metabolic syndrome or impaired renal function. We associated MRI-derived fat amounts with mass spectrometry-derived metabolites in plasma and urine using linear regression models adjusting for major confounders. We tested for sex-specific effects using interactions terms and performed sensitivity analyses for the influence of insulin resistance on the results. VAT and SAT were significantly associated with 155 (101 urine) and 49 (29 urine) metabolites, respectively, of which 45 (27 urine) were common to both. Major metabolic pathways were branched-chain amino acid metabolism (partially independent of insulin resistance), surrogate markers of oxidative stress and gut microbial diversity, and cortisol metabolism. We observed a novel positive association between VAT and plasma levels of the potential pharmacological agent piperine. Sex-specific effects were only a few, e.g. the female-specific association between VAT and O-methylascorbate. In brief, higher VAT was associated with an unfavorable metabolite profile in a sample of healthy, mostly non-obese individuals from the general population and only few sex-specific associations became apparent.
Conflict of interest statement
The authors declare no competing interests.
Figures


Similar articles
-
Associations of visceral and abdominal subcutaneous adipose tissue with markers of cardiac and metabolic risk in obese adults.Obesity (Silver Spring). 2013 Sep;21(9):E439-47. doi: 10.1002/oby.20135. Epub 2013 May 19. Obesity (Silver Spring). 2013. PMID: 23687099 Free PMC article.
-
Associations of Abdominal Subcutaneous and Visceral Fat with Insulin Resistance and Secretion Differ Between Men and Women: The Netherlands Epidemiology of Obesity Study.Metab Syndr Relat Disord. 2018 Feb;16(1):54-63. doi: 10.1089/met.2017.0128. Epub 2018 Jan 17. Metab Syndr Relat Disord. 2018. PMID: 29338526
-
Visceral adipose tissue but not subcutaneous adipose tissue is associated with urine and serum metabolites.PLoS One. 2017 Apr 12;12(4):e0175133. doi: 10.1371/journal.pone.0175133. eCollection 2017. PLoS One. 2017. PMID: 28403191 Free PMC article.
-
Under the Surface of Subcutaneous Adipose Tissue Biology.Acta Dermatovenerol Croat. 2016 Dec;24(4):250-260. Acta Dermatovenerol Croat. 2016. PMID: 28128075 Review.
-
Visceral adipose tissue in patients with severe mental illness.Horm Mol Biol Clin Investig. 2018 Mar 16;33(1). doi: 10.1515/hmbci-2018-0007. Horm Mol Biol Clin Investig. 2018. PMID: 29547392 Review.
Cited by
-
SHIP-MR and Radiology: 12 Years of Whole-Body Magnetic Resonance Imaging in a Single Center.Healthcare (Basel). 2021 Dec 24;10(1):33. doi: 10.3390/healthcare10010033. Healthcare (Basel). 2021. PMID: 35052197 Free PMC article. Review.
-
A multivariant recall-by-genotype study of the metabolomic signature of BMI.Obesity (Silver Spring). 2022 Jun;30(6):1298-1310. doi: 10.1002/oby.23441. Epub 2022 May 22. Obesity (Silver Spring). 2022. PMID: 35598895 Free PMC article.
-
Functionalization of Gold Nanostars with Cationic β-Cyclodextrin-Based Polymer for Drug Co-Loading and SERS Monitoring.Pharmaceutics. 2021 Feb 15;13(2):261. doi: 10.3390/pharmaceutics13020261. Pharmaceutics. 2021. PMID: 33671975 Free PMC article.
-
Dietary Branched-Chain Amino Acids (BCAAs) and Risk of Dyslipidemia in a Chinese Population.Nutrients. 2022 Apr 27;14(9):1824. doi: 10.3390/nu14091824. Nutrients. 2022. PMID: 35565798 Free PMC article.
-
Morphomics, Survival, and Metabolites in Patients With Metastatic Pancreatic Cancer.JAMA Netw Open. 2024 Oct 1;7(10):e2440047. doi: 10.1001/jamanetworkopen.2024.40047. JAMA Netw Open. 2024. PMID: 39418020 Free PMC article. Clinical Trial.
References
-
- Solomon, C. G. & Manson, J. E. Obesity and mortality: a review of the epidemiologic data. Am J Clin Nutr66, 1044S-1050S (1997). - PubMed
Publication types
MeSH terms
Substances
LinkOut - more resources
Full Text Sources
Research Materials
