. 2020 Jan 30;10(1):1493.
doi: 10.1038/s41598-020-58438-0.

Identification of synergistic drug combinations using breast cancer patient-derived xenografts

Affiliations

Identification of synergistic drug combinations using breast cancer patient-derived xenografts

Tia H Turner et al. Sci Rep. .

Abstract

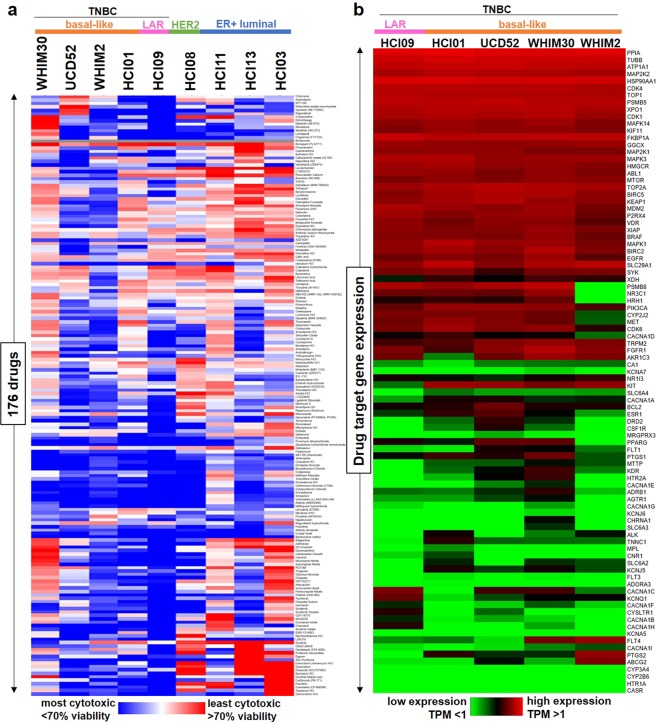
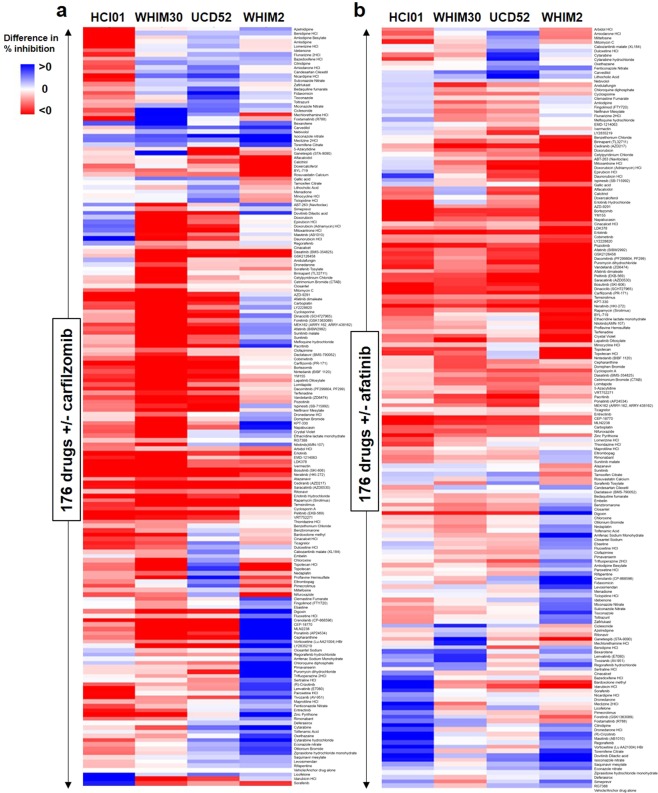
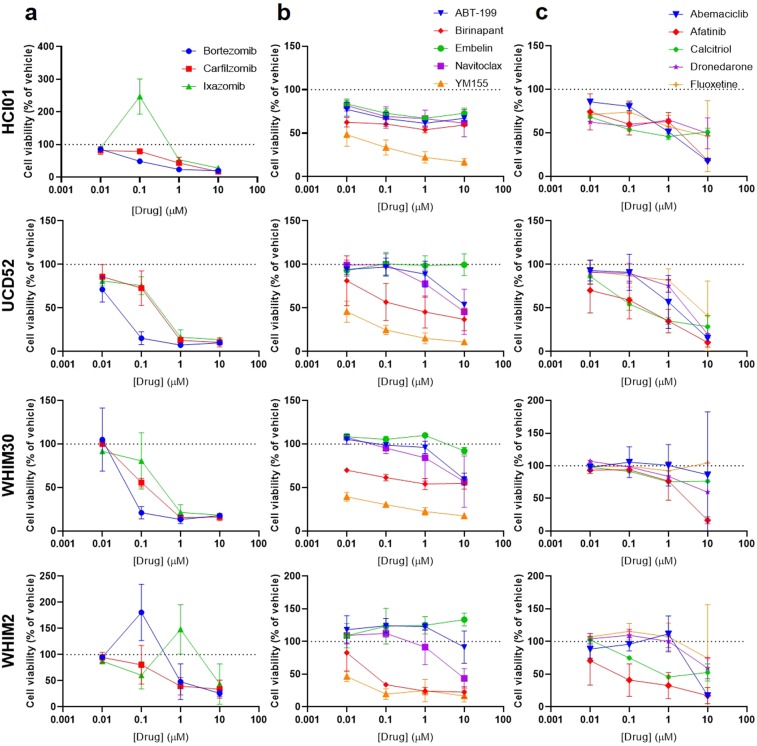
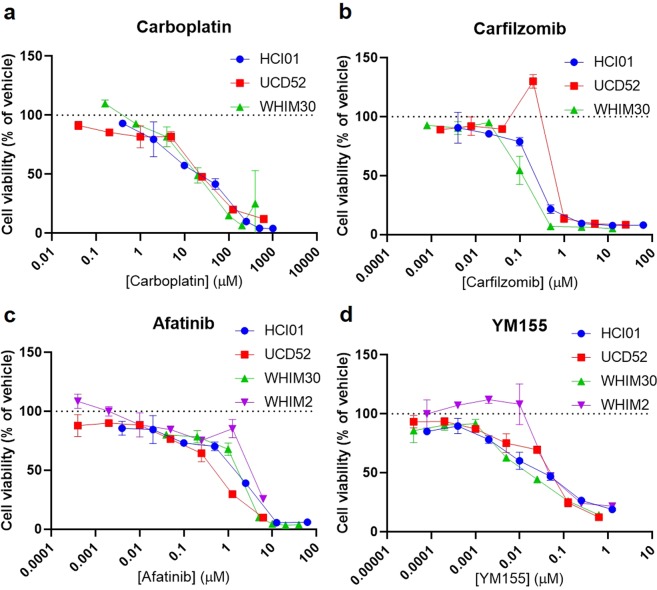
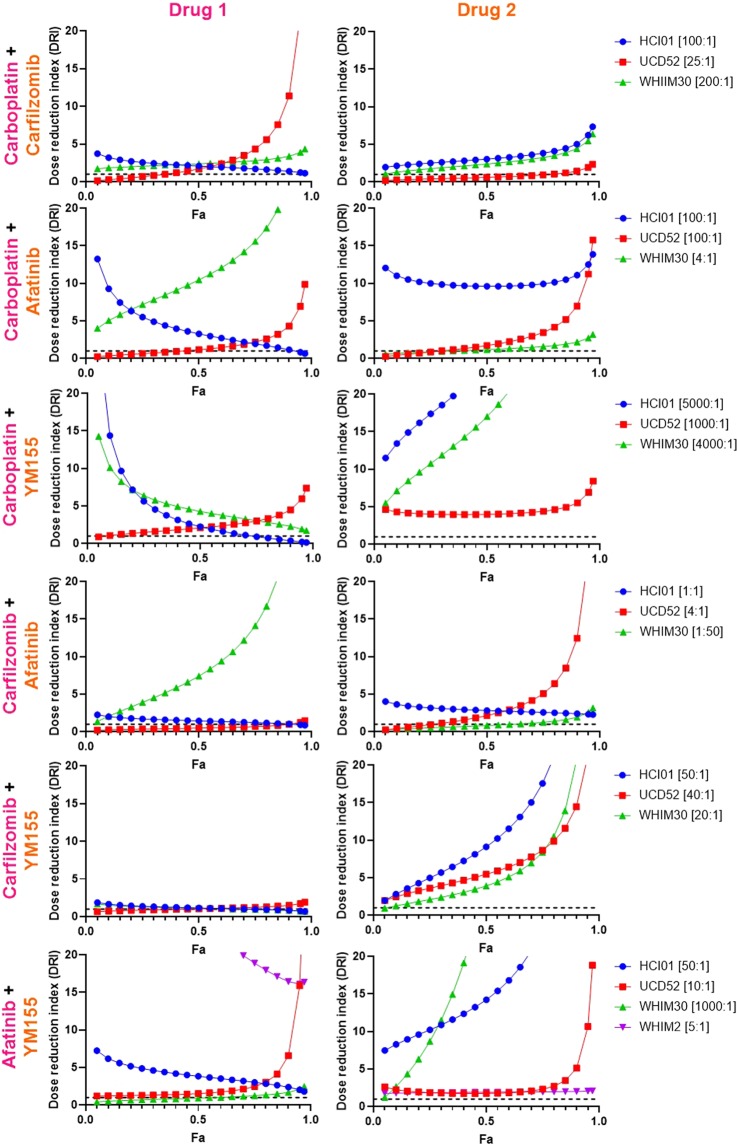
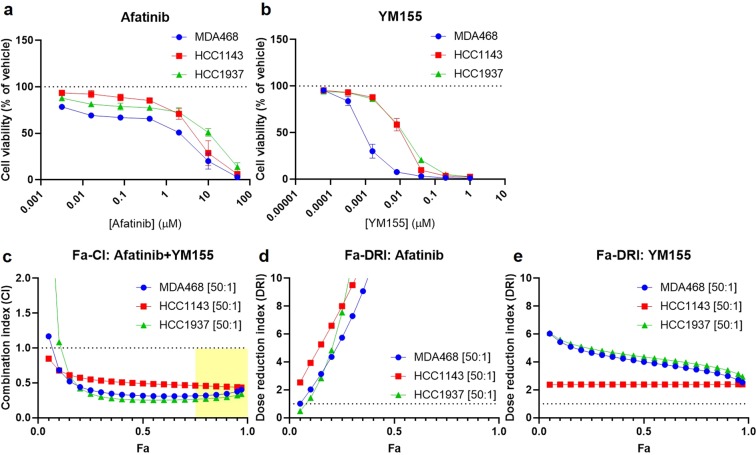
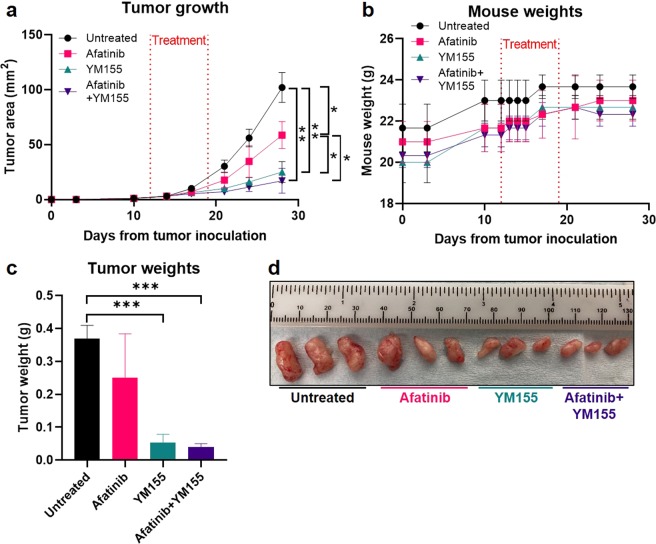
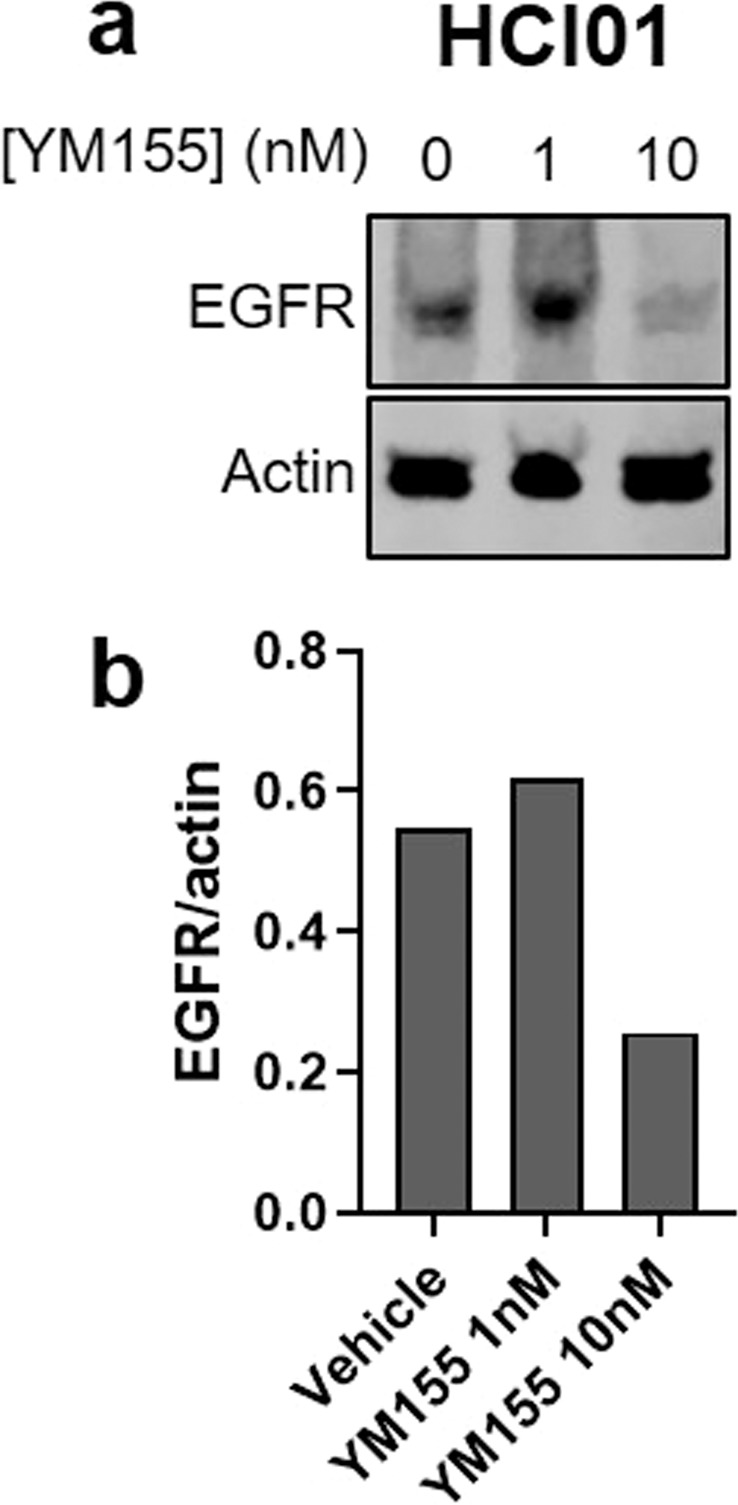
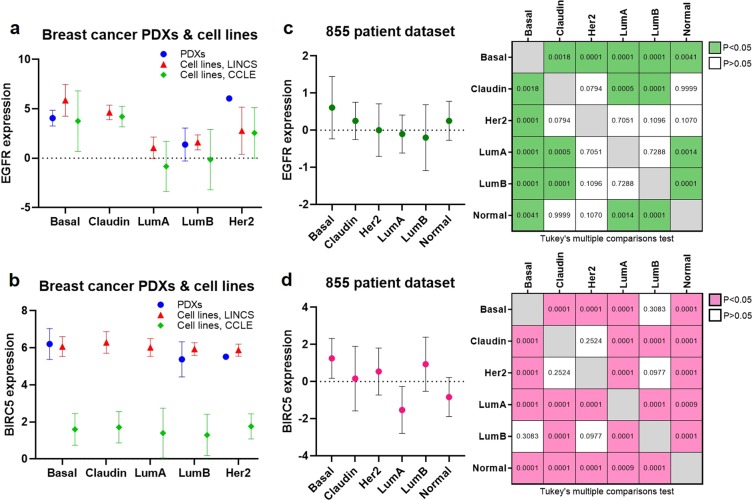
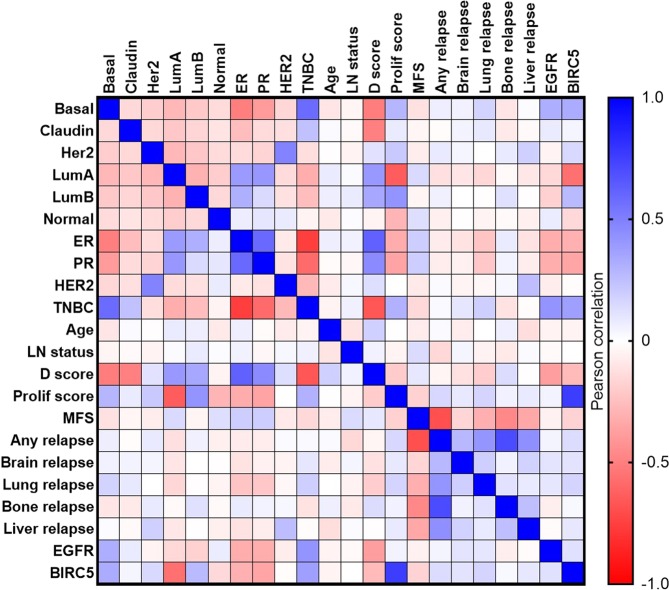
Compared with other breast cancer subtypes, triple-negative breast cancer (TNBC) is associated with relatively poor outcomes due to its metastatic propensity, frequent failure to respond to chemotherapy, and lack of alternative, targeted treatment options, despite decades of major research efforts. Our studies sought to identify promising targeted therapeutic candidates for TNBC through in vitro screening of 1,363 drugs in patient-derived xenograft (PDX) models. Using this approach, we generated a dataset that can be used to assess and compare responses of various breast cancer PDXs to many different drugs. Through a series of further drug screening assays and two-drug combination testing, we identified that the combination of afatinib (epidermal growth factor receptor (EGFR) inhibitor) and YM155 (inhibitor of baculoviral inhibitor of apoptosis repeat-containing 5 (BIRC5; survivin) expression) is synergistically cytotoxic across multiple models of basal-like TNBC and reduces PDX mammary tumor growth in vivo. We found that YM155 reduces EGFR expression in TNBC cells, shedding light on its potential mechanism of synergism with afatinib. Both EGFR and BIRC5 are highly expressed in basal-like PDXs, cell lines, and patients, and high expression of both genes reduces metastasis-free survival, suggesting that co-targeting of these proteins holds promise for potential clinical success in TNBC.


Conflict of interest statement

The authors declare no competing interests.

Figures

Figure 1
Figure 1
Selection of targeted drug candidates in TNBC PDXs based on a 1,363-drug screen. (a) Heatmap showing relative response to 176 drugs across PDXs of varying subtypes, selected based on efficacy in basal-like TNBC PDXs (HCI01, UCD52, WHIM2, WHIM30) on initial screening of 1,363 drugs at 10 µM. Hierarchical clustered cell viability data (average percent of vehicle) are represented in the heatmap for comparison of drug response across PDXs (n = 2 per PDX). The 1,363-drug screening data and 176-drug and target list are provided in Supplementary File S1. (b) Heatmap showing relative expression of target genes of the 176 selected drugs across TNBC PDXs. Clustered TPM values from PDX RNA-sequencing data (averaged for each PDX) are represented in the heatmap for analysis of target gene expression levels across PDXs.
Figure 2
Figure 2
Efficacy of 176 selected drugs combined with carfilzomib or afatinib in basal-like TNBC PDXs. PDX cells (HCI01, UCD52, WHIM2, WHIM30) were treated with 176 drugs at 1 µM+/− carfilzomib or afatinib. Difference in percent inhibition of cell viability between each drug combination and each drug alone was calculated to assess for additive, supra-additive, or sub-additive trends: (percent inhibition of combination) − [(percent inhibition of drug 1 alone) + (percent inhibition of drug 2 alone)]. Heatmaps depict clustered differences in average percent inhibition between each of the 176 drugs combined with carfilzomib (a) or afatinib (b) compared with either drug alone; n = 2 for HCI01, UCS52, WHIM2; n = 3 for WHIM30. Differences in percent inhibition of 0 indicate additive trends (white), >0 indicate supra-additive trends (blue), and <0 indicate sub-additive trends (red). The 176 selected drugs and carfilzomib/afatinib combination data, along with confidence intervals and p-values, are provided in Supplementary File S2.
Figure 3
Figure 3
Dose responses of basal-like TNBC PDXs to selected classes of targeted therapeutics. Graphs depict cell viability (percent of vehicle) in response to increasing concentrations of the indicated drugs for each of four basal-like PDX lines (HCI01, UCD52, WHIM30, WHIM2): (a) proteasome inhibitors (carfilzomib, bortezomib, ixazomib); (b) drugs targeting apoptosis pathways (YM155, navitoclax, ABT-199, embelin, birinapant); and (c) EGFR inhibitor (afatinib), CDK4/6 inhibitor (abemaciclib), SSRI (fluoxetine), synthetic vitamin D3 (calcitriol), antiarrhythmic (dronedarone). Experiments were performed in triplicate. Error bars represent standard deviation between independent experiments. p-values are listed in Supplementary Table S1.
Figure 4
Figure 4
Dose responses of basal-like TNBC PDXs to four promising drug candidates. Graphs depict cell viability (percent of vehicle) in response to increasing concentrations of carboplatin (a) carfilzomib (b) afatinib (c) or YM155 (d) for each PDX line (HCI01, UCD52, WHIM30, WHIM2). Each experiment was performed in triplicate. Error bars represent standard deviation between independent experiments (n = 2 for each PDX); p-values are listed in Supplementary Table S3.
Figure 5
Figure 5
Drug combination analysis reveals synergism between afatinib and YM155 across four basal-like TNBC PDXs. PDX cells were treated with four drugs (carboplatin, carfilzomib, afatinib, and YM155), seven doses each, alone and in all possible two-drug combinations. Combination index (CI) values were generated using CompuSyn software, and Fa-CI plots were generated using constant dose ratio combination data for each of the six drug combinations in each of the PDXs. CI < 1 indicates synergism; CI = 1 indicates additivity; CI > 1 indicates antagonism. The regions highlighted in yellow are synergistic (CI < 1) at optimal effect levels (Fa > 0.75). Dose ratios (Drug1:Drug2) for each drug combination and PDX are indicated in the legend of each graph.
Figure 6
Figure 6
Drug combination analysis reveals favorable dose reduction of several drugs when combined with other agents in basal-like TNBC PDXs. PDX cells were treated with four drugs (carboplatin, carfilzomib, afatinib, and YM155), seven doses each, alone and in all possible two-drug combinations. Dose reduction index (DRI) values were generated using CompuSyn software, and Fa-DRI plots were generated using constant dose ratio combination data for each of the six drug combinations in each of the PDXs. DRI indicates the fold decrease in drug dose needed to achieve a given effect when in combination with another drug vs. as a single agent. DRI > 1 indicates favorable dose reduction; DRI < 1 indicates unfavorable dose reduction. Dose ratios (Drug1:Drug2) for each drug combination and PDX are indicated in the legend of each graph.
Figure 7
Figure 7
Afatinib and YM155 are synergistically cytotoxic to three basal-like TNBC cell lines. MDA468, HCC1143, and HCC1937 cells were treated in triplicate for 72 h in vitro with seven doses of afatinib or YM155, as well as all possible dose combinations of the two drugs. Graphs depict cell viability (percent of vehicle) of each of the three cell lines in response to afatinib (a) or YM155 (b). Two independent experiments were performed for each cell line; error bars represent standard deviation; p-values are listed in Supplementary Table S4. Data were analyzed using CompuSyn software, and constant dose ratio combination data was used to generate a Fa-CI plot (c) and Fa-DRI plots for both afatinib (d) and YM155 (e). Dose ratios (Drug1:Drug2) for each cell line are indicated in the graph legends. CI < 1 indicates synergism; CI = 1 indicates additivity; CI > 1 indicates antagonism. The region highlighted in yellow is synergistic (CI < 1) at optimal effect levels (Fa > 0.75). DRI indicates the fold decrease in drug dose needed to achieve a given effect when in combination with another drug vs. as a single agent. DRI > 1 indicates favorable dose reduction; DRI < 1 indicates unfavorable dose reduction.
Figure 8
Figure 8
Afatinib and YM155 reduce PDX mammary tumor growth in vivo. HCI01 PDX cells were injected into the mammary fat pads of NSG mice. After 12 days of tumor growth, mice were divided into four groups (n = 3 mice per group): untreated, afatinib (25 mg/kg, daily oral gavage for 7 days), YM155 (5 mg/kg, 7-day continuous subcutaneous infusion via Alzet pump), and afatinib + YM155 (same doses and routes of administration as monotherapy groups). (a) Tumor area (length x width) over time for each treatment group, monitored via caliper measurements. The treatment period is indicated by red dotted lines. Error bars represent standard deviation. Significance is shown only for endpoint measurements (*p < 0.05, **p < 0.01); p-values for all timepoints are listed in Supplementary Table S5. (b) Mouse weights over time for each treatment group. The treatment period is indicated by red dotted lines. (c) Tumor weights for each treatment group, obtained after tumor removal at the study endpoint; ***p < 0.001; p-values are listed in Supplementary Table S5. (d) Photographs of mammary tumors for each treatment group at the study endpoint; ruler scale is mm.
Figure 9
Figure 9
YM155 reduces EGFR expression in basal-like TNBC PDX cells. (a) Western blot showing EGFR expression in HCI01 cells treated with vehicle (DMSO) or YM155 (1 or 10 nM); actin was used as a loading control (100 µg per sample). Images are cropped blots showing proteins from different parts of the same gel. Corresponding full-length blots are shown in Supplementary Fig. S1. (b) Densitometry graph showing EGFR normalized to actin for each treatment condition. Samples were run on the same gel, and loading controls were run on the same blot.
Figure 10
Figure 10
EGFR and BIRC5 are highly expressed in basal-like PDXs, cell lines, and patient tumors. RNA-sequencing data from breast cancer PDXs and cell lines (LINCS and CCLE databases) were used to assess expression levels of EGFR (a) and BIRC5 (b) according to intrinsic subtype: basal-like (Basal), claudin-low (Claudin), luminal A (LumA), luminal B (LumB), HER2-enriched (Her2). Gene expression data from 855 breast cancer patients were used to assess expression levels of EGFR (c) and BIRC5 (d) in patients according to intrinsic subtype: basal-like (Basal), claudin-low (Claudin), luminal A (LumA), luminal B (LumB), HER2-enriched (Her2), normal-like (Normal). Tukey’s multiple comparisons tests were used to analyze differences in expression levels of each gene between each subtype; tables in right panels depict p-values. PDX, cell line, and patient datasets were each grouped by breast cancer intrinsic subtype, and expression values for each gene were averaged; graphs depict the average (marker) and range (bars) of expression of EGFR or BIRC5 in each breast cancer subtype.
Figure 11
Figure 11
EGFR and BIRC5 expression correlate with clinical characteristics of patient tumors. Using an 855-patient dataset consisting of gene expression data as well as clinical information, Pearson correlations were performed to assess the relationships of EGFR and BIRC5 expression with clinical parameters. Intrinsic subtype: basal-like (Basal), claudin-low (Claudin), luminal A (LumA), luminal B (LumB), HER2-enriched (Her2), normal-like (Normal). Receptor status: estrogen receptor (ER), progesterone receptor (PR), human epidermal growth factor receptor 2 (HER2), triple-negative breast cancer (TNBC). Other parameters: patient age, lymph node (LN) status, differentiation (D) score, proliferation (Prolif) score. Clinical outcomes: metastasis-free survival (MFS), relapse-free survival (any relapse, brain, liver, lung, bone). Heatmap depicts Pearson correlation values for each comparison of parameters: negative correlation (red), no correlation (white), positive correlation (blue).
Figure 12
Figure 12
EGFR and BIRC5 expression are negatively associated with metastasis-free survival in patients with basal-like tumors. Using an 855-patient breast cancer dataset, patients with basal-like tumors (N = 140) were divided into four groups based on expression levels of EGFR and BIRC5: EGFRhighBIRC5high, EGFRhighBIRC5low, EGFRlowBIRC5high, EGFRlowBIRC5low. Kaplan-Meier curves were generated to assess the effect of high versus low expression of the two genes on (a) liver relapse-free survival, (b) lung relapse-free survival, and (c) metastasis-free survival (MFS) time. Log-rank tests were performed to determine statistical significance (*p < 0.05, **p < 0.01); p-values are listed in Supplementary Table S6.

References

    1. Howlader, N. et al. SEERCancer Statistics Review, 1975-2016. National Cancer Institute (2019). Available at, https://seer.cancer.gov/csr/1975_2016/. (Accessed: 27th April 2019).
    1. SEER Cancer Stat Facts: Female Breast Cancer. National Cancer Institute. Available at, https://seer.cancer.gov/statfacts/html/breast.html. (Accessed: 27th April 2019).
    1. Perou CM, et al. Molecular portraits of human breast tumours. Nature. 2000;406:747–752. doi: 10.1038/35021093. - DOI - PubMed
    1. Prat A, Perou CM. Deconstructing the molecular portraits of breast cancer. Mol. Oncol. 2011;5:5–23. doi: 10.1016/j.molonc.2010.11.003. - DOI - PMC - PubMed
    1. Curtis C, et al. The genomic and transcriptomic architecture of 2,000 breast tumours reveals novel subgroups. Nature. 2012;486:346–52. doi: 10.1038/nature10983. - DOI - PMC - PubMed

Publication types

MeSH terms