. 2020 Jan 28:20:27.
doi: 10.1186/s12935-020-1113-6. eCollection 2020.

Construction of a novel gene-based model for prognosis prediction of clear cell renal cell carcinoma

Affiliations

Construction of a novel gene-based model for prognosis prediction of clear cell renal cell carcinoma

Zedan Zhang et al. Cancer Cell Int. .

Abstract

Background: Clear cell renal cell carcinoma (ccRCC) comprises the majority of kidney cancer death worldwide, whose incidence and mortality are not promising. Identifying ideal biomarkers to construct a more accurate prognostic model than conventional clinical parameters is crucial.

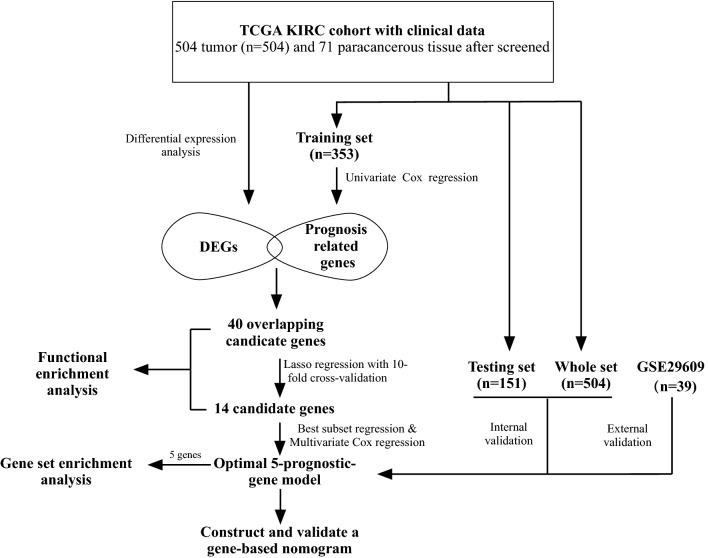
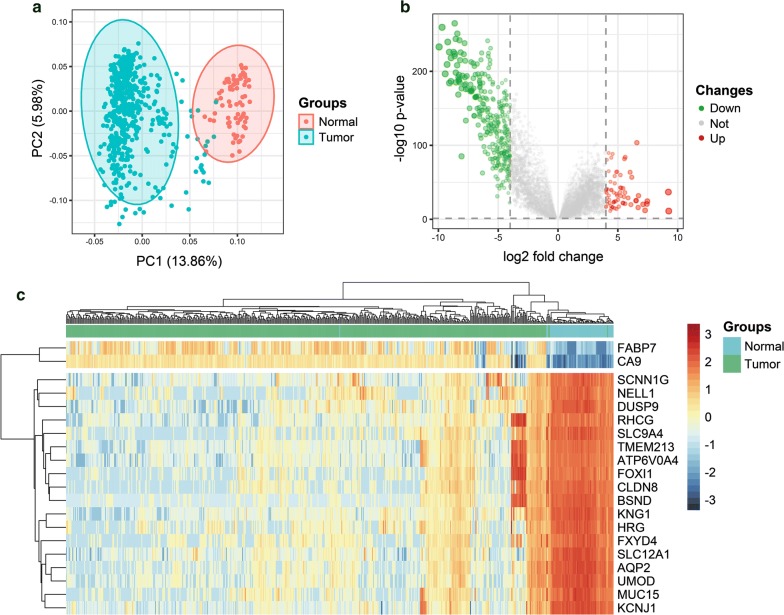
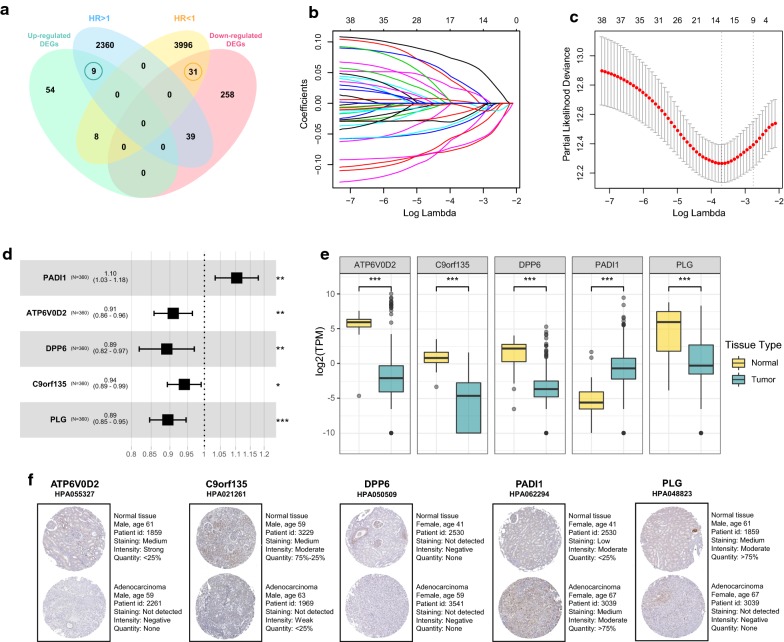
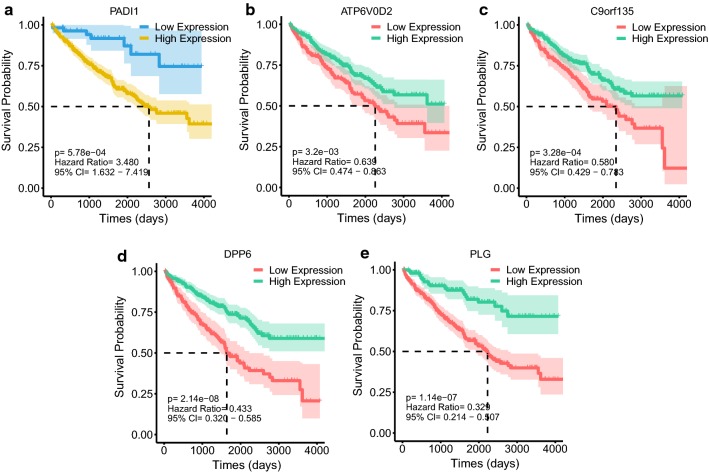
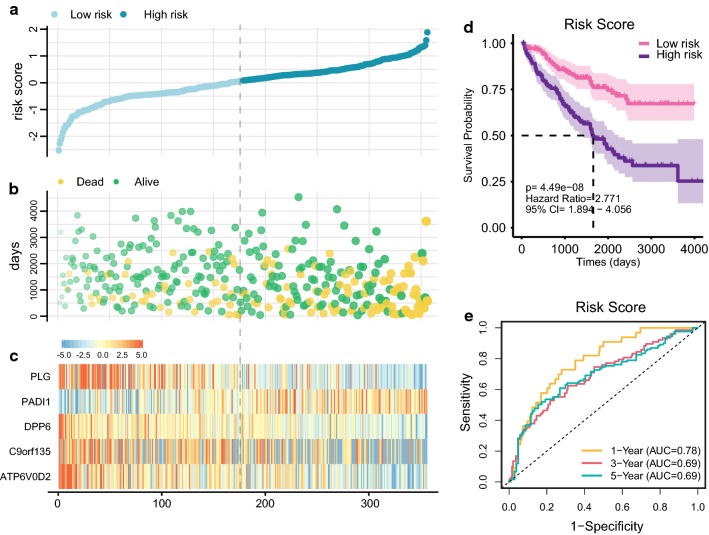
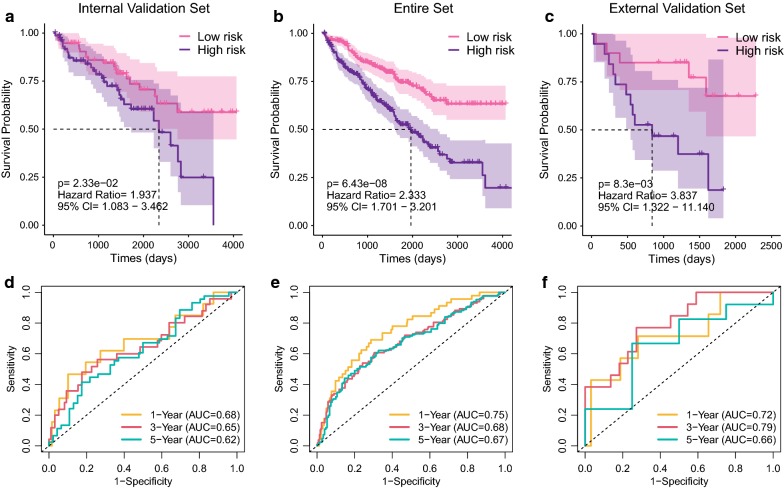
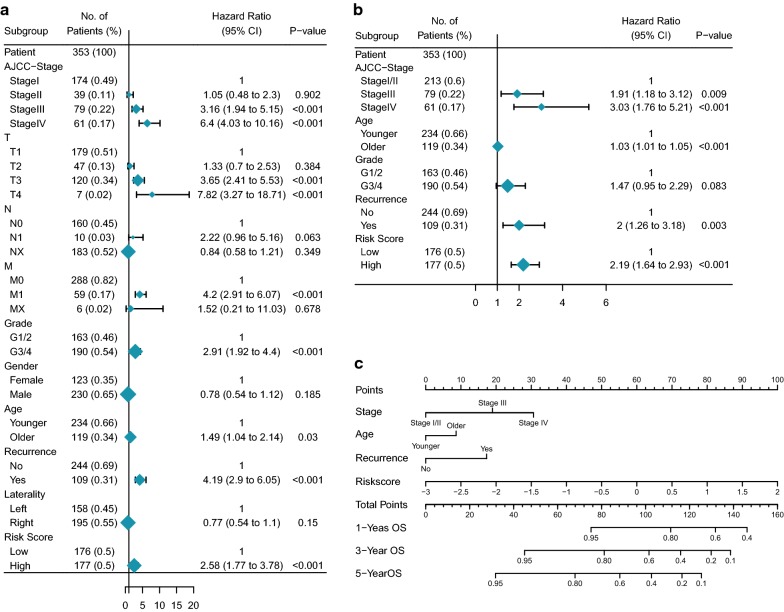
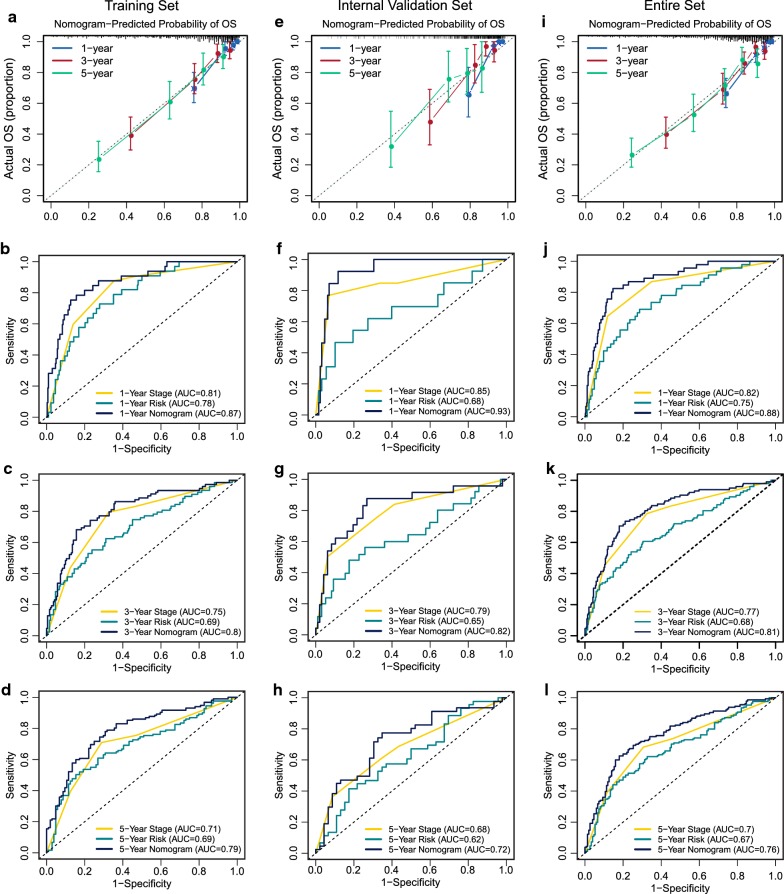
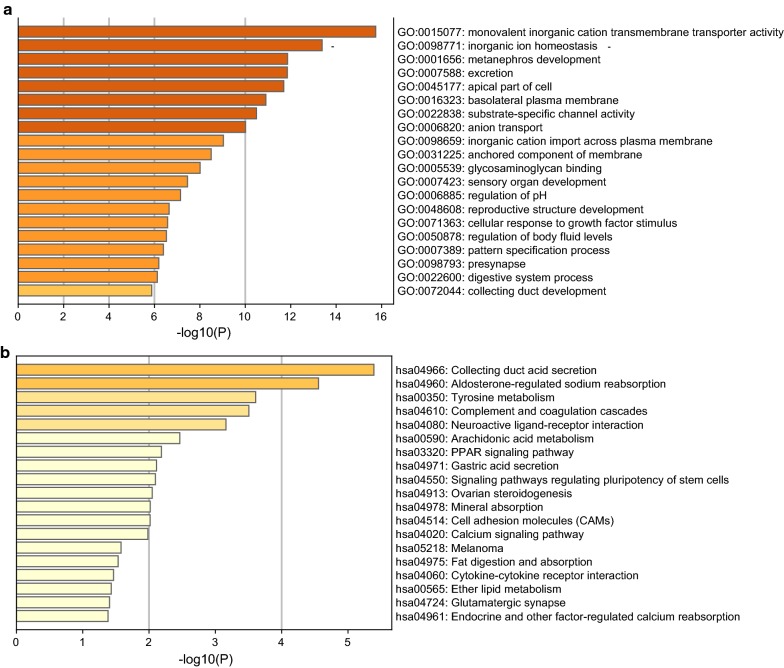
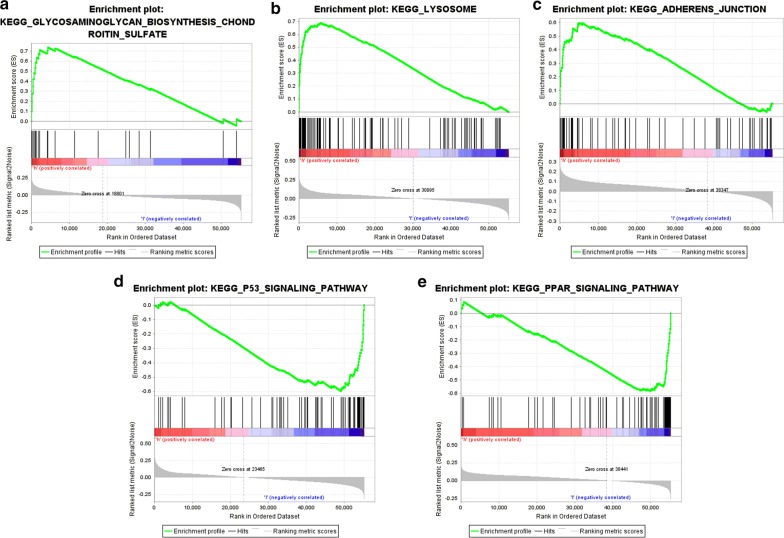
Methods: Raw count of RNA-sequencing data and clinicopathological data were acquired from The Cancer Genome Atlas (TCGA). Tumor samples were divided into two sets. Differentially expressed genes (DEGs) were screened in the whole set and prognosis-related genes were identified from the training set. Their common genes were used in LASSO and best subset regression which were performed to identify the best prognostic 5 genes. The gene-based risk score was developed based on the Cox coefficient of the individual gene. Time-dependent receiver operating characteristic (ROC) and Kaplan-Meier (KM) survival analysis were used to assess its prognostic power. GSE29609 dataset from GEO (Gene Expression Omnibus) database was used to validate the signature. Univariate and multivariate Cox regression were performed to screen independent prognostic parameters to construct a nomogram. The predictive power of the nomogram was revealed by time-dependent ROC curves and the calibration plot and verified in the validation set. Finally, Functional enrichment analysis of DEGs and 5 novel genes were performed to suggest the potential biological pathways.

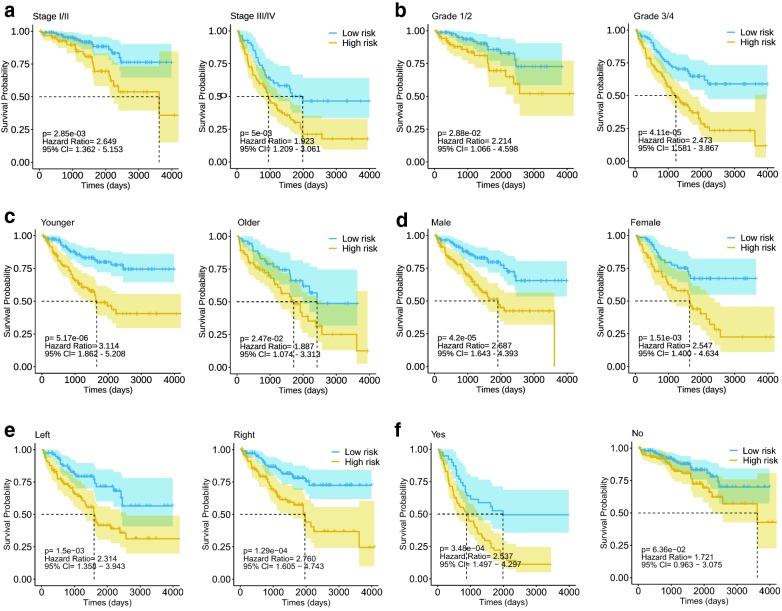
Results: PADI1, ATP6V0D2, DPP6, C9orf135 and PLG were screened to be significantly related to the prognosis of ccRCC patients. The risk score effectively stratified the patients into high-risk group with poor overall survival (OS) based on survival analysis. AJCC-stage, age, recurrence and risk score were regarded as independent prognostic parameters by Cox regression analysis and were used to construct a nomogram. Time-dependent ROC curves showed the nomogram performed best in 1-, 3- and 5-year survival predictions compared with AJCC-stage and risk score in validation sets. The calibration plot showed good agreement of the nomogram between predicted and observed outcomes. Functional enrichment analysis suggested several enriched biological pathways related to cancer.

Conclusions: In our study, we constructed a gene-based model integrating clinical prognostic parameters to predict prognosis of ccRCC well, which might provide a reliable prognosis assessment tool for clinician and aid treatment decision-making in the clinic.

Keywords: Clear cell renal cell carcinoma (ccRCC); Differentially expressed genes (DEGs); GEO; Nomogram; Overall survival (OS); Risk score; TCGA.


Conflict of interest statement

Competing interestsThe authors declare that they have no competing interests.

Figures

Fig. 1
Fig. 1
Flowchart of the whole study
Fig. 2
Fig. 2
Data processing, screening of the DEGs. a A PCA plot of the data showing no batch effect in the TCGA KIRC dataset. Red nodes represent the normal cluster while blue nodes represent the tumor cluster. b Heatmap of top 20 DEGs in ccRCC. c Volcano plot of differentially expressed genes in ccRCC when compared with normal tissue. Red nodes represent the significantly up-regulated genes with logFC > 4 and p < 0.05. Green nodes represent the significantly down-regulated genes with logFC < -4 and p < 0.05. PCA, principal component analysis; TCGA, The Cancer Genome Atlas; DEGs, differentially expressed genes; ccRCC, clear cell renal cell carcinoma
Fig. 3
Fig. 3
Identification of 5 significantly prognostic genes and their expression data in ccRCC. a Venn diagram of 40 OCGs. 9 upregulated genes with HR > 1. 31 downregulated genes with HR < 1. b LASSO coefficients profiles of 19651 protein-coding genes. c LASSO regression with tenfold cross-validation obtained 14 prognostic genes using minimum lambda value. d Multivariate Cox regression analysis of 5 prognostic genes from BSR. e Expression pattern of the five genes between tumor and normal kidney tissue. f IHC of the five genes in tumor and normal kidney tissue. ccRCC clear cell renal cell carcinoma, OCG overlapping candidate genes, HR hazard ratio, LASSO least absolute shrinkage and selection operator, BSR best subset regression, IHC immunohistochemistry. *p < 0.05, **p < 0.01, ***p < 0.001
Fig. 4
Fig. 4
Kaplan–Meier survival analysis of PADI1, ATP6V0D2, C9orf135, DPP6, and PLG
Fig. 5
Fig. 5
Prognostic analysis of five-gene signature in the training set. The dotted line represented the median risk score and divided the patients into low- and high-risk group. a The curve of risk score. b Survival status of the patients. More dead patients corresponding to the higher risk score. c Heatmap of the expression profiles of the five prognostic genes in low- and high-risk group. d Kaplan–Meier survival analysis of the five-gene signature. e Time-dependent ROC analysis the of the five-gene signature. ROC receiver operating characteristic
Fig. 6
Fig. 6
Kaplan–Meier survival analysis of the five-gene risk score level in different subgroups including stage I/II, stage III/IV (a), grade 1/2, grade 3/4 (b), younger than 65 years old, older than 65 years old (c), male, female (d), left tumor, right tumor (e) and with or without recurrence (f)
Fig. 7
Fig. 7
Validation of the five-gene signature. GSE29609 was regarded as the external validation set. Kaplan–Meier survival analysis of the five-gene signature in internal validation set (a), the whole set (b) and external validation set (c). Time-dependent ROC analysis of the five-gene signature in internal validation set (d), the whole set (e) and external validation set (f). ROC, receiver operating characteristic
Fig. 8
Fig. 8
Identifying the independent prognostic parameters and construction of gene-based prognostic model. a Forrest plot of univariate Cox regression analysis in ccRCC. b Forrest plot of multivariate Cox regression analysis in ccRCC. c Nomogram integrated five gene-based risk score, AJCC-stage, grade and age
Fig. 9
Fig. 9
Performance of gene-based nomogram in predicting survival probability and comparison of the predictive power among gene-based nomogram, risk score and AJCC-stage. The calibration plot of the nomogram for agreement test between 1-, 3- and 5-year OS prediction and actual outcome in the training set (a), the internal validation set (e) and the entire set (i). The time-dependent ROC curves of the nomogram, risk score and AJCC-stage in 1-, 3- and 5-year OS prediction in the training set (bd), the internal validation set (fh) and the entire set (jl). OS overall survival, ROC receiver operating characteristic
Fig. 10
Fig. 10
Functional enrichment analysis of 399 DEGs. The more genes enriched in the terms, the darker the color. a Top 20 of GO enrichment analysis of the DEGs. b Top 20 of KEGG enrichment analysis of the DEGs. DEGs differentially expressed genes, GO gene ontology, KEGG Kyoto Encyclopedia of Genes and Genomes
Fig. 11
Fig. 11
GSEA associated with the five genes expression. The gene set “GLYCOSAMINOGLYCAN_BIOSYNTHESIS_CHONDROTIN_SULFATE” (a), “LYSOSOME” (b), “ADHESION_JUNCTION” (b), and “GLYCOSAMINOGLYCAN_BIOSYNTHESIS_CHONDROTIN_SULFATE” (c) were enriched in ccRCC samples with highly expressed PADI1, DPP6 and ATP6V0D2, respectively. The gene set “P53_SIGNALING_PATHWAY” (d) “PPAR_SIGNALING_PATHWAY” (e) and were enriched in ccRCC samples with lowly expressed PLG and C9orf135, respectively

Similar articles

Cited by

References

    1. Siegel RL, Miller KD, Jemal A. Cancer statistics, 2018. CA Cancer J Clin. 2018;68(1):7–30. doi: 10.3322/caac.21442. - DOI - PubMed
    1. Ferlay J, Soerjomataram I, Dikshit R, Eser S, Mathers C, Rebelo M, Parkin DM, Forman D, Bray F. Cancer incidence and mortality worldwide: sources, methods and major patterns in GLOBOCAN 2012. Int J Cancer. 2015;136(5):E359–E386. doi: 10.1002/ijc.29210. - DOI - PubMed
    1. Hsieh JJ, Purdue MP, Signoretti S, Swanton C, Albiges L, Schmidinger M, Heng DY, Larkin J, Ficarra V. Renal cell carcinoma. Nat Rev Dis Primers. 2017;3:17009. doi: 10.1038/nrdp.2017.9. - DOI - PMC - PubMed
    1. Gettman MT, Blute ML, Spotts B, Bryant SC, Zincke HJC. Pathologic staging of renal cell carcinoma: significance of tumor classification with the 1997 TNM staging system. Cancer. 2001;91(2):354–361. doi: 10.1002/1097-0142(20010115)91:2<354::AID-CNCR1009>3.0.CO;2-9. - DOI - PubMed
    1. Yao X, Qi L, Chen X, Du J, Zhang Z, Liu S. Expression of CX3CR1 associates with cellular migration, metastasis, and prognosis in human clear cell renal cell carcinoma. Urol Oncol. 2014;32(2):162–170. doi: 10.1016/j.urolonc.2012.12.006. - DOI - PubMed

LinkOut - more resources