. 2019 Dec 20;12(1):plz080.
doi: 10.1093/aobpla/plz080. eCollection 2020 Feb.

Genet assignment and population structure analysis in a clonal forest-floor herb, Cardamine leucantha, using RAD-seq

Affiliations

Genet assignment and population structure analysis in a clonal forest-floor herb, Cardamine leucantha, using RAD-seq

Michiaki Tsujimoto et al. AoB Plants. .

Abstract

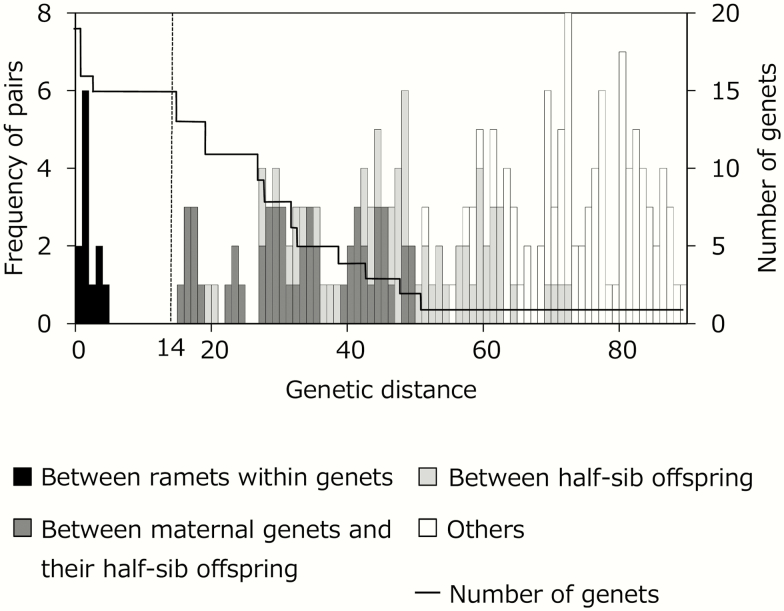
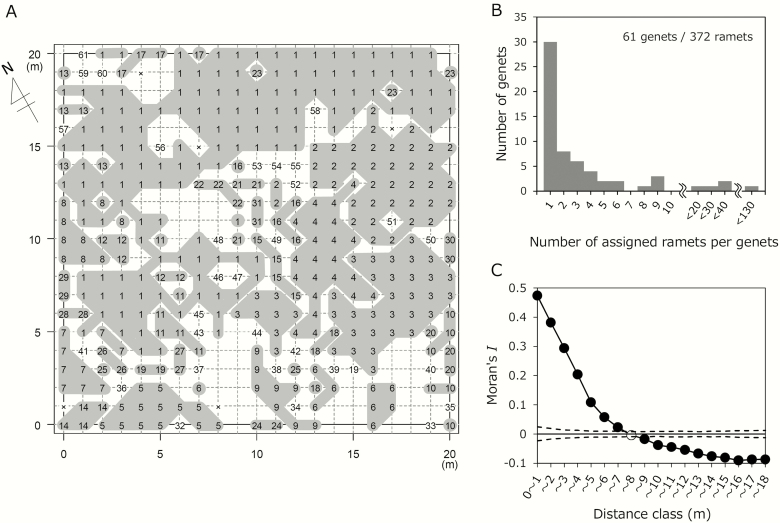
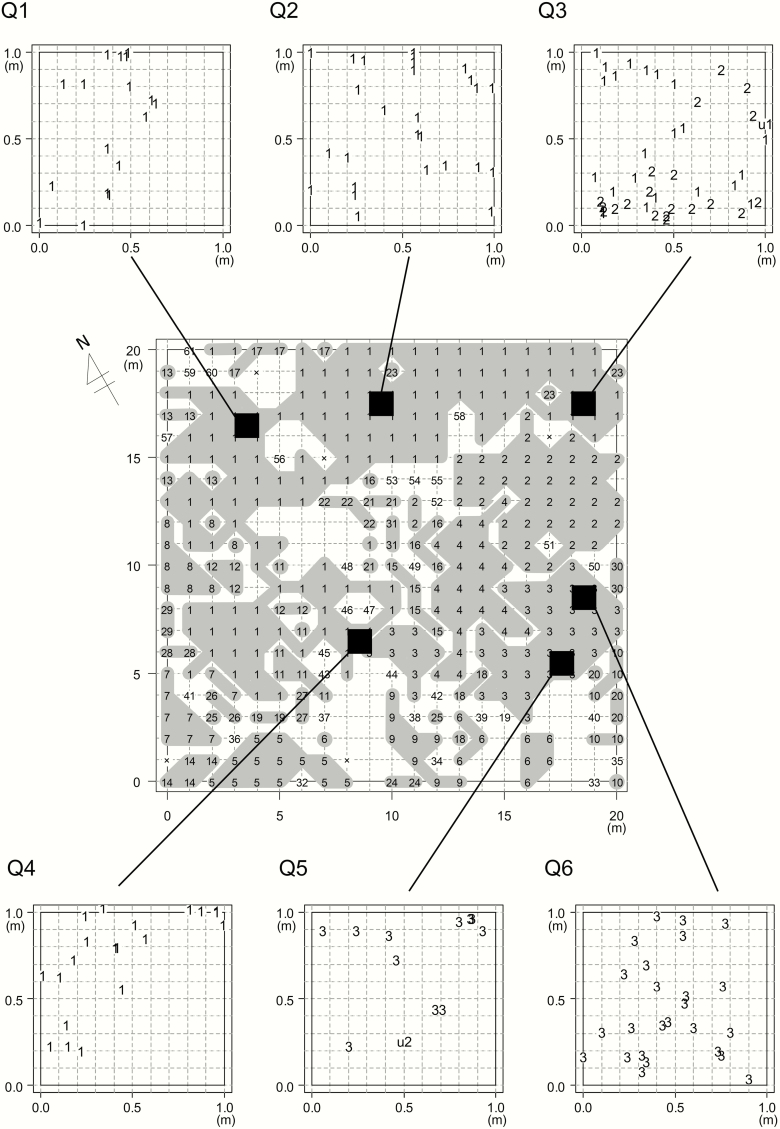
To study the genetic structure of clonal plant populations, genotyping and genet detection using genetic markers are necessary to assign ramets to corresponding genets. Assignment is difficult as it involves setting a robust threshold of genetic distance for genet distinction as neighbouring genets in a plant population are often genetically related. Here, we used restriction site-associated DNA sequencing (RAD-seq) for a rhizomatous clonal herb, Cardamine leucantha [Brassicaceae] to accurately determine genet structure in a natural population. We determined a draft genome sequence of this species for the first time, which resulted in 66 617 scaffolds with N50 = 6086 bp and an estimated genome size of approximately 253 Mbp. Using genetic distances based on the RAD-seq analysis, we successfully distinguished ramets that belonged to distinct genets even from a half-sib family. We applied these methods to 372 samples of C. leucantha collected at 1-m interval grids within a 20 × 20 m plot in a natural population in Hokkaido, Japan. From these samples, we identified 61 genets with high inequality in terms of genet size and patchy distribution. Spatial autocorrelation analyses indicated significant aggregation within 7 and 4 m at ramet and genet levels, respectively. An analysis of parallel DNA microsatellite loci (simple sequence repeats) suggested that RAD-seq can provide data that allows robust genet assignment. It remains unclear whether the large genets identified here became dominant stochastically or deterministically. Precise identification of genets will assist further study and characterization of dominant genets.

Keywords: Cardamine leucantha; RAD-seq; clonal plants; forest-floor herbaceous plants; genet assignment; population structure; stoloniferous rhizome.


Figures

Figure 1.
Figure 1.
Map showing the location of the Cardamine leucantha study site at Rikubetsu-cho, Hokkaido, Japan (A), map showing the position of the 20 × 20 m main plot in the site (B) and a photograph of the study plot (C). In (A) and (B), the direction and distance are represented by upward arrows and bars, respectively.
Figure 2.
Figure 2.
Validation of the genet assignment procedure applied for the restriction site-associated DNA sequencing (RAD-seq) analysis in this study. Frequency distributions of pairwise genetic distances between ramets with known genetic relationships are shown by bars with different shades. Pairs between clonal ramets within genets, between maternal ramet and their half-sib offspring, between half-sib offspring and between un-related genets are represented in black, dark-grey, grey and open bars, respectively. A solid line represents the number of genets when the corresponding genetic distances were used as a threshold for assignment. A dashed line represents the selected threshold of genetic distance. Genetic distances were calculated using 264 single nucleotide polymorphisms (SNPs) with a depth of ≥ 10 and based on an infinite allele model.
Figure 3.
Figure 3.
Genet assignment of the study plot in a natural population of Cardamine leucantha. Frequency distribution of pairwise genetic distances between ramets calculated from SNPs in the RAD-seq analysis (grey bars) and number of genets when the corresponding genetic distances were used as a threshold for genet assignment (solid line). A ramet with a genetic distance smaller than the threshold of at least one of the ramets within a certain genet was assigned to the genet. A dashed line represents the threshold of genetic distance applied for genet assignment (= 43). Frequency distribution of all pairs (A) and an enlarged view near the applied threshold (B, corresponding to the right grey area in A) are shown. Ramet pairs represented by dark grey bars were assigned to members of the same genet. Ramet pairs represented by grey bars were considered to be from different genets. Genetic distances were calculated using 363 SNPs with a depth ≥ 10 based on an infinite allele model. For this analysis, 384 selected samples obtained at the grid points of the study plot were used, except for those with less than 90 % of selected SNPs (12 samples).
Figure 4.
Figure 4.
Genet structure of the main plot determined by the RAD-seq analysis (A–C). Spatial distribution of genets (A), frequency distribution of ramet number per genet (B) and spatial aggregation of ramets belonging to the same genet shown by the spatial autocorrelation analysis on the ramet distribution (C) are listed. In (A), ramets were sampled at grid points of the main plot (crossing points of grid lines set at 1 m intervals) in 2012. Different numbers represent different genets. Genets were ranked by the number of assigned ramets in the samples. Genets consisting of at least two ramets are represented by grey shades. Ungenotyped samples are shown by ‘x’. The orientation of the plot is shown by an upward arrow. In (C), spatial autocorrelation was analysed based on whether a particular set of ramets belonged to the same genet. Solid lines and circles represent Moran’s I at different distances. Dotted lines represent 95 % confidence limits in the null model based on 1000 permutation tests. The filled circles represent significant (P < 0.05) deviations from the null model.
Figure 5.
Figure 5.
Fine-scale spatial distribution of genets within six 1 × 1 m quadrats (Q1–Q6). Different numbers represent different genets. The locations of six quadrats are shown on the spatial distribution of genets determined in the previous year. Q1–Q4 and Q5–Q6 were set in areas where genets G1 and G3 were dominant, respectively. Q3 was set near the border with genet G2. We performed RAD-seq by adding the samples of genets G1–G3 from the previous analysis, and then determined whether the ramets within the six quadrats belonged to any of the three genets. As a result, two genets were detected (u1 and u2), which were not assigned to G1–G3. We used 472 SNPs with a depth of 10.

References

    1. Ally D, Ritland K, Otto SP. 2008. Can clone size serve as a proxy for clone age? An exploration using microsatellite divergence in Populus tremuloides. Molecular Ecology 17:4897–4911. - PubMed
    1. Al-Shehbaz IA, Arai K, Ohba H. 2006a. Cruciferae. In: Iwatsuki K, Boufford DE, Ohba H, eds. Flora of Japan, Vol. IIa Tokyo: Kodansha, 454–511.
    1. Al-Shehbaz IA, Beilstein MA, Kellogg EA. 2006b. Systematics and phylogeny of the Brassicaceae (Cruciferae): an overview. Plant Systematics and Evolution 259:89–120.
    1. Araki K, Ohara M. 2008. Reproductive demography of ramets and genets in a rhizomatous clonal plant Convallaria keiskei. Journal of Plant Research 121:147–154. - PubMed
    1. Araki K, Shimatani K, Ohara M. 2007. Floral distribution, clonal structure, and their effects on pollination success in a self-incompatible Convallaria keiskei population in northern Japan. Plant Ecology 189:175–186.