. 2019 Nov 24;9(1):1682381.
doi: 10.1080/2162402X.2019.1682381. eCollection 2020.

Preclinical evaluation of an affinity-enhanced MAGE-A4-specific T-cell receptor for adoptive T-cell therapy

Affiliations

Preclinical evaluation of an affinity-enhanced MAGE-A4-specific T-cell receptor for adoptive T-cell therapy

Joseph P Sanderson et al. Oncoimmunology. .

Abstract

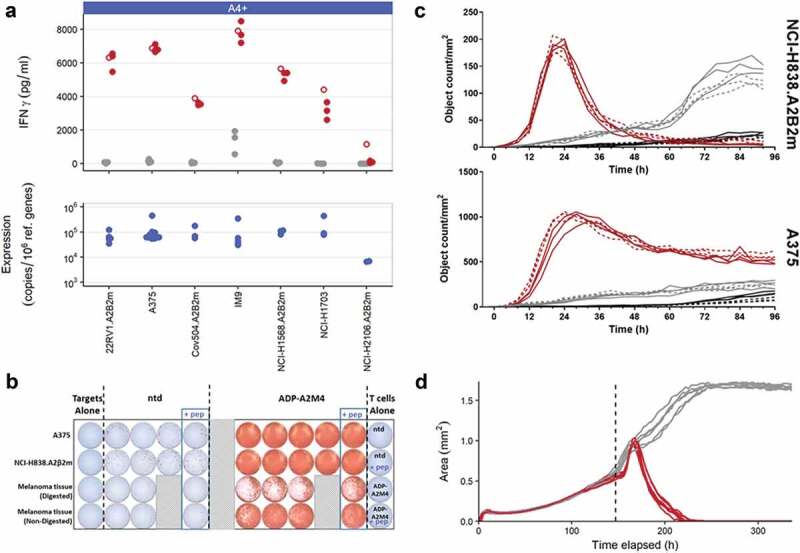
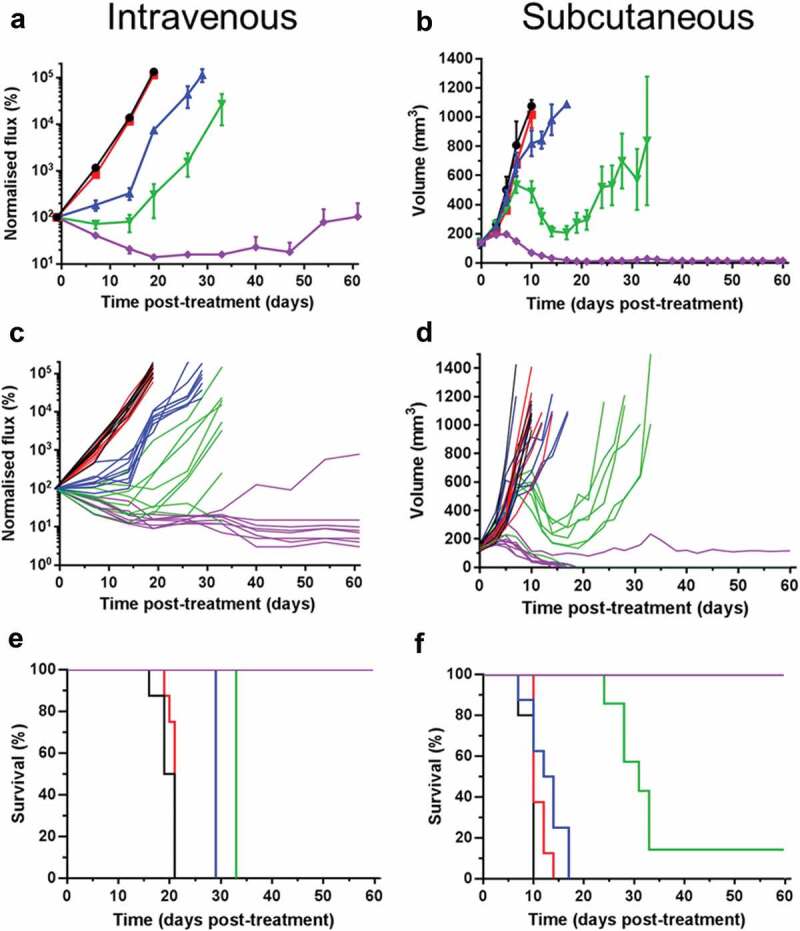
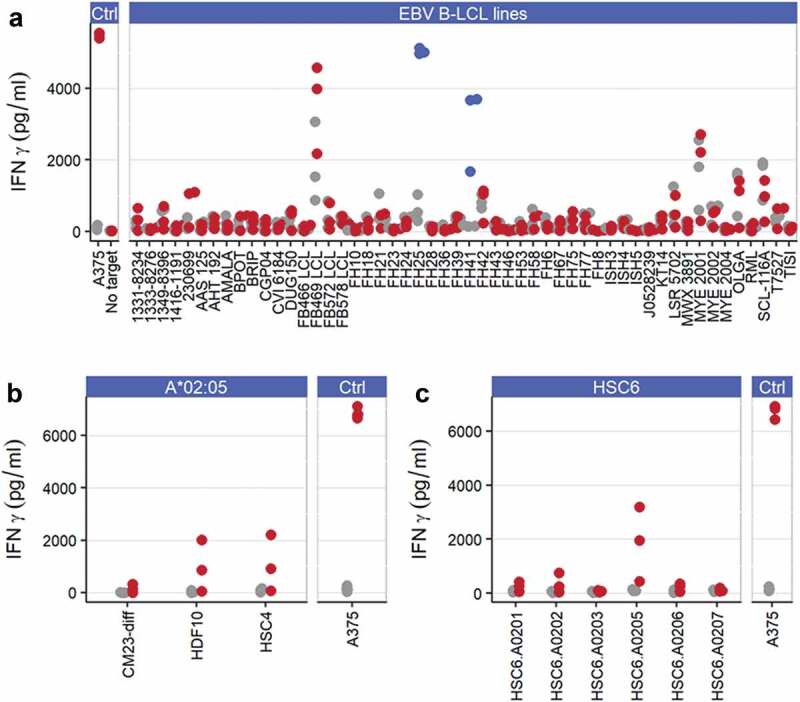
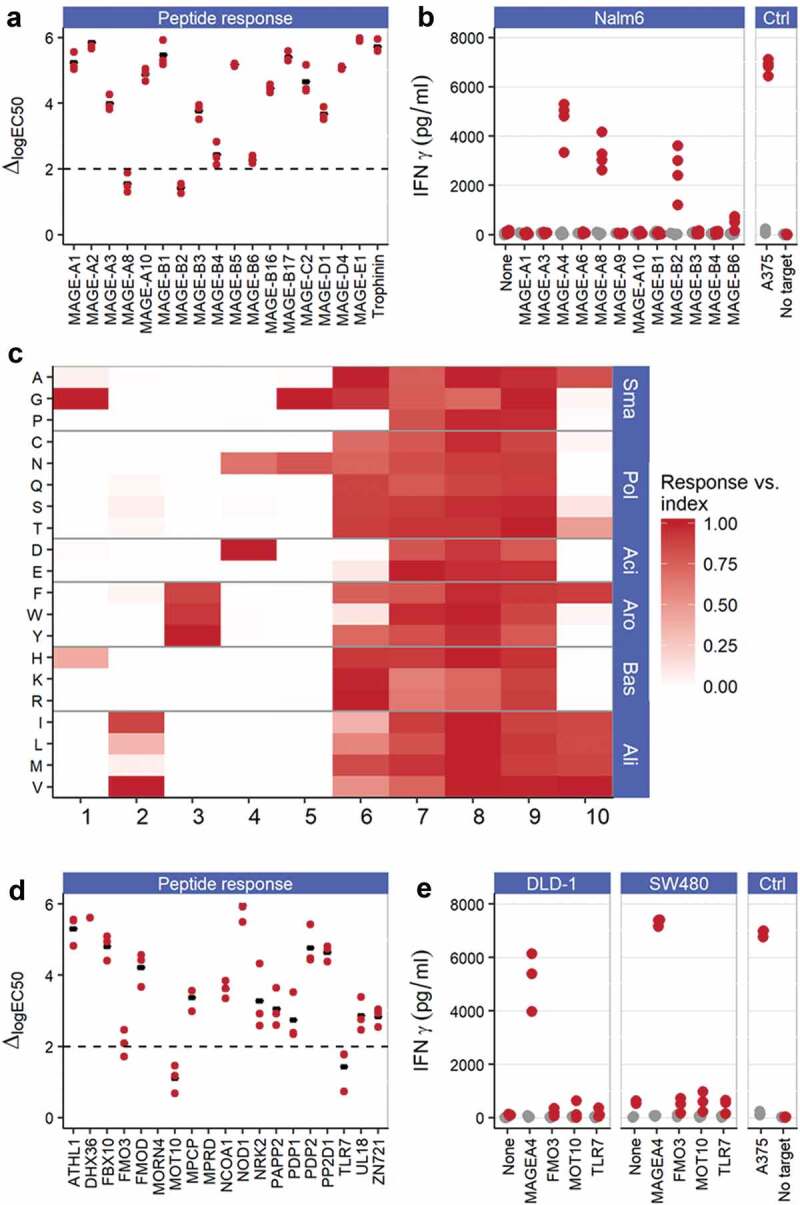
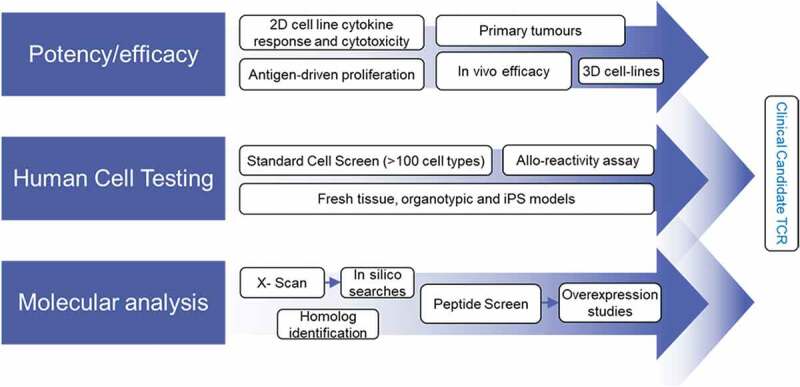
A substantial obstacle to the success of adoptive T cell-based cancer immunotherapy is the sub-optimal affinity of T-cell receptors (TCRs) for most tumor antigens. Genetically engineered TCRs that have enhanced affinity for specific tumor peptide-MHC complexes may overcome this barrier. However, this enhancement risks increasing weak TCR cross-reactivity to other antigens expressed by normal tissues, potentially leading to clinical toxicities. To reduce the risk of such adverse clinical outcomes, we have developed an extensive preclinical testing strategy, involving potency testing using 2D and 3D human cell cultures and primary tumor material, and safety testing using human primary cell and cell-line cross-reactivity screening and molecular analysis to predict peptides recognized by the affinity-enhanced TCR. Here, we describe this strategy using a developmental T-cell therapy, ADP-A2M4, which recognizes the HLA-A2-restricted MAGE-A4 peptide GVYDGREHTV. ADP-A2M4 demonstrated potent anti-tumor activity in the absence of major off-target cross-reactivity against a range of human primary cells and cell lines. Identification and characterization of peptides recognized by the affinity-enhanced TCR also revealed no cross-reactivity. These studies demonstrated that this TCR is highly potent and without major safety concerns, and as a result, this TCR is now being investigated in two clinical trials (NCT03132922, NCT04044768).

Keywords: MAGE-A4; T-cell receptor; adoptive T-cell therapy; affinity-enhanced; preclinical screening.


Figures

Figure 1.
Figure 1.
In vitro efficacy of ADP-A2M4 against MAGE-A4+ and HLA-A*02:01 tumor cells. (a) ADP-A2M4 release IFNγ in response to MAGE-A4+ tumor cell lines. Upper panel: IFNγ release from ADP-A2M4 (red points) and non-transduced T cells (gray points), as determined by cell-ELISA. Unfilled points show response to MAGE-A4231-240 peptide (10–5 M) to demonstrate maximal response. Each point reflects the average response of a single T-cell product in multiple independent experiments (three T cell products tested). Lower panel: MAGE-A4 expression in matched tumor line samples, as determined by qPCR (normalized to expression of reference genes RPL32, HPRT1). (b) ADP-A2M4, but not non-transduced T cells, release IFNγ in response to ex vivo-processed primary melanoma material, as determined by ELISpot. (c) ADP-A2M4 display cytotoxic activity toward two MAGE-A4-expressing tumor lines, as determined by IncuCyte time-lapse microscopy with a caspase-3/7 fluorogenic dye. Each line shows the number of apoptotic target cells within a single well when cultured with ADP-A2M4 (red lines) or non-transduced T cells (gray lines), or in the absence of T cells (black lines). Dashed lines show response to MAGE-A4231-240 peptide (10–5 M) to demonstrate maximal response. Data shown are of one T-cell product, representative of three tested. (d) ADP-A2M4 display cytotoxic activity toward the GFP+MAGE-A4+ tumor line A375 cultured in 3D microtissues, as determined by IncuCyte time-lapse microscopy. Each line shows the area of the microtissue within a single well when cultured with ADP-A2M4 (red lines) or non-transduced T cells (gray lines). Data shown are of one T-cell product, representative of three tested. Dashed vertical line indicates T-cell addition.
Figure 2.
Figure 2.
ADP-A2M4 dose-dependently inhibit the growth of MAGE-A4+ A375 tumors, leading to regression and increased survival in i.v. (a, c, e) or s.c. (b, d, f) xenograft models. A, B: Mean (± SEM) and C, D: individual tumor growth curves, and; e, f: Kaplan Meier survival curves following a single dose of ADP-A2M4 administered on D 0 (n = 7–8 per group, untreated group: n = 5). Black lines: no treatment; red lines: 3 × 10⁶ non-transduced T cells; blue, green, and violet lines: 3 × 10⁵, 1 × 10⁶, and 3 × 10⁶ ADP-A2M4.
Figure 3.
Figure 3.
ADP-A2M4 display alloreactivity toward HLA-A*02:05. (a) ADP-A2M4 respond to two HLA-A*02:05 EBV-derived B-LCLs (FH25, FH41; blue points) but not other cell lines. (b) ADP-A2M4 react to 2/3 HLA-A*02:05-expressing human primary cells. (c) ADP-A2M4 respond to human primary Schwann cells transduced to express HLA-A*02:05 but not other HLA-A2 alleles. Points in all panels show IFNγ release from ADP-A2M4 (red or blue points) and non-transduced cells (gray points), as determined by cell-ELISA. Each point reflects the average response of a single T-cell product in multiple independent experiments (three T cell products tested).
Figure 4.
Figure 4.
ADP-A2M4 do not display relevant off-target peptide cross-reactivities. (a) ADP-A2M4 respond to MAGE-A8 and MAGE-B2 peptides and less strongly to MAGE-B4 and MAGE-B6 peptides. Data show the shift in logEC50 (ΔlogEC50) from index peptide when ADP-A2M4 were challenged with the peptides of interest. Each point shows the ΔlogEC50 for a single T-cell product (three T cell products tested); black bar indicates geometric mean. Y-axis truncated at 6 to exclude peptides with very weak responses where quantification of response is not reliable. Dashed line: logΔEC50 = 2. (b) ADP-A2M4 respond to Nalm6 cells transduced to express MAGE-A4, MAGE-A8, and MAGE-B2, but not other MAGE proteins. Points show IFNγ release from ADP-A2M4 (red points) and non-transduced cells (gray points), as determined by cell-ELISA. Each point reflects the average response of a single T-cell product in multiple independent experiments (three T cell products tested). (c) X-scan data show that the ADP-A2M4 TCR displays highly asymmetric specificity, with specific reactivity toward the N-terminal half of the index peptide, and promiscuous recognition of peptides containing substitutions within the C-terminal half of the peptide. Data show the response of three T-cell products toward indicated substitutions as fraction of response to MAGE-A4231-240. Substitutions divided by physicochemical properties: Sma: small; Pol: polar; Aci: acidic; Aro: aromatic; Bas: basic; Ali: aliphatic. (d) ADP-A2M4 respond to FMO3, MOT10, and TLR7-derived peptides. Data show ΔlogEC50 from index peptide when ADP-A2M4 were challenged with the peptides of interest. Each point shows the logΔEC50 for a single T-cell product (three T cell products tested); black bar indicates geometric mean. Y-axis truncated at 6 to exclude peptides with very weak responses where quantification of peptide response is not reliable. Dashed line: logΔEC50 = 2. (e) ADP-A2M4 do not respond to DLD-1 or SW480 cells transfected to express FMO3, MOT10, or TLR7 proteins. Points show IFNγ release from ADP-A2M4 (red points) and non-transduced cells (gray points), as determined by cell-ELISA. Each point reflects the average response of a single T-cell product in multiple independent experiments (three T cell products tested).
Figure 5.
Figure 5.
Preclinical screening process for affinity-enhanced TCRs.

References

    1. Fournier C, Martin F, Zitvogel L, Kroemer G, Galluzzi L, Apetoh L.. Trial watch: adoptively transferred cells for anticancer immunotherapy. Oncoimmunology. 2017;6:e1363139. doi:10.1080/2162402X.2017.1363139. - DOI - PMC - PubMed
    1. Ping Y, Liu C, Zhang Y. T-cell receptor-engineered T cells for cancer treatment: current status and future directions. Protein Cell. 2018;9:254–11. doi:10.1007/s13238-016-0367-1. - DOI - PMC - PubMed
    1. Aleksic M, Liddy N, Molloy PE, Pumphrey N, Vuidepot A, Chang K-M, Jakobsen BK, Robbins PF, Morgan RA, Feldman SA, et al. Different affinity windows for virus and cancer-specific T-cell receptors: implications for therapeutic strategies. Eur J Immunol. 2012;42:3174–3179. doi:10.1002/eji.201242606. - DOI - PMC - PubMed
    1. Garrido F, Cabrera T, Aptsiauri N. “Hard” and “soft” lesions underlying the HLA class I alterations in cancer cells: implications for immunotherapy. Int J Cancer. 2010;127:249–256. doi:10.1002/ijc.25270. - DOI - PubMed
    1. Bossi G, Gerry AB, Paston SJ, Sutton DH, Hassan NJ, Jakobsen BK. Examining the presentation of tumor-associated antigens on peptide-pulsed T2 cells. Oncoimmunology. 2013;2:e26840. - PMC - PubMed

Publication types

Substances

Associated data